 EAM_Dynamo_FarkasJones_1996_NbTiAl__MO_042691367780_000
| Title
A single sentence description.
|
EAM potential (LAMMPS cubic hermite tabulation) for the Nb-Ti-Al system developed by Farkas and Jones (1996) v000 |
|---|---|
| Description
A short description of the Model describing its key features including for example: type of model (pair potential, 3-body potential, EAM, etc.), modeled species (Ac, Ag, ..., Zr), intended purpose, origin, and so on.
|
Interatomic potentials of the embedded-atom type were developed for the Nb-Al system via an empirical fitting to the properties of A15 Nb_3Al. The cohesive energy and lattice parameters are fitted by the potentials, which also give good agreement with experimental values for the same properties in the phase. A second interatomic potential was developed for the Nb-Ti system via a fitting to the lattice parameters and thermodynamic properties of the disordered BCC phase. The Al and Ti potentials used here are the same as those used in our previous work to derive Ti-Al potentials based on TiAl. This allows the use of the present potentials in conjunction with those previously derived interactions to study ternary Nb-Ti-Al alloys. The potentials were used to calculate the heats of solution of Al and Ti in Nb, and to simulate the orthorhombic phase. |
| Species
The supported atomic species.
| Al, Nb, Ti |
| Disclaimer
A statement of applicability provided by the contributor, informing users of the intended use of this KIM Item.
|
None |
| Content Origin | NIST IPRP (https://www.ctcms.nist.gov/potentials/Nb.html#Nb-Ti-Al) |
| Contributor |
Ellad B. Tadmor |
| Maintainer |
Ellad B. Tadmor |
| Developer |
Chris Jones Diana Farkas |
| Published on KIM | 2018 |
| How to Cite | Click here to download this citation in BibTeX format. |
| Citations
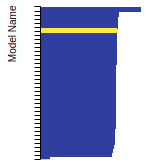
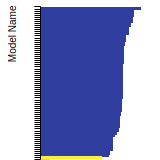
This panel presents information regarding the papers that have cited the interatomic potential (IP) whose page you are on. The OpenKIM machine learning based Deep Citation framework is used to determine whether the citing article actually used the IP in computations (denoted by "USED") or only provides it as a background citation (denoted by "NOT USED"). For more details on Deep Citation and how to work with this panel, click the documentation link at the top of the panel. The word cloud to the right is generated from the abstracts of IP principle source(s) (given below in "How to Cite") and the citing articles that were determined to have used the IP in order to provide users with a quick sense of the types of physical phenomena to which this IP is applied. The bar chart shows the number of articles that cited the IP per year. Each bar is divided into green (articles that USED the IP) and blue (articles that did NOT USE the IP). Users are encouraged to correct Deep Citation errors in determination by clicking the speech icon next to a citing article and providing updated information. This will be integrated into the next Deep Citation learning cycle, which occurs on a regular basis. OpenKIM acknowledges the support of the Allen Institute for AI through the Semantic Scholar project for providing citation information and full text of articles when available, which are used to train the Deep Citation ML algorithm. |
This panel provides information on past usage of this interatomic potential (IP) powered by the OpenKIM Deep Citation framework. The word cloud indicates typical applications of the potential. The bar chart shows citations per year of this IP (bars are divided into articles that used the IP (green) and those that did not (blue)). The complete list of articles that cited this IP is provided below along with the Deep Citation determination on usage. See the Deep Citation documentation for more information. 
38 Citations (30 used)
Help us to determine which of the papers that cite this potential actually used it to perform calculations. If you know, click the .
USED (definite) P. Dumitraschkewitz, H. Clemens, S. Mayer, and D. Holec, “Impact of Alloying on Stacking Fault Energies in γ-TiAl,” Applied Sciences. 2017. link Times cited: 20 Abstract: Microstructure and mechanical properties are key parameters … read more USED (low confidence) N. Tuchinda and C. Schuh, “Triple junction solute segregation in Al-based polycrystals,” Physical Review Materials. 2023. link Times cited: 3 USED (low confidence) K. Xue, Y. Zhang, M. Meng, L. Wang, and P. Li, “Fracture behavior of B2 phase matrix of Ti2AlNb-based alloy with microcracks of different orientations,” Engineering Fracture Mechanics. 2023. link Times cited: 1 USED (low confidence) B. Waters, D. S. Karls, I. Nikiforov, R. Elliott, E. Tadmor, and B. Runnels, “Automated determination of grain boundary energy and potential-dependence using the OpenKIM framework,” Computational Materials Science. 2022. link Times cited: 5 USED (low confidence) A. Rajput and S. Paul, “Influence of hard inclusion on Bauschinger effect and cyclic deformation behaviour: An atomistic simulation on single-crystal and polycrystal aluminium,” Materials Today Communications. 2022. link Times cited: 1 USED (low confidence) D. Trong, V. C. Long, and Ș. Ţălu, “Effects of Number of Atoms and Doping Concentration on the Structure, Phase Transition, and Crystallization Process of Fe1-x-yNixCoy Alloy: A Molecular Dynamic Study,” Applied Sciences. 2022. link Times cited: 6 Abstract: In this study, molecular dynamics simulations are employed t… read more USED (low confidence) N. Zotov and B. Grabowski, “Entropy of kink pair formation on screw dislocations: an accelerated molecular dynamics study,” Modelling and Simulation in Materials Science and Engineering. 2022. link Times cited: 3 Abstract: The Gibbs energy ΔG kp(τ, T) of kink pair formation on screw… read more USED (low confidence) P. Li et al., “Diffusion and mechanical properties of Ti2AlNb and TA15 interface: From experiments to molecular dynamics,” Vacuum. 2022. link Times cited: 2 USED (low confidence) B. Grabowski and N. Zotov, “Thermally-activated dislocation mobility in bcc metals: An accelerated molecular dynamics study,” Computational Materials Science. 2021. link Times cited: 2 USED (low confidence) S. Chen, Z. Aitken, V. Sorkin, Z. Yu, Z. Wu, and Y.-W. Zhang, “Modified Embedded‐Atom Method Potentials for the Plasticity and Fracture Behaviors of Unary HCP Metals,” Advanced Theory and Simulations. 2021. link Times cited: 3 Abstract: Modified embedded‐atom method (MEAM) potentials have been wi… read more USED (low confidence) N. Zotov and B. Grabowski, “Molecular dynamics simulations of screw dislocation mobility in bcc Nb,” Modelling and Simulation in Materials Science and Engineering. 2021. link Times cited: 8 Abstract: The screw dislocation mobility in bcc Nb has been studied by… read more USED (low confidence) S. Yan et al., “Interlamellar boundaries govern cracking,” Acta Materialia. 2021. link Times cited: 15 USED (low confidence) Q. Pei, M. Jhon, S. Quek, and Z. Wu, “A systematic study of interatomic potentials for mechanical behaviours of Ti-Al alloys,” Computational Materials Science. 2021. link Times cited: 19 USED (low confidence) L.-F. Zhu, J. Janssen, S. Ishibashi, F. Körmann, B. Grabowski, and J. Neugebauer, “A fully automated approach to calculate the melting temperature of elemental crystals,” Computational Materials Science. 2021. link Times cited: 17 USED (low confidence) J. Kundu, A. Chakraborty, and S. Kundu, “Bonding pressure effects on characteristics of microstructure, mechanical properties, and mass diffusivity of Ti-6Al-4V and TiAlNb diffusion-bonded joints,” Welding in the World. 2020. link Times cited: 3 USED (low confidence) A. B. Patel and H. Sheng, “Structure and atomic transport of liquid titanium from a pair potential model,” Physical Review B. 2020. link Times cited: 1 USED (low confidence) P. Li, L. Wang, S.-liang Yan, M. Meng, and K. Xue, “Temperature effect on the diffusion welding process and mechanism of B2–O interface in the Ti2AlNb-based alloy:A molecular dynamics simulation,” Vacuum. 2020. link Times cited: 17 USED (low confidence) H. N. Pishkenari, F. S. Yousefi, and A. Taghibakhshi, “Determination of surface properties and elastic constants of FCC metals: a comparison among different EAM potentials in thin film and bulk scale,” Materials Research Express. 2018. link Times cited: 22 Abstract: Three independent elastic constants C11, C12, and C44 were c… read more USED (low confidence) B. Jeong, J. Kim, T. Lee, S.-W. Kim, and S. Ryu, “Systematic investigation of the deformation mechanisms of a γ-TiAl single crystal,” Scientific Reports. 2018. link Times cited: 25 USED (low confidence) K. Choudhary, A. Biacchi, S. Ghosh, L. Hale, A. Walker, and F. Tavazza, “High-throughput assessment of vacancy formation and surface energies of materials using classical force-fields,” Journal of Physics: Condensed Matter. 2018. link Times cited: 16 Abstract: In this work, we present an open access database for surface… read more USED (low confidence) S. Bukkuru, U. Bhardwaj, K. S. Rao, A. Rao, M. Warrier, and M. C. Valsakumar, “Kinetics of self-interstitial migration in bcc and fcc transition metals,” Materials Research Express. 2018. link Times cited: 11 Abstract: Radiation damage is a multi-scale phenomenon. A thorough und… read more USED (low confidence) S. Bukkuru, U. Bhardwaj, M. Warrier, A. Rao, and M. C. Valsakumar, “Identifying self-interstitials of bcc and fcc crystals in molecular dynamics,” Journal of Nuclear Materials. 2017. link Times cited: 6 USED (low confidence) S. M. Rassoulinejad-Mousavi, Y. Mao, and Y. Zhang, “Evaluation of Copper, Aluminum and Nickel Interatomic Potentials on Predicting the Elastic Properties,” arXiv: Computational Physics. 2016. link Times cited: 63 Abstract: Choice of appropriate force field is one of the main concern… read more USED (low confidence) Y.-xia Liu, H. Wang, H. Wu, D. Xu, and R. Yang, “A mean-field interatomic potential for a multi-component β-type titanium alloy,” Computational Materials Science. 2014. link Times cited: 2 USED (low confidence) B. Wu et al., “The ordering behaviour of the O phase in Ti 2 AlNb-based alloys,” Intermetallics. 2002. link Times cited: 17 USED (low confidence) D. Farkas, “Atomistic simulations of fracture in the B2 phase of the Nb–Ti–Al system,” Materials Science and Engineering A-structural Materials Properties Microstructure and Processing. 1998. link Times cited: 15 USED (low confidence) D. Farkas and C. Jones, “Dislocation core structure in the B2 phase of Nb-40%Ti-15%Al,” Computational Materials Science. 1996. link Times cited: 5 USED (low confidence) C. Jones and D. Farkas, “Embedded atom simulation of the B2 phase in Nb-Ti-Al,” Computational Materials Science. 1996. link Times cited: 6 USED (low confidence) G. Zheng et al., “Coupled nucleation of dual-phase lamellar structure,” The Innovation Materials. 2023. link Times cited: 0 Abstract: Although lamellar structures widely exist in materials, the … read more USED (low confidence) T. Boll and T. Al-Kassab, “Interpretation of atom probe tomography data for the intermetallic TiAl+Nb by means of field evaporation simulation.,” Ultramicroscopy. 2013. link Times cited: 10 NOT USED (low confidence) J. Lu, J. Wang, K. Wan, Y. Chen, H. Wang, and X. Shi, “An accurate interatomic potential for the TiAlNb ternary alloy developed by deep neural network learning method.,” The Journal of chemical physics. 2023. link Times cited: 0 Abstract: The complex phase diagram and bonding nature of the TiAl sys… read more NOT USED (low confidence) H. Xiang and W. Guo, “A newly developed interatomic potential of Nb−Al−Ti ternary systems for high-temperature applications,” Acta Mechanica Sinica. 2022. link Times cited: 5 NOT USED (low confidence) H. Xiang and W. Guo, “A newly developed interatomic potential of Nb−Al−Ti ternary systems for high-temperature applications,” Acta Mechanica Sinica. 2022. link Times cited: 0 NOT USED (high confidence) D. Farkas and A. Caro, “Model interatomic potentials for Fe–Ni–Cr–Co–Al high-entropy alloys,” Journal of Materials Research. 2020. link Times cited: 76 Abstract: A set of embedded atom model (EAM) interatomic potentials wa… read more NOT USED (high confidence) D. Vizoso, C. Deo, and R. Dingreville, “Scaling laws and stability of nano-sized defect clusters in niobium via atomistic simulations and statistical analysis,” Journal of Materials Science. 2019. link Times cited: 4 NOT USED (high confidence) D. Farkas and A. Caro, “Model interatomic potentials and lattice strain in a high-entropy alloy,” Journal of Materials Research. 2018. link Times cited: 158 Abstract: A set of embedded atom method model interatomic potentials i… read more NOT USED (high confidence) K. Choudhary, F. Y. Congo, T. Liang, C. Becker, R. Hennig, and F. Tavazza, “Evaluation and comparison of classical interatomic potentials through a user-friendly interactive web-interface,” Scientific Data. 2017. link Times cited: 21 |
| Funding | Not available |
| Short KIM ID
The unique KIM identifier code.
| MO_042691367780_000 |
| Extended KIM ID
The long form of the KIM ID including a human readable prefix (100 characters max), two underscores, and the Short KIM ID. Extended KIM IDs can only contain alpha-numeric characters (letters and digits) and underscores and must begin with a letter.
| EAM_Dynamo_FarkasJones_1996_NbTiAl__MO_042691367780_000 |
| DOI |
10.25950/3eacab42 https://doi.org/10.25950/3eacab42 https://commons.datacite.org/doi.org/10.25950/3eacab42 |
| KIM Item Type
Specifies whether this is a Portable Model (software implementation of an interatomic model); Portable Model with parameter file (parameter file to be read in by a Model Driver); Model Driver (software implementation of an interatomic model that reads in parameters).
| Portable Model using Model Driver EAM_Dynamo__MD_120291908751_005 |
| Driver | EAM_Dynamo__MD_120291908751_005 |
| KIM API Version | 2.0 |
| Potential Type | eam |
| Grade | Name | Category | Brief Description | Full Results | Aux File(s) |
|---|---|---|---|---|---|
| P | vc-species-supported-as-stated | mandatory | The model supports all species it claims to support; see full description. |
Results | Files |
| P | vc-periodicity-support | mandatory | Periodic boundary conditions are handled correctly; see full description. |
Results | Files |
| P | vc-permutation-symmetry | mandatory | Total energy and forces are unchanged when swapping atoms of the same species; see full description. |
Results | Files |
| B | vc-forces-numerical-derivative | consistency | Forces computed by the model agree with numerical derivatives of the energy; see full description. |
Results | Files |
| F | vc-dimer-continuity-c1 | informational | The energy versus separation relation of a pair of atoms is C1 continuous (i.e. the function and its first derivative are continuous); see full description. |
Results | Files |
| P | vc-objectivity | informational | Total energy is unchanged and forces transform correctly under rigid-body translation and rotation; see full description. |
Results | Files |
| P | vc-inversion-symmetry | informational | Total energy is unchanged and forces change sign when inverting a configuration through the origin; see full description. |
Results | Files |
| N/A | vc-memory-leak | informational | The model code does not have memory leaks (i.e. it releases all allocated memory at the end); see full description. |
Results | Files |
| P | vc-thread-safe | mandatory | The model returns the same energy and forces when computed in serial and when using parallel threads for a set of configurations. Note that this is not a guarantee of thread safety; see full description. |
Results | Files |
| P | vc-unit-conversion | mandatory | The model is able to correctly convert its energy and/or forces to different unit sets; see full description. |
Results | Files |
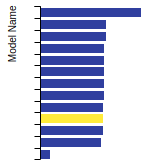
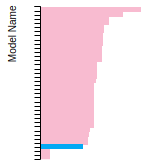
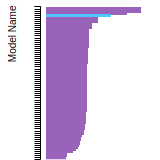
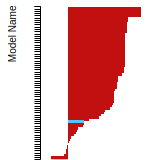
BCC Lattice Constant
This bar chart plot shows the mono-atomic body-centered cubic (bcc) lattice constant predicted by the current model (shown in the unique color) compared with the predictions for all other models in the OpenKIM Repository that support the species. The vertical bars show the average and standard deviation (one sigma) bounds for all model predictions. Graphs are generated for each species supported by the model.
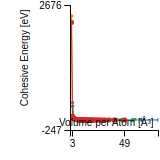
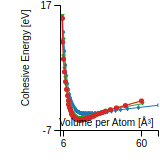
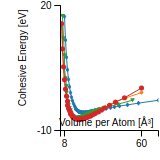
Cohesive Energy Graph
This graph shows the cohesive energy versus volume-per-atom for the current mode for four mono-atomic cubic phases (body-centered cubic (bcc), face-centered cubic (fcc), simple cubic (sc), and diamond). The curve with the lowest minimum is the ground state of the crystal if stable. (The crystal structure is enforced in these calculations, so the phase may not be stable.) Graphs are generated for each species supported by the model.
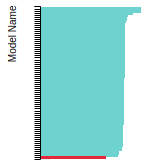
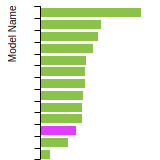
Diamond Lattice Constant
This bar chart plot shows the mono-atomic face-centered diamond lattice constant predicted by the current model (shown in the unique color) compared with the predictions for all other models in the OpenKIM Repository that support the species. The vertical bars show the average and standard deviation (one sigma) bounds for all model predictions. Graphs are generated for each species supported by the model.
Dislocation Core Energies
This graph shows the dislocation core energy of a cubic crystal at zero temperature and pressure for a specific set of dislocation core cutoff radii. After obtaining the total energy of the system from conjugate gradient minimizations, non-singular, isotropic and anisotropic elasticity are applied to obtain the dislocation core energy for each of these supercells with different dipole distances. Graphs are generated for each species supported by the model.
(No matching species)FCC Elastic Constants
This bar chart plot shows the mono-atomic face-centered cubic (fcc) elastic constants predicted by the current model (shown in blue) compared with the predictions for all other models in the OpenKIM Repository that support the species. The vertical bars show the average and standard deviation (one sigma) bounds for all model predictions. Graphs are generated for each species supported by the model.
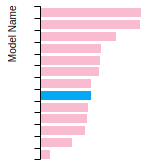
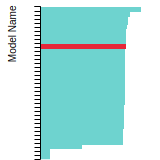
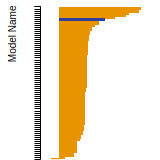
FCC Lattice Constant
This bar chart plot shows the mono-atomic face-centered cubic (fcc) lattice constant predicted by the current model (shown in red) compared with the predictions for all other models in the OpenKIM Repository that support the species. The vertical bars show the average and standard deviation (one sigma) bounds for all model predictions. Graphs are generated for each species supported by the model.
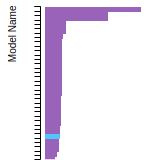
FCC Stacking Fault Energies
This bar chart plot shows the intrinsic and extrinsic stacking fault energies as well as the unstable stacking and unstable twinning energies for face-centered cubic (fcc) predicted by the current model (shown in blue) compared with the predictions for all other models in the OpenKIM Repository that support the species. The vertical bars show the average and standard deviation (one sigma) bounds for all model predictions. Graphs are generated for each species supported by the model.
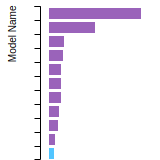
FCC Surface Energies
This bar chart plot shows the mono-atomic face-centered cubic (fcc) relaxed surface energies predicted by the current model (shown in blue) compared with the predictions for all other models in the OpenKIM Repository that support the species. The vertical bars show the average and standard deviation (one sigma) bounds for all model predictions. Graphs are generated for each species supported by the model.
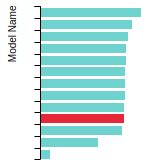
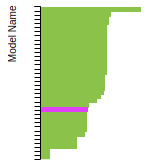
SC Lattice Constant
This bar chart plot shows the mono-atomic simple cubic (sc) lattice constant predicted by the current model (shown in the unique color) compared with the predictions for all other models in the OpenKIM Repository that support the species. The vertical bars show the average and standard deviation (one sigma) bounds for all model predictions. Graphs are generated for each species supported by the model.
Cubic Crystal Basic Properties Table
Species: AlSpecies: Nb
Species: Ti
Creators:
Contributor: karls
Publication Year: 2019
DOI: https://doi.org/10.25950/64cb38c5
This Test Driver uses LAMMPS to compute the cohesive energy of a given monoatomic cubic lattice (fcc, bcc, sc, or diamond) at a variety of lattice spacings. The lattice spacings range from a_min (=a_min_frac*a_0) to a_max (=a_max_frac*a_0) where a_0, a_min_frac, and a_max_frac are read from stdin (a_0 is typically approximately equal to the equilibrium lattice constant). The precise scaling and number of lattice spacings sampled between a_min and a_0 (a_0 and a_max) is specified by two additional parameters passed from stdin: N_lower and samplespacing_lower (N_upper and samplespacing_upper). Please see README.txt for further details.
Creators: Junhao Li and Ellad Tadmor
Contributor: tadmor
Publication Year: 2019
DOI: https://doi.org/10.25950/5853fb8f
Computes the cubic elastic constants for some common crystal types (fcc, bcc, sc, diamond) by calculating the hessian of the energy density with respect to strain. An estimate of the error associated with the numerical differentiation performed is reported.
| Test | Test Results | Link to Test Results page | Benchmark time
Usertime multiplied by the Whetstone Benchmark. This number can be used (approximately) to compare the performance of different models independently of the architecture on which the test was run.
Measured in Millions of Whetstone Instructions (MWI) |
|---|---|---|---|
| Elastic constants for bcc Al at zero temperature v006 | view | 6334 | |
| Elastic constants for bcc Nb at zero temperature v006 | view | 3967 | |
| Elastic constants for bcc Ti at zero temperature v006 | view | 5694 | |
| Elastic constants for fcc Al at zero temperature v006 | view | 1663 | |
| Elastic constants for fcc Nb at zero temperature v006 | view | 1887 | |
| Elastic constants for fcc Ti at zero temperature v006 | view | 6206 | |
| Elastic constants for sc Al at zero temperature v006 | view | 1759 | |
| Elastic constants for sc Nb at zero temperature v006 | view | 2079 | |
| Elastic constants for sc Ti at zero temperature v006 | view | 1695 |
Creators: Junhao Li
Contributor: jl2922
Publication Year: 2019
DOI: https://doi.org/10.25950/d794c746
Computes the elastic constants for hcp crystals by calculating the hessian of the energy density with respect to strain. An estimate of the error associated with the numerical differentiation performed is reported.
| Test | Test Results | Link to Test Results page | Benchmark time
Usertime multiplied by the Whetstone Benchmark. This number can be used (approximately) to compare the performance of different models independently of the architecture on which the test was run.
Measured in Millions of Whetstone Instructions (MWI) |
|---|---|---|---|
| Elastic constants for hcp Al at zero temperature v004 | view | 1305 | |
| Elastic constants for hcp Nb at zero temperature v004 | view | 1655 | |
| Elastic constants for hcp Ti at zero temperature v004 | view | 1974 |
Creators:
Contributor: ilia
Publication Year: 2024
DOI: https://doi.org/10.25950/2f2c4ad3
Computes the equilibrium crystal structure and energy for an arbitrary crystal at zero temperature and applied stress by performing symmetry-constrained relaxation. The crystal structure is specified using the AFLOW prototype designation. Multiple sets of free parameters corresponding to the crystal prototype may be specified as initial guesses for structure optimization. No guarantee is made regarding the stability of computed equilibria, nor that any are the ground state.
Creators:
Contributor: ilia
Publication Year: 2025
DOI: https://doi.org/10.25950/866c7cfa
Computes the equilibrium crystal structure and energy for an arbitrary crystal at zero temperature and applied stress by performing symmetry-constrained relaxation. The crystal structure is specified using the AFLOW prototype designation. Multiple sets of free parameters corresponding to the crystal prototype may be specified as initial guesses for structure optimization. No guarantee is made regarding the stability of computed equilibria, nor that any are the ground state.
Creators:
Contributor: brunnels
Publication Year: 2022
DOI: https://doi.org/10.25950/2c59c9d6
Computes grain boundary energy for a range of tilt angles given a crystal structure, tilt axis, and material.
| Test | Test Results | Link to Test Results page | Benchmark time
Usertime multiplied by the Whetstone Benchmark. This number can be used (approximately) to compare the performance of different models independently of the architecture on which the test was run.
Measured in Millions of Whetstone Instructions (MWI) |
|---|---|---|---|
| Relaxed energy as a function of tilt angle for a 100 symmetric tilt grain boundary in fcc Al v003 | view | 11416041 | |
| Relaxed energy as a function of tilt angle for a 110 symmetric tilt grain boundary in fcc Al v001 | view | 22580692 | |
| Relaxed energy as a function of tilt angle for a 111 symmetric tilt grain boundary in fcc Al v001 | view | 13314651 | |
| Relaxed energy as a function of tilt angle for a 112 symmetric tilt grain boundary in fcc Al v001 | view | 77231274 |
Creators: Daniel S. Karls and Junhao Li
Contributor: karls
Publication Year: 2019
DOI: https://doi.org/10.25950/2765e3bf
Equilibrium lattice constant and cohesive energy of a cubic lattice at zero temperature and pressure.
Creators: Daniel S. Karls and Junhao Li
Contributor: karls
Publication Year: 2019
DOI: https://doi.org/10.25950/c339ca32
Calculates lattice constant of hexagonal bulk structures at zero temperature and pressure by using simplex minimization to minimize the potential energy.
| Test | Test Results | Link to Test Results page | Benchmark time
Usertime multiplied by the Whetstone Benchmark. This number can be used (approximately) to compare the performance of different models independently of the architecture on which the test was run.
Measured in Millions of Whetstone Instructions (MWI) |
|---|---|---|---|
| Equilibrium lattice constants for hcp Al v005 | view | 22253 | |
| Equilibrium lattice constants for hcp Nb v005 | view | 21967 | |
| Equilibrium lattice constants for hcp Ti v005 | view | 25915 |
Creators:
Contributor: mjwen
Publication Year: 2024
DOI: https://doi.org/10.25950/9d9822ec
This Test Driver uses LAMMPS to compute the linear thermal expansion coefficient at a finite temperature under a given pressure for a cubic lattice (fcc, bcc, sc, diamond) of a single given species.
| Test | Test Results | Link to Test Results page | Benchmark time
Usertime multiplied by the Whetstone Benchmark. This number can be used (approximately) to compare the performance of different models independently of the architecture on which the test was run.
Measured in Millions of Whetstone Instructions (MWI) |
|---|---|---|---|
| Linear thermal expansion coefficient of fcc Al at 293.15 K under a pressure of 0 MPa v002 | view | 795985 |
Creators: Matt Bierbaum
Contributor: mattbierbaum
Publication Year: 2019
DOI: https://doi.org/10.25950/64f4999b
Calculates the phonon dispersion relations for fcc lattices and records the results as curves.
| Test | Test Results | Link to Test Results page | Benchmark time
Usertime multiplied by the Whetstone Benchmark. This number can be used (approximately) to compare the performance of different models independently of the architecture on which the test was run.
Measured in Millions of Whetstone Instructions (MWI) |
|---|---|---|---|
| Phonon dispersion relations for fcc Al v004 | view | 49615 |
Creators:
Contributor: SubrahmanyamPattamatta
Publication Year: 2019
DOI: https://doi.org/10.25950/b4cfaf9a
Intrinsic and extrinsic stacking fault energies, unstable stacking fault energy, unstable twinning energy, stacking fault energy as a function of fractional displacement, and gamma surface for a monoatomic FCC lattice at zero temperature and pressure.
| Test | Test Results | Link to Test Results page | Benchmark time
Usertime multiplied by the Whetstone Benchmark. This number can be used (approximately) to compare the performance of different models independently of the architecture on which the test was run.
Measured in Millions of Whetstone Instructions (MWI) |
|---|---|---|---|
| Stacking and twinning fault energies for fcc Al v002 | view | 8085508 |
Creators: Matt Bierbaum
Contributor: mattbierbaum
Publication Year: 2019
DOI: https://doi.org/10.25950/6c43a4e6
Calculates the surface energy of several high symmetry surfaces and produces a broken-bond model fit. In latex form, the fit equations are given by:
E_{FCC} (\vec{n}) = p_1 (4 \left( |x+y| + |x-y| + |x+z| + |x-z| + |z+y| +|z-y|\right)) + p_2 (8 \left( |x| + |y| + |z|\right)) + p_3 (2 ( |x+ 2y + z| + |x+2y-z| + |x-2y + z| + |x-2y-z| + |2x+y+z| + |2x+y-z| +|2x-y+z| +|2x-y-z| +|x+y+2z| +|x+y-2z| +|x-y+2z| +|x-y-2z| ) + c
E_{BCC} (\vec{n}) = p_1 (6 \left( | x+y+z| + |x+y-z| + |-x+y-z| + |x-y+z| \right)) + p_2 (8 \left( |x| + |y| + |z|\right)) + p_3 (4 \left( |x+y| + |x-y| + |x+z| + |x-z| + |z+y| +|z-y|\right)) +c.
In Python, these two fits take the following form:
def BrokenBondFCC(params, index):
import numpy
x, y, z = index
x = x / numpy.sqrt(x**2.+y**2.+z**2.)
y = y / numpy.sqrt(x**2.+y**2.+z**2.)
z = z / numpy.sqrt(x**2.+y**2.+z**2.)
return params[0]*4* (abs(x+y) + abs(x-y) + abs(x+z) + abs(x-z) + abs(z+y) + abs(z-y)) + params[1]*8*(abs(x) + abs(y) + abs(z)) + params[2]*(abs(x+2*y+z) + abs(x+2*y-z) +abs(x-2*y+z) +abs(x-2*y-z) + abs(2*x+y+z) +abs(2*x+y-z) +abs(2*x-y+z) +abs(2*x-y-z) + abs(x+y+2*z) +abs(x+y-2*z) +abs(x-y+2*z) +abs(x-y-2*z))+params[3]
def BrokenBondBCC(params, x, y, z):
import numpy
x, y, z = index
x = x / numpy.sqrt(x**2.+y**2.+z**2.)
y = y / numpy.sqrt(x**2.+y**2.+z**2.)
z = z / numpy.sqrt(x**2.+y**2.+z**2.)
return params[0]*6*(abs(x+y+z) + abs(x-y-z) + abs(x-y+z) + abs(x+y-z)) + params[1]*8*(abs(x) + abs(y) + abs(z)) + params[2]*4* (abs(x+y) + abs(x-y) + abs(x+z) + abs(x-z) + abs(z+y) + abs(z-y)) + params[3]
| Test | Test Results | Link to Test Results page | Benchmark time
Usertime multiplied by the Whetstone Benchmark. This number can be used (approximately) to compare the performance of different models independently of the architecture on which the test was run.
Measured in Millions of Whetstone Instructions (MWI) |
|---|---|---|---|
| Broken-bond fit of high-symmetry surface energies in bcc Nb v004 | view | 18170 | |
| Broken-bond fit of high-symmetry surface energies in fcc Al v004 | view | 30773 |
Creators:
Contributor: efuem
Publication Year: 2023
DOI: https://doi.org/10.25950/fca89cea
Computes the monovacancy formation energy and relaxation volume for cubic and hcp monoatomic crystals.
| Test | Test Results | Link to Test Results page | Benchmark time
Usertime multiplied by the Whetstone Benchmark. This number can be used (approximately) to compare the performance of different models independently of the architecture on which the test was run.
Measured in Millions of Whetstone Instructions (MWI) |
|---|---|---|---|
| Monovacancy formation energy and relaxation volume for bcc Nb | view | 325992 | |
| Monovacancy formation energy and relaxation volume for fcc Al | view | 366704 | |
| Monovacancy formation energy and relaxation volume for hcp Ti | view | 351980 |
Creators:
Contributor: efuem
Publication Year: 2023
DOI: https://doi.org/10.25950/c27ba3cd
Computes the monovacancy formation and migration energies for cubic and hcp monoatomic crystals.
| Test | Test Results | Link to Test Results page | Benchmark time
Usertime multiplied by the Whetstone Benchmark. This number can be used (approximately) to compare the performance of different models independently of the architecture on which the test was run.
Measured in Millions of Whetstone Instructions (MWI) |
|---|---|---|---|
| Vacancy formation and migration energy for bcc Nb | view | 3654374 | |
| Vacancy formation and migration energy for fcc Al | view | 1841764 | |
| Vacancy formation and migration energy for hcp Ti | view | 1158860 |
| Test | Error Categories | Link to Error page |
|---|---|---|
| Elastic constants for diamond Al at zero temperature v001 | other | view |
| Elastic constants for diamond Nb at zero temperature v001 | other | view |
| Elastic constants for diamond Ti at zero temperature v001 | other | view |
LatticeConstantCubicEnergy__TD_475411767977_006
| Test | Error Categories | Link to Error page |
|---|---|---|
| Equilibrium zero-temperature lattice constant for diamond Al | other | view |
| Equilibrium zero-temperature lattice constant for diamond Nb | other | view |
LatticeConstantHexagonalEnergy__TD_942334626465_004
| Test | Error Categories | Link to Error page |
|---|---|---|
| Equilibrium lattice constants for hcp Nb | other | view |
No Driver
| Verification Check | Error Categories | Link to Error page |
|---|---|---|
| DimerContinuityC1__VC_303890932454_005 | other | view |
| EAM_Dynamo_FarkasJones_1996_NbTiAl__MO_042691367780_000.txz | Tar+XZ | Linux and OS X archive |
| EAM_Dynamo_FarkasJones_1996_NbTiAl__MO_042691367780_000.zip | Zip | Windows archive |
This Model requires a Model Driver. Archives for the Model Driver EAM_Dynamo__MD_120291908751_005 appear below.
| EAM_Dynamo__MD_120291908751_005.txz | Tar+XZ | Linux and OS X archive |
| EAM_Dynamo__MD_120291908751_005.zip | Zip | Windows archive |