Citations
This panel presents information regarding the papers that have cited the interatomic potential (IP) whose page you are on.
The OpenKIM machine learning based Deep Citation framework is used to determine whether the citing article actually used the IP in computations (denoted by "USED") or only provides it as a background citation (denoted by "NOT USED"). For more details on Deep Citation and how to work with this panel, click the documentation link at the top of the panel.
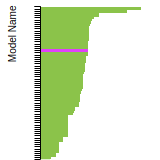
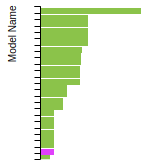
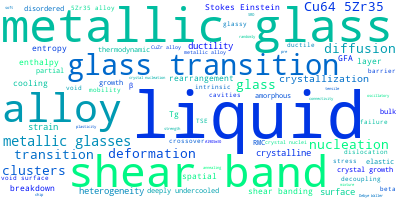
The word cloud to the right is generated from the abstracts of IP principle source(s) (given below in "How to Cite") and the citing articles that were determined to have used the IP in order to provide users with a quick sense of the types of physical phenomena to which this IP is applied.
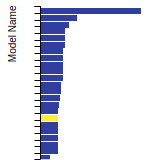
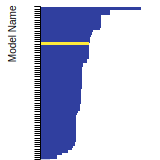
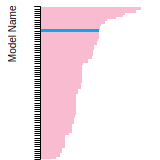
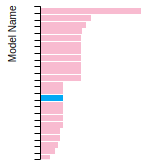
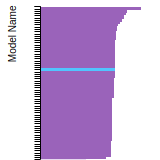
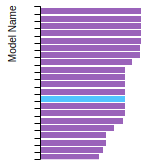
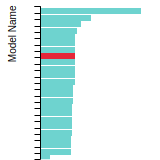
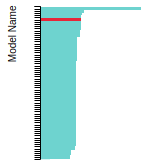
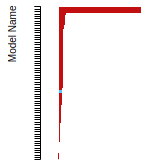
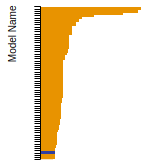
The bar chart shows the number of articles that cited the IP per year. Each bar is divided into green (articles that USED the IP) and blue (articles that did NOT USE the IP).
Users are encouraged to correct Deep Citation errors in determination by clicking the speech icon next to a citing article and providing updated information. This will be integrated into the next Deep Citation learning cycle, which occurs on a regular basis.
OpenKIM acknowledges the support of the Allen Institute for AI through the Semantic Scholar project for providing citation information and full text of articles when available, which are used to train the Deep Citation ML algorithm.
|
This panel provides information on past usage of this interatomic potential (IP) powered by the OpenKIM Deep Citation framework. The word cloud indicates typical applications of the potential. The bar chart shows citations per year of this IP (bars are divided into articles that used the IP (green) and those that did not (blue)). The complete list of articles that cited this IP is provided below along with the Deep Citation determination on usage. See the Deep Citation documentation for more information.
322 Citations (270 used)
Help us to determine which of the papers that cite this potential actually used it to perform calculations. If you know, click the .
USED (definite) V. Turlo and T. Rupert, “Discovery of a Wide Variety of Linear Complexions in Face Centered Cubic Alloys,” MatSciRN: Other Mechanical Properties & Deformation of Materials (Topic). 2019. link Times cited: 1 Abstract: Linear complexions are defect states that have been recently… read moreAbstract: Linear complexions are defect states that have been recently discovered along dislocations in body centered cubic Fe-based alloys. In this work, we use atomistic simulations to extend this concept and explore segregation-driven structural transitions at dislocations in face centered cubic alloys. We discovered a variety of stable, nanoscale-size structural and chemical states, which are confined near dislocations and can be classified as linear complexions. Depending on the alloy system and thermodynamic conditions, such new states can preserve, partially modify, or completely replace the original defects they were born at. By considering different temperatures and compositions, we construct linear complexion diagrams that are similar to bulk phase diagrams, defining the important conditions for complexion formation while also specifying an expected complexion size and type. Several notable new complexion types were discovered here: (1) nanoparticle arrays comprised of L12 phases in Ni-Fe, Ni-Al, and Al-Zr, (2) replacement of stacking faults with layered complexions comprised of (111) planes from the Cu5Zr intermetallic phase in Cu-Zr, (3) platelet arrays comprised of two-dimensional Guinier-Preston zones in Al-Cu, and finally (4) coexistence of multiple linear complexions containing both Guinier-Preston zones and L12 phases in ternary Al-Cu-Zr. All of these new complexion states are expected to alter material properties and affect the stability of the dislocations themselves, offering a unique opportunity for future materials design. read less USED (definite) R. Ryltsev and N. Chtchelkatchev, “Polytetrahedral short-range order and crystallization stability in supercooled Cu64.5Zr35.5 metallic liquid,” Journal of Crystal Growth. 2019. link Times cited: 1 USED (definite) D. Wei et al., “Assessing the utility of structure in amorphous materials.,” The Journal of chemical physics. 2018. link Times cited: 30 Abstract: This paper presents a set of general strategies for the anal… read moreAbstract: This paper presents a set of general strategies for the analysis of structure in amorphous materials and a general approach to assessing the utility of any selected structural description. Two measures of structure are defined, "diversity" and "utility," and applied to two model glass forming binary atomic alloys, Cu50Zr50 and a Lennard-Jones A80B20 mixture. We show that the change in diversity associated with selecting Voronoi structures with high localization or low energy, while real, is too weak to support claims that specific structures are the prime cause of these local physical properties. In addition, a new structure-free measure of incipient crystal-like organization in mixtures is introduced, suitable for cases where the stable crystal is a compound structure. read less USED (definite) B. Shang, P. Guan, and J. Barrat, “Role of thermal expansion heterogeneity in the cryogenic rejuvenation of metallic glasses,” Journal of Physics: Materials. 2018. link Times cited: 17 Abstract: Cryogenic rejuvenation in metallic glasses reported in Ketov… read moreAbstract: Cryogenic rejuvenation in metallic glasses reported in Ketov et al 's experiment (2015 Nature 524 200) has attracted much attention, both in experiments and numerical studies. The atomic mechanism of rejuvenation has been conjectured to be related to the heterogeneity of the glassy state, but the quantitative evidence is still elusive. Here we use molecular dynamics simulations of a model metallic glass to investigate the heterogeneity in the local thermal expansion. We then combine the resulting spatial distribution of thermal expansion with a continuum mechanics calculation to infer the internal stresses caused by a thermal cycle. Comparing the internal stress with the local yield stress, we prove that the heterogeneity in thermo mechanical response has the potential to trigger local shear transformations, and therefore to induce rejuvenation during a cryogenic thermal cycling. read less USED (definite) Y.-C. Hu, Y.-W. Li, Y. Yang, P. Guan, H. Bai, and W.-H. Wang, “Configuration correlation governs slow dynamics of supercooled metallic liquids,” Proceedings of the National Academy of Sciences. 2018. link Times cited: 39 Abstract: Significance The search for a structural origin governing th… read moreAbstract: Significance The search for a structural origin governing the dynamical slowing down of a supercooled liquid toward glass transition is an active area of the community of amorphous materials. In the past decade, the locally preferred geometrical orderings, that is, those local polyhedral packing clusters extracted from instantaneous atomic configurations, such as icosahedron, have been suggested as the structural origin of slow dynamics in metallic glass-forming liquids. Here, we demonstrate that it is the intrinsic correlation between configurations that captures the structural origin governing slow dynamics. A correlation length extracted from these configurations' correlation plays a more important role than various dynamic correlation lengths in determining the drastic dynamical slowdown of supercooled metallic liquids. The origin of dramatic slowing down of dynamics in metallic glass-forming liquids toward their glass transition temperatures is a fundamental but unresolved issue. Through extensive molecular dynamics simulations, here we show that, contrary to the previous beliefs, it is not local geometrical orderings extracted from instantaneous configurations but the intrinsic correlation between configurations that captures the structural origin governing slow dynamics. More significantly, it is demonstrated by scaling analyses that it is the correlation length extracted from configuration correlation rather than dynamic correlation lengths that is the key to determine the drastic slowdown of supercooled metallic liquids. The key role of the configuration correlation established here sheds important light on the structural origin of the mysterious glass transition and provides an essential piece of the puzzle for the development of a universal theoretical understanding of glass transition in glasses. read less USED (definite) T. Brink and K. Albe, “From metallic glasses to nanocrystals: Molecular dynamics simulations on the crossover from glass-like to grain-boundary-mediated deformation behaviour,” Acta Materialia. 2018. link Times cited: 34 USED (definite) T. Ingebrigtsen, J. Dyre, T. Schrøder, and C. Royall, “Crystallization Instability in Glass-Forming Mixtures,” Physical Review X. 2018. link Times cited: 40 Abstract: Computer simulations provide a framework for understanding w… read moreAbstract: Computer simulations provide a framework for understanding why mixtures readily crystallize, an important insight for the design of glass-forming materials. read less USED (definite) V. Turlo and T. Rupert, “Grain boundary complexions and the strength of nanocrystalline metals: Dislocation emission and propagation,” Acta Materialia. 2017. link Times cited: 73 USED (definite) H. Song, Y. Sun, F. Zhang, C. Wang, K. Ho, and M. Mendelev, “Nucleation of stoichiometric compounds from liquid: Role of the kinetic factor,” Physical Review Materials. 2017. link Times cited: 21 Abstract: While the role of the free energy barrier during nucleation … read moreAbstract: While the role of the free energy barrier during nucleation is a text-book subject the importance of the kinetic factor is frequently underestimated. We obtained both quantities from molecular dynamics (MD) simulations for the pure Ni and B2 phases in the Ni50Al50 and Cu50Zr50 alloys. The free-energy barrier was found to be higher in Ni but the nucleation rate is much lower in the Ni50Al50 alloy which was attributed to the ordered nature of the B2 phase. Since the Cu50Zr50 B2 phase can has even smaller fraction of the anti-site defects its nucleation is never observed in the MD simulation. read less USED (definite) Y. Hu, J. Schuler, and T. Rupert, “Identifying interatomic potentials for the accurate modeling of interfacial segregation and structural transitions,” Computational Materials Science. 2017. link Times cited: 16 USED (definite) C. Kalcher, T. Brink, J. Rohrer, A. Stukowski, and K. Albe, “Interface-controlled creep in metallic glass composites,” Acta Materialia. 2017. link Times cited: 18 USED (definite) S. Feng, S. Feng, K. Chan, S. H. Chen, L. Zhao, and R. P. Liu, “The role of configurational disorder on plastic and dynamic deformation in Cu64Zr36 metallic glasses: A molecular dynamics analysis,” Scientific Reports. 2017. link Times cited: 21 USED (definite) M. Sepulveda-Macias, N. Amigo, and G. Gutiérrez, “Onset of plasticity and its relation to atomic structure in CuZr metallic glass nanowire: A molecular dynamics study,” Journal of Alloys and Compounds. 2016. link Times cited: 17 USED (definite) K. Gunawardana and X. Song, “Free Energy Calculations of Crystalline Hard Sphere Complexes Using Density Functional Theory.,” The journal of physical chemistry. B. 2015. link Times cited: 6 Abstract: Recently developed fundamental measure density functional th… read moreAbstract: Recently developed fundamental measure density functional theory (FMT) is used to study binary hard sphere (HS) complexes in crystalline phases. By comparing the excess free energy, pressure, and phase diagram, we show that the fundamental measure functional yields good agreements to the available simulation results of AB, AB2, and AB13 crystals. Furthermore, we use this functional to study the HS models of five binary crystals, Cu5Zr(C15b), Cu51Zr14(β), Cu10Zr7(ϕ), CuZr(B2), and CuZr2(C11b), which are observed in the Cu-Zr system. The FMT functional gives a well-behaved minimum for most of the hard sphere crystal complexes in the two-dimensional Gaussian parameter space, namely a crystalline phase. However, the current version of FMT functional (White Bear) fails to give a stable minimum for the structure Cu10Zr7(ϕ). We argue that the observed solid phases for the HS models of the Cu-Zr system are true thermodynamic stable phases and can be used as a reference system in perturbation calculations. read less USED (definite) Z. W. Wu, F. Li, C. Huo, M. Li, W. Wang, and K. Liu, “Critical scaling of icosahedral medium-range order in CuZr metallic glass-forming liquids,” Scientific Reports. 2015. link Times cited: 32 USED (definite) D. Kang et al., “Interfacial Free Energy Controlling Glass-Forming Ability of Cu-Zr Alloys,” Scientific Reports. 2014. link Times cited: 34 USED (definite) “Distinct signature of two local structural motifs of liquid water in the scattering function,” arXiv: Soft Condensed Matter. 2019. link Times cited: 0 Abstract: Liquids generally become more ordered upon cooling. However,… read moreAbstract: Liquids generally become more ordered upon cooling. However, it has been a long-standing debate on whether such structural ordering in liquid water takes place continuously or discontinuosly: continuum vs. mixture models. Here, by computer simulations of three popular water models and analysis of recent scattering experiment data, we show that, in the structure factor of water, there are two overlapped peaks hidden in the apparent "first diffraction peak", one of which corresponds to the neighboring O-O distance as in ordinary liquids and the other to the longest periodicity of density waves in a tetrahedral structure. This unambiguously proves the coexistence of two local structural motifs. Our findings not only provide key clues to settle long-standing controversy on the water structure but also allow experimental access to the degree and range of structural ordering in liquid water. read less USED (high confidence) A. Annamareddy, B. Wang, P. Voyles, and D. Morgan, “Distribution of atomic rearrangement vectors in a metallic glass,” Journal of Applied Physics. 2022. link Times cited: 0 Abstract: Short-timescale atomic rearrangements are fundamental to the… read moreAbstract: Short-timescale atomic rearrangements are fundamental to the kinetics of glasses and frequently dominated by one atom moving significantly (a rearrangement), while others relax only modestly. The rates and directions of such rearrangements (or hops) are dominated by the distributions of activation barriers ( Eact) for rearrangement for a single atom and how those distributions vary across the atoms in the system. We have used molecular dynamics simulations of Cu50Zr50 metallic glass below Tg in an isoconfigurational ensemble to catalog the ensemble of rearrangements from thousands of sites. The majority of atoms are strongly caged by their neighbors, but a tiny fraction has a very high propensity for rearrangement, which leads to a power-law variation in the cage-breaking probability for the atoms in the model. In addition, atoms generally have multiple accessible rearrangement vectors, each with its own Eact. However, atoms with lower Eact (or higher rearrangement rates) generally explored fewer possible rearrangement vectors, as the low Eact path is explored far more than others. We discuss how our results influence future modeling efforts to predict the rearrangement vector of a hopping atom. read less USED (high confidence) D. Singh, V. Turlo, D. Gianola, and T. Rupert, “Linear complexions directly modify dislocation motion in face-centered cubic alloys,” Materials Science and Engineering: A. 2022. link Times cited: 1 USED (high confidence) B. Shang, N. Jakse, P. Guan, W. Wang, and J. Barrat, “Influence of Oscillatory Shear on Nucleation in Metallic Glasses: A Molecular Dynamics Study,” SSRN Electronic Journal. 2022. link Times cited: 2 Abstract: The process of crystal nucleation can be accelerated or reta… read moreAbstract: The process of crystal nucleation can be accelerated or retarded by ultrasonic vibration, which is particularly attractive for the addictive manufacture and thermoplastic forming of metallic glasses, however, the effect and mechanism of oscillatory loading on the nucleation process are still elusive. By using molecular dynamics simulation, the changes in the time-temperature-transformation (TTT) curve under oscillatory external loading are systematically investigated in two typical binary alloys. A glass forming ability dependent response to the external loading is found, and the shortest incubation time is insensitive to the external loading, while the corresponding temperature can be significantly shifted. Within the framework of classical nucleation theory, a fitting formula is proposed to describe the simulation data quantitatively. In contrast to stationary shear, the elastic stress, rather than the strain rate, is the key parameter to control the evolution of TTT curve under oscillatory loading. Furthermore, the model shows that oscillatory loading can decouple the mobility and nucleation in the deeply supercooled liquid, hence the formation ability can be enhanced while the nucleation is suppressed, which is particularly helpful for the forming and manufacturing of metallic glasses. read less USED (high confidence) Y.-C. Hu and H. Tanaka, “Revealing the role of liquid preordering in crystallisation of supercooled liquids,” Nature Communications. 2022. link Times cited: 19 USED (high confidence) Q. Zhou et al., “Design and characterization of metallic glass/graphene multilayer with excellent nanowear properties,” Friction. 2022. link Times cited: 52 USED (high confidence) X. Liu et al., “Machine learning atomic dynamics to unfold the origin of plasticity in metallic glasses: From thermo- to acousto-plastic flow,” Science China Materials. 2022. link Times cited: 2 USED (high confidence) B. Shang, W. Wang, and P. Guan, “Cycle Deformation Enabled Controllable Mechanical Polarity of Bulk Metallic Glasses,” Materials Engineering eJournal. 2021. link Times cited: 3 USED (high confidence) Y. Wu et al., “Substantially enhanced plasticity of bulk metallic glasses by densifying local atomic packing,” Nature Communications. 2021. link Times cited: 43 USED (high confidence) X. Wang, H. Zhang, and J. Douglas, “The initiation of shear band formation in deformed metallic glasses from soft localized domains.,” The Journal of chemical physics. 2021. link Times cited: 11 Abstract: It has long been thought that shear band (SB) formation in a… read moreAbstract: It has long been thought that shear band (SB) formation in amorphous solids initiates from relatively "soft" regions in the material in which large-scale non-affine deformations become localized. The test of this hypothesis requires an effective means of identifying "soft" regions and their evolution as the material is deformed to varying degrees, where the metric of "softness" must also account for the effect of temperature on local material stiffness. We show that the mean square atomic displacement on a caging timescale ⟨u2⟩, the "Debye-Waller factor," provides a useful method for estimating the shear modulus of the entire material and, by extension, the material stiffness at an atomic scale. Based on this "softness" metrology, we observe that SB formation indeed occurs through the strain-induced formation of localized soft regions in our deformed metallic glass free-standing films. Unexpectedly, the critical strain condition for SB formation occurs when the softness (⟨u2⟩) distribution within the emerging soft regions approaches that of the interfacial region in its undeformed state, initiating an instability with similarities to the transition to turbulence. Correspondingly, no SBs arise when the material is so thin that the entire material can be approximately described as being "interfacial" in nature. We also quantify relaxation in the glass and the nature and origin of highly non-Gaussian particle displacements in the dynamically heterogeneous SB regions at times longer than the caging time. read less USED (high confidence) S. Menon, Y. Lysogorskiy, J. Rogal, and R. Drautz, “Automated free-energy calculation from atomistic simulations,” Physical Review Materials. 2021. link Times cited: 5 Abstract: We devise automated workflows for the calculation of Helmhol… read moreAbstract: We devise automated workflows for the calculation of Helmholtz and Gibbs free energies and their temperature and pressure dependence and provide the corresponding computational tools. We employ non-equilibrium thermodynamics for evaluating the free energy of solid and liquid phases at a given temperature and reversible scaling for computing free energies over a wide range of temperatures, including the direct integration of PT coexistence lines. By changing the chemistry and the interatomic potential, alchemical and upscaling free energy calculations are possible. Several examples illustrate the accuracy and efficiency of our implementation. read less USED (high confidence) K. V. Reddy and S. Pal, “Recreating the shear band evolution in nanoscale metallic glass by mimicking the atomistic rolling deformation: a molecular dynamics study,” Journal of Molecular Modeling. 2021. link Times cited: 5 USED (high confidence) H. Peng, H. Liu, and T. Voigtmann, “Nonmonotonic Dynamical Correlations beneath the Surface of Glass-Forming Liquids.,” Physical review letters. 2021. link Times cited: 3 Abstract: Collective motion over increasing length scales is a signatu… read moreAbstract: Collective motion over increasing length scales is a signature of the vitrification process of liquids. We demonstrate how distinct static and dynamic length scales govern the dynamics of vitrifying films. In contrast to a monotonically growing static correlation length, the dynamical correlation length that measures the extent of surface-dynamics acceleration into the bulk displays a striking nonmonotonic temperature evolution that is robust also against changes in detailed interatomic interaction. This nonmonotonic change defines a crossover temperature T_{*} that is distinct from the critical temperature T_{c} of mode-coupling theory. We connect this nonmonotonic change to a morphological change of cooperative rearrangement regions of fast particles, and to the point where the decoupling of fast-particle motion from the bulk relaxation is most sensitive to fluctuations. We propose a rigorous definition of this new crossover temperature T_{*} within a recent extension of mode-coupling theory, the stochastic β-relaxation theory. read less USED (high confidence) A. Abdelmawla, T. Phan, L. Xiong, and A. Bastawros, “A combined experimental and computational analysis on how material interface mediates plastic flow in amorphous/crystalline composites,” Journal of Materials Research. 2021. link Times cited: 3 Abstract: In this work, we study the deformation behavior in amorphous… read moreAbstract: In this work, we study the deformation behavior in amorphous/crystalline metallic composites (A/C-MCs) through nanoindentation experiments and molecular dynamic (MD) simulations. The atomic deformation processes in both crystalline (C-) and amorphous (A-) phases near the amorphous-crystalline interface (ACI) are investigated and correlated with the material’s overall constitutive behavior at the microscale. Our major findings are (i) the ACIs enable a co-deformation of the A- and C-phases through “stiffening” the soft phases but “softening” the stiff phases in A/C-MCs through different micro-mechanisms; (ii) there exists an ACI-induced transition zone with a thickness of ~ 10 nm; (iii) the strong coupling between shear transformation zones (STZs) and dislocations can be quantified through carefully designed indentation experiments and simulations; and (iv) the nanoscale MD-simulation-predicted mechanisms can be mapped to the “pop-in” or “excursion” events on the force–indentation depth curves extracted from microscale experiments, although there is a length-scale gap in between. read less USED (high confidence) A. Annamareddy, P. Voyles, J. Perepezko, and D. Morgan, “Mechanisms of bulk and surface diffusion in metallic glasses determined from molecular dynamics simulations,” Acta Materialia. 2021. link Times cited: 13 USED (high confidence) O. Adjaoud and K. Albe, “Nanoindentation of Nanoglasses Tested by Molecular Dynamics Simulations: Influence of Structural Relaxation and Chemical Segregation on the Mechanical Response,” Frontiers in Materials. 2021. link Times cited: 4 Abstract: We present molecular dynamics simulations of nanoindentation… read moreAbstract: We present molecular dynamics simulations of nanoindentation in order to investigate the effects of segregation and structural relaxation on the mechanical properties of Cu64Zr36 nanoglasses prepared by particle consolidation and long-time annealing. Our analysis of load-displacement curves shows that the effective elastic modulus of nanoglasses is lower than that of their homogeneous metallic glass counterpart. This is mainly because of the defective short-range order present in the glass-glass interface, but to a lesser extend due to chemical inhomogeneities. Structural relaxation obtained by long-time annealing (500 ns) at 0.8 Tg leads to a shift from a homogeneous deformation to a mix of homogeneous deformation and shear bands. The obtained hardness values of annealed nanoglass are comparable to those of homogenous glass samples, but significantly higher as compared to juvenile as-prepared nanoglass samples. The results are discussed in the context of recent nanonindentation experiments. read less USED (high confidence) L. Tang et al., “The energy landscape governs ductility in disordered materials.,” Materials horizons. 2021. link Times cited: 9 Abstract: Based on their structure, non-crystalline phases can fail in… read moreAbstract: Based on their structure, non-crystalline phases can fail in a brittle or ductile fashion. However, the nature of the link between structure and propensity for ductility in disordered materials has remained elusive. Here, based on molecular dynamics simulations of colloidal gels and silica glasses, we investigate how the degree of structural disorder affects the fracture of disordered materials. As expected, we observe that structural disorder results in an increase in ductility. By applying the activation-relaxation technique (an open-ended saddle point search algorithm), we demonstrate that the propensity for ductility is controlled by the topography of the energy landscape. Interestingly, we observe a power-law relationship between the particle non-affine displacement upon fracture and the average local energy barrier. This reveals that the dynamics of the particles upon fracture is encoded in the static energy landscape, i.e., before any load is applied. This relationship is shown to apply to several classes of non-crystalline materials (oxide and metallic glasses, amorphous solid, and colloidal gels), which suggests that it may be a generic feature of disordered materials. read less USED (high confidence) Y.-C. Hu and H. Tanaka, “Physical origin of glass formation from multicomponent systems,” Science Advances. 2020. link Times cited: 31 Abstract: We show that locally favored structural and chemical orders … read moreAbstract: We show that locally favored structural and chemical orders in melt control the glass-forming ability of metallic alloys. The origin of glass formation is one of the most fundamental issues in glass science. The glass-forming ability (GFA) of multicomponent systems, such as metallic glasses and phase-change materials, can be enormously changed by slight modifications of the constituted elements and compositions. However, its physical origin remains mostly unknown. Here, by molecular dynamics simulations, we study three model metallic systems with distinct GFA. We find that they have a similar driving force of crystallization, but a different liquid-crystal interface tension, indicating that the latter dominates the GFA. Furthermore, we show that the interface tension is determined by nontrivial coupling between structural and compositional orderings and affects crystal growth. These facts indicate that the classical theories of crystallization need critical modifications by considering local ordering effects. Our findings provide fresh insight into the physical control of GFA of metallic alloys and the switching speed of phase-change materials without relying on experience. read less USED (high confidence) Y. Wu, W. Wang, P. Guan, and H. Bai, “Identifying packing features of atoms with distinct dynamic behaviors in metallic glass by machine-learning method,” Science China Materials. 2020. link Times cited: 6 USED (high confidence) O. Adjaoud and K. Albe, “Mechanical Properties of Glassy Nanopillars: A Comparative, Computational Study of Size Effects in Nanoglasses and Homogeneous Bulk Glasses,” Frontiers in Materials. 2020. link Times cited: 1 Abstract: We study the mechanical properties of nanoglass (NG) nanopil… read moreAbstract: We study the mechanical properties of nanoglass (NG) nanopillars with diameters ranging from 4.5 to 54 nm by means of molecular dynamic simulations and compare the results with those obtained for nanopillars prepared from homogeneous glasses. NG nanopillars of two different types of glasses, namely, Cu64Zr36 and Pd80Si20, were cut from samples prepared by nanoparticle consolidation. The influence of nanopillar diameter on the deformation behavior and strain localization is investigated. Moreover, cyclic loading is used to explore the origin of stress overshoots in the stress–strain curves of NGs. Finally, from the calculated properties, a deformation map for NG and homogeneous glass nanopillars is derived. read less USED (high confidence) Y.-B. Yang, Q. Yang, D. Wei, L. Dai, H.-B. Yu, and Y. Wang, “Unraveling strongly entropic effect on
β
-relaxation in metallic glass: Insights from enhanced atomistic samplings over experimentally relevant timescales,” Physical Review B. 2020. link Times cited: 6 Abstract: The Johari-Goldstein secondary $(\ensuremath{\beta})$ relaxa… read moreAbstract: The Johari-Goldstein secondary $(\ensuremath{\beta})$ relaxation is an intrinsic feature of glasses, which is crucial to many properties of disordered materials. One puzzling feature of $\ensuremath{\beta}$-relaxation is its wide relaxation peak, which could imply a critical role of entropy. Here we quantify the activation entropy related to the $\ensuremath{\beta}$-relaxation in metallic glass via well-tempered metadynamics simulations. The activation free energy of the $\ensuremath{\beta}$-relaxation drastically decreases with increasing temperature, indicating a strongly entropic effect that may contribute a multiplication prefactor up to several orders of magnitude to the frequency. We further argue the entropic effect by linear extrapolation of the temperature-dependent activation free energy to 0 K, which gives rise to activation energy, in agreement with the barrier spectrum explored by the activation-relaxation technique. The entropic effect signifies the multiplicity of activation pathways which agrees with the experimentally found wide frequency domain of the $\ensuremath{\beta}$-relaxation. read less USED (high confidence) J. Yang, J. Duan, Y. Wang, and M. Jiang, “Complexity of plastic instability in amorphous solids: Insights from spatiotemporal evolution of vibrational modes,” The European Physical Journal E. 2020. link Times cited: 7 USED (high confidence) C. Kalcher, O. Adjaoud, and K. Albe, “Creep Deformation of a Cu-Zr Nanoglass and Interface Reinforced Nanoglass-Composite Studied by Molecular Dynamics Simulations,” Frontiers in Materials. 2020. link Times cited: 3 Abstract: Using molecular dynamics simulations, we compare the creep p… read moreAbstract: Using molecular dynamics simulations, we compare the creep properties of a homogeneous Cu64Zr36 metallic glass, a nanoglass with the same nominal composition, and a nanoglass-crystal composite, where the amorphous grain boundary phase has been reinforced with the high-temperature stable Cu2Zr Laves phase. While the nanoglass architecture is successful at preventing shear band formation, which typically results in a brittle failure mode at room temperature and conventional loading conditions, we find that the high fraction of glass-glass grain boundary phase therein is not beneficial to its creep properties. This can be amended by reinforcing the glass-glass interphase with a high-temperature stable crystalline substitute. read less USED (high confidence) K. V. Reddy and S. Pal, “Accumulative roll bonding of Cu–Zr nanolaminate: Atomistic-scale investigation of structural evolution and grain orientation scatter dependence on rolling parameters,” Journal of Applied Physics. 2020. link Times cited: 8 Abstract: Understanding the role of processing parameters on the atomi… read moreAbstract: Understanding the role of processing parameters on the atomic-level deformation mechanism and structural evolution during an accumulative roll bonding process is a necessity in scaling-up the production of metallic nanolaminates. In this study, we have developed a novel atomistic model of “nano-rolling” to investigate the effect of roller speed and temperature on the deformation behavior of Cu–Zr nanolaminate. The model takes both the compressive and the shear forces into consideration during the rolling process, making it efficient in reproducing the actual deformation mechanisms. Results from the mobility analysis have shown that the final velocity of the rolled specimen obtained from the simulation is close to the theoretical value. The phenomenon of texture evolution is also analyzed through orientation scatter analysis, where it is revealed that increasing the roller speed facilitates the formation of low angle grain boundaries and twins at lower temperatures. However, texture weakening of the rolled specimen has been observed at elevated temperatures due to the increase in fine grained equiaxed structures. Concurrently, the roller speed and temperature dependent deformation mechanism of the Zr-layer is also captured through atomic displacement analysis, which shows the formation of a smooth and wavy Zr-layer. Through Voronoi analysis, it is revealed that the wavy profile of the Zr-layer has a direct influence on the formation of metallic glass at the Cu–Zr interface as a higher number of icosahedral clusters are observed in specimens with a wavy Zr-layer. read less USED (high confidence) K. E. Avila, S. Küchemann, I. A. Alhafez, and H. Urbassek, “An atomistic study of shear-band formation during cutting of metallic glasses,” Journal of Applied Physics. 2020. link Times cited: 17 Abstract: Using molecular dynamics simulations, we study the generatio… read moreAbstract: Using molecular dynamics simulations, we study the generation of plasticity during cutting of a CuZr metallic glass. We characterize the deformation occurring at different cutting depths and velocities. A regular pattern of parallel shear bands forms in the chip in agreement with experimental work. The shear bands are better defined and further spaced apart for deeper cuts. For small cutting velocities ≤ 20 m / s, a sharp boundary plane separates the plastically deformed material in the chip from the virgin workpiece. This is the case even for the deepest cuts performed. The chip is of roughly prismatic shape; its thickness is determined by how fast the shear bands formed within the chip propagate. We find that at the core of a shear band, the number of full icosahedral clusters decreases by more than 50%. At higher cut velocities, we find bent shear bands and irregular shear-band patterns when shear bands merge. read less USED (high confidence) C. Wu and R.-E. Li, “Effects of alloy composition, cavity aspect ratio, and temperature of imprinted ZrCu metallic glass films: a molecular dynamics study,” Applied Physics A. 2020. link Times cited: 7 USED (high confidence) C. Wu and R.-E. Li, “Effects of alloy composition, cavity aspect ratio, and temperature of imprinted ZrCu metallic glass films: a molecular dynamics study,” Applied Physics A. 2020. link Times cited: 0 USED (high confidence) Q. Bi, C. Guo, and Y. Lü, “Crystallization of highly supercooled glass-forming alloys induced by anomalous surface wetting.,” Physical chemistry chemical physics : PCCP. 2020. link Times cited: 1 Abstract: Crystallization in highly supercooled Cu50Zr50 films close t… read moreAbstract: Crystallization in highly supercooled Cu50Zr50 films close to the glass transition is studied by using molecular dynamics simulations. Spontaneous nucleation is observed at the simulation timescale in contrast to the bulk counterpart. We find that nucleation occurs at free surfaces owing to the partial wetting of the nucleus by melt. The anomalous wetting phenomenon is closely related to strong density layering arising from the surface: the high density associated with surface layering increases surface energy of supercooled melts, resulting in that one facet of the crystalline embryo is preferentially formed on the film surface. The surface-based embryo is then developed into a stable nucleus by bridging two surfaces of thin films. The kinetics and thermodynamics analyses based on the mean first-passage time method show that the nucleation process still follows the description of the classical nucleation theory despite extremely high supercoolings. In nucleating, the slow interface dynamics becomes dominant and induces a low nucleation rate although the nucleation barrier is very low. The subsequent crystal growth is found to proceed in a quasi-two-dimensional manner with a ramified interface morphology, which is analogous to percolative crystals predicted in glass-forming liquids. read less USED (high confidence) D. Han, D. Wei, P. Cao, Y. Wang, and L. Dai, “Statistical complexity of potential energy landscape as a dynamic signature of the glass transition,” Physical Review B. 2020. link Times cited: 8 Abstract: Dynamic heterogeneity is an intrinsic characteristic of amor… read moreAbstract: Dynamic heterogeneity is an intrinsic characteristic of amorphous materials that is closely related to the mysterious glass transition. However, there is seldom an intuitive physical parameter characterizing the degree of dynamic heterogeneity and linking it quantitatively to the dynamic arrest phenomenon at the glass transition. Here, we propose a general theoretical protocol to explain the glass transition via a statistical parameter quantifying the dynamic heterogeneity of glass-forming systems. The parameter can be calculated using the concept of the Shannon information entropy associated with the variation in the activation barriers to local structural excitations on the underlying potential energy landscape, which can be explored extensively using the recently developed activation-relaxation technique in inherent structures spanning a wide range of configurational space. The concept is demonstrated successfully in a model of a prototypical glass-forming system ${\mathrm{Cu}}_{50}{\mathrm{Zr}}_{50}$. The Shannon entropy and statistical variation in the activation barriers are found to change dramatically at the glass-to-liquid transition and, therefore, can be treated as a novel signature of the glass transition, beyond the conventional thermodynamic indicators, such as the volume, potential energy, enthalpy, and heat capacity. The temperature-dependent Shannon entropy coincides with the evolution of the experimentally available stretching exponent during the glass-to-liquid transition and provides an intuitive explanation for the obscure decrease in dynamic heterogeneity from a metastable glass to an equilibrium liquid. Finally, possible relationships among structures, thermodynamics, and dynamics are discussed in terms of quantitative correlations among the structural Shannon entropy, excess total entropy, and dynamic Shannon entropy, respectively. read less USED (high confidence) Q. Cao, P.-P. Wang, and D.-hui Huang, “Revisiting the Stokes-Einstein relation for glass-forming melts.,” Physical chemistry chemical physics : PCCP. 2020. link Times cited: 6 Abstract: Molecular dynamics simulations of Ni36Zr64, Cu65Zr35 and Ni8… read moreAbstract: Molecular dynamics simulations of Ni36Zr64, Cu65Zr35 and Ni80Al20 were carried out over a broad range of temperature (900-3000 K) to investigate the Stokes-Einstein (SE) relation for glass-forming melts. Our results reproduce experimental structural and transport properties. Results show that the breakdown temperature of the SE relation (TSE) equals the dynamical crossover temperature (TA) and both are roughly twice the glass-transition temperature (Tg) for the three glass-forming melts (TSE = TA ≈ 2.0Tg). The product of the individual component self-diffusion coefficient and viscosity Dαη can be roughly regarded as a constant at the transition zone (a small temperature range around TSE) in which the temperature behaviors of self-diffusion coefficient and viscosity switch from high-temperature Arrhenius to a low-temperature VFT behavior. Below TSE, the decoupling of component diffusion coefficients was found. In particular, the decoupling of component diffusion coefficients can be ascribed to the decoupling of the partial pair structural correlation of components, which can be clearly reflected by the intersection of the high-temperature and low-temperature behaviors of the ratio between the partial pair correlation entropy of components (Sβ2/Sα2). Furthermore, the ratio between the partial pair correlation entropy of components may be used to predict the validity of the SE relation, in the absence of both transport coefficients and atomic coordinates. read less USED (high confidence) M.-H. Yang et al., “Microstructure evolution during near-
Tg
annealing and its effect on shear banding in model alloys,” Physical Review Materials. 2019. link Times cited: 0 Abstract: By performing extensive molecular dynamics simulations, we i… read moreAbstract: By performing extensive molecular dynamics simulations, we investigate the deformation behavior in Al90Sm10 and Cu64.5Zr35.5 alloys after elongated isothermal annealing in the vicinity of the glasstransition temperature (Tg). Different microstructural response to the annealing process was observed: Al90Sm10 maintains the glassy structure with improved energetic stability, enhanced short-range order (SRO), and a more pronounced spatial network that extends beyond the first atomic shell, while Cu64.5Zr35.5 forms nanocrystalline Laves Cu2Zr phases. Shear banding occurs in both annealed systems under shear loading. For Al90Sm10, the spatial network formed by the local clusters characterizing the SRO of the system is significantly weakened but remains appreciable in the shear band. In contrast, the crystalline ordering in the Cu64.5Zr35.5 is completely destroyed during shear banding. Consequently, while displaying higher yield strength, the annealed Cu64.5Zr35.5 sample appears to be less ductile. By carefully examining the effect of microstructures on the structural ordering in the shear band and the consequent mechanical response, our work contributes to a better understanding of the deformation mechanism of amorphous alloys as compared with that in crystalline materials. Disciplines Engineering Physics | Materials Science and Engineering Authors Meng-Hao Yang, Bei Cai, Yang Sun, Feng Zhang, Yi-Fan Wang, Cai-Zhuang Wang, and Kai-Ming Ho This article is available at Iowa State University Digital Repository: https://lib.dr.iastate.edu/ameslab_manuscripts/ 558 PHYSICAL REVIEW MATERIALS 3, 125602 (2019) Microstructure evolution during near-Tg annealing and its effect on shear banding in model alloys Meng-Hao Yang ,1,2 Bei Cai,3 Yang Sun ,1,2 Feng Zhang,1,2,* Yi-Fan Wang,4 Cai-Zhuang Wang,1,2 and Kai-Ming Ho1,2 1Ames Laboratory, United States Department of Energy, Ames, Iowa 50011, USA 2Department of Physics, Iowa State University, Ames, Iowa 50011, USA 3Key Laboratory of Advanced Materials (MOE), School of Materials Science and Engineering, Tsinghua University, Beijing 100084, China 4Systems Engineering Research Institute of China State Shipbuilding Corporation Limited (Received 21 August 2019; published 9 December 2019) By performing extensive molecular dynamics simulations, we investigate the deformation behavior in Al90Sm10 and Cu64.5Zr35.5 alloys after elongated isothermal annealing in the vicinity of the glass-transition temperature (Tg). Different microstructural response to the annealing process was observed: Al90Sm10 maintains the glassy structure with improved energetic stability, enhanced short-range order (SRO), and a more pronounced spatial network that extends beyond the first atomic shell, while Cu64.5Zr35.5 forms nanocrystalline Laves Cu2Zr phases. Shear banding occurs in both annealed systems under shear loading. For Al90Sm10, the spatial network formed by the local clusters characterizing the SRO of the system is significantly weakened but remains appreciable in the shear band. In contrast, the crystalline ordering in the Cu64.5Zr35.5 is completely destroyed during shear banding. Consequently, while displaying higher yield strength, the annealed Cu64.5Zr35.5 sample appears to be less ductile. By carefully examining the effect of microstructures on the structural ordering in the shear band and the consequent mechanical response, our work contributes to a better understanding of the deformation mechanism of amorphous alloys as compared with that in crystalline materials. DOI: 10.1103/PhysRevMaterials.3.125602 read less USED (high confidence) M. Mendelev et al., “Development of a semi-empirical potential suitable for molecular dynamics simulation of vitrification in Cu-Zr alloys.,” The Journal of chemical physics. 2019. link Times cited: 50 Abstract: The fast increase in available computation power allowed us … read moreAbstract: The fast increase in available computation power allowed us to decrease the cooling rate in molecular dynamics (MD) simulation of vitrification by several orders of magnitude. While the reliability of the MD simulation should obviously benefit from this increase in the computational power, in some cases, it led to unexpected results. In particular, Ryltsev et al. [J. Chem. Phys. 149, 164502 (2018)] found that the most popular potentials for the Cu-Zr and Cu-Zr-Al alloys from Mendelev et al. [Philos. Mag. 89, 967 (2009)] and Cheng et al. [Phys. Rev. Lett. 102, 245501 (2009)] do not actually describe good glass forming systems but in contradiction with experiment predict rather fast crystallization of the Cu64.5Zr35.5 alloy which is the well-known example of bulk metallic glasses. In this paper, we present a new Cu-Zr semiempirical potential suitable to simulate vitrification. No crystal nucleation was observed in MD simulation using this potential in the concentration range from 75% to 5% of Zr. Since the new potential leads to about the same liquid structure and viscosity as the Cu-Zr potential from Mendelev et al. [Philos. Mag. 89, 967 (2009)] which failed to describe the good glass formability, our study clearly shows that no reliable conclusions about the glass formability can be deduced based solely on the analysis of the liquid properties and a nucleation/crystal growth study should be performed to address this question. read less USED (high confidence) C. Massa, D. Leporini, and F. Puosi, “Metallic glass-formers in 2D exhibit the same scaling as in 3D between vibrational dynamics and structural relaxation,” Journal of Physics: Condensed Matter. 2019. link Times cited: 0 Abstract: Glass-forming systems approaching their glass transition exh… read moreAbstract: Glass-forming systems approaching their glass transition exhibit universal correlations between picosecond vibrational dynamics and long-time structural relaxation, which can be described by the same master curve in the bulk or confined conditions. In this work, we study at a fundamental level the effects of the reduction of spatial dimensionality on this phenomenon. We perform molecular dynamics simulations of a metallic glass-formers in two dimensions (2D). We show that in the supercooled regime particle localization in the cage and structural relaxation are blurred by long-wavelength fluctuations specific to low-dimensional systems. Once these effects are properly removed, we demonstrate that the fast dynamics and slow relaxation comply, without any adjustment, with same scaling between the structural relaxation time and the Debye–Waller factor, originally observed in three-dimensions (3D). read less USED (high confidence) Y. Duan et al., “Crystallization behavior of a confined CuZr metallic liquid film with a sandwich-like structure.,” Physical chemistry chemical physics : PCCP. 2019. link Times cited: 6 Abstract: Despite the fact that its crystal state is thermodynamically… read moreAbstract: Despite the fact that its crystal state is thermodynamically stable, Cu64Zr36 alloy is prone to form metastable glass at a high cooling rate. However, the confinement can induce nano-crystallization with a novel sandwich-like hierarchical structure consisting of pure Cu layers, pure Zr layers and mixed layers by conducting molecular dynamics simulations. The liquid-to-crystal transition temperature and interatomic repulsion softness display abnormal oscillations, instead of monotonous variation, as the wall-wall separation increases. When the confinement size is 10 Å and 12 Å, the transition temperature reaches a maximum, resulting from the pending new sandwich layer. The atomic movement and dynamical heterogeneity are demonstrated to play a vital role in the abnormal oscillation behavior of physical properties of the nano confined metallic glass. The sandwich-like structure can alter the Cu-Zr bond fraction, which eventually influences the liquid-to-crystal transition temperature and interatomic repulsion softness. Our findings provide a deep insight into the hierarchical nanostructures and its liquid-to-crystal transition characteristics under confinement at the atomic level. read less USED (high confidence) M. Kumar, E. Nicholson, D. Kirk, S. Thorpe, and C. V. Singh, “Short-range structural origins of serration events in metallic glasses,” Journal of Alloys and Compounds. 2019. link Times cited: 5 USED (high confidence) N. Amigo, “Martensitic transformation induced by void defects in the B2-CuZr crystal structure: an atomistic analysis,” Molecular Simulation. 2019. link Times cited: 10 Abstract: ABSTRACT Molecular dynamics simulations were carried out to … read moreAbstract: ABSTRACT Molecular dynamics simulations were carried out to perform tensile tests on B2-CuZr nanofilms at 1 K with a single spherical void defect. Six different samples were considered: a void-free one and five others with a single void with the radius ranging from 3 to 15 Å. In the void-free sample, martensitic transformation was promoted from the top and bottom surfaces, whereas in the other samples, the transformation initiated from the void surface. Moreover, the yield stress decreased as the void size increased. An atomic-level analysis revealed that, prior to the martensitic transformation, the Cu atoms at the void surface were subjected to 34% higher average von Mises stress than the Cu atoms at the top and bottom surfaces. This remarkable difference led to the rearrangement of Cu atoms at the void surface, promoting transformation bands that decreased the overall stress in the system. The reduction in yield stress with the void radius was observed at 300 K, but exhibiting limited phase transformation, failing at lower strains. read less USED (high confidence) S.-E. Jiang, Y. Huang, and M. Li, “Structural evolution in deformation-induced rejuvenation in metallic glasses: A cavity perspective,” Chinese Physics B. 2019. link Times cited: 4 Abstract: Classical molecular dynamics simulations have been performed… read moreAbstract: Classical molecular dynamics simulations have been performed to investigate the structural evolution in deformation-induced rejuvenation in Cu80Zr20 metallic glass. Metallic glasses obtained by different cooling rates can be rejuvenated into the glassy state with almost the same potential energy by compressive deformation. The aging effect in different metallic glasses in cooling process can be completely erased by the deformation-induced rejuvenation. The evolution of cavities has been analyzed to understand the structural evolution in rejuvenation. It is found that as metallic glasses are rejuvenated by mechanical deformation, a lot of cavities are created. The lower the potential energy is, the more the cavities are created. The cavities are mainly created in the regions without cavities or with small cavities populated, indicating that the irreversible rearrangements induced by deformation are accompanied by the creation of cavity. This finding elucidates the underlying structural basis for rejuvenation and aging in metallic glasses from the cavity perspective. read less USED (high confidence) R. Jana and L. Pastewka, “Correlations of non-affine displacements in metallic glasses through the yield transition,” Journal of Physics: Materials. 2019. link Times cited: 18 Abstract: We study correlations of non-affine displacements during sim… read moreAbstract: We study correlations of non-affine displacements during simple shear deformation of Cu–Zr bulk metallic glasses in molecular dynamics calculations. In the elastic regime, our calculations show exponential correlation with a decay length that we interpret as the size of a shear transformation zone in the elastic regime. This correlation length becomes system-size dependent beyond the yield transition as our calculation develops a shear band, indicative of a diverging length scale. We discuss these observations in the context of a recent proposition of yield as a first-order phase transition. read less USED (high confidence) R. Christensen, Z. Li, and H. Gao, “An independent derivation and verification of the voids nucleation failure mechanism: significance for materials failure,” Proceedings of the Royal Society A. 2019. link Times cited: 7 Abstract: Independent derivations are given for the failure criteria o… read moreAbstract: Independent derivations are given for the failure criteria of the purely dilatational stress state involving voids nucleation failure as well as for the purely distortional stress state involving shear bands failure. The results are consistent with those from a recently derived failure theory and they further substantiate the failure theory. The voids nucleation mechanism is compared with the ideal theoretical strength of isotropic materials as derived by density functional theory and two other atomic-scale methods. It is found that a cross-over occurs from the voids nucleation failure mechanism to the ideal strength limitation as the tensile to compressive strengths ratio, T/C, increases toward a value of unity. All the results are consistent with the failure modes transition results from the general failure theory. read less USED (high confidence) C. Tang and P. Harrowell, “Composition susceptibility and the role of one, two, and three-body interactions in glass forming alloys: Cu50Zr50 vs Ni50Al50.,” The Journal of chemical physics. 2018. link Times cited: 1 Abstract: In this paper, we compare the composition fluctuations and i… read moreAbstract: In this paper, we compare the composition fluctuations and interaction potentials of a good metallic glass former, Cu50Zr50, and a poor glass former, Ni50Al50. The Bhatia-Thornton correlation functions are calculated. Motivated by the observation of chemical ordering at the NiAl surface, we derive a new property, R^cn(q), corresponding to the linear susceptibility of concentration to a perturbation in density. We present a direct comparison of the potentials for the two model alloys using a 2nd order density expansion, and establish that the one-body energy plays a crucial role in stabilizing the crystal relative to the liquid in both alloys but that the three-body contribution to the heat of fusion is significantly larger in NiAl than CuZr. read less USED (high confidence) B. Klumov et al., “Polytetrahedral structure and glass-forming ability of simulated Ni-Zr alloys.,” The Journal of chemical physics. 2018. link Times cited: 17 Abstract: Binary Cu-Zr system is a representative bulk glassformer dem… read moreAbstract: Binary Cu-Zr system is a representative bulk glassformer demonstrating high glass-forming ability (GFA). From the first glance, the Ni-Zr system is the most natural object to expect the same behavior because nickel and copper are neighbors in the periodic table and have similar physicochemical properties. However, it is known that the Ni-Zr system has worse GFA than the Cu-Zr one. To understand the underlying physics, we investigate the Ni α Zr1-α system in whole concentration range α ∈ [0, 1]. Doing molecular dynamic simulations with a reliable embedded atom model potential, we show that the simulated Ni-Zr system also has relatively low GFA, which is comparable to that for an additive binary Lennard-Jones mixture without any chemical interaction. Icosahedral local ordering in Ni-Zr alloys is known to be less pronounced than that in the Cu-Zr ones; we see that as well. However, the icosahedron is not the only structural motif responsible for GFA. We find that the local structure of glassy Ni α Zr1-α alloys at 0.3 < α < 0.65 can be described in terms of Z11-Z16 Kasper polyhedra with high density of topological defects including icosahedra as a part of this family. Concentration of topologically perfect Kasper polyhedra appears to be several times smaller than that in Cu-Zr. This is the reason for relatively poor GFA of the Ni-Zr system. read less USED (high confidence) L. Yang, “Structures and dynamics investigation of phase selection in metallic alloy systems.” 2018. link Times cited: 1 Abstract: Different phases of metallic alloys have a wide range of app… read moreAbstract: Different phases of metallic alloys have a wide range of applications. However, the driving mechanisms of the phase selections can be complex. For example, the detailed pathways of the phase transitions in the devitrification process still lack a comprehensive interpretation. So, the understanding of the driving mechanisms of the phase selections is very important. In this thesis, we focus on the study of the Al-Sm and other related metallic alloy systems by simulation and experiment. A procedure to evaluate the free energy has been developed within the framework of thermodynamic integration, coupled with extensive GPUaccelerated molecular dynamics (MD) simulations; The “spatially-correlated site occupancy” has been observed and measured in the -Al60Sm11 phase. Contrary to the common belief that nonstoichiometry is often the outcome of the interplay of enthalpy of formation and configurational entropy at finite temperatures, our results from Monte Carlo (MC) and molecular dynamics (MD) simulations, imply that kinetic effects, especially the limited diffusivity of Sm is crucial for the appearance of the observed spatial correlations in the nonstoichiometric phase. Moreover, in order to overcome the time limitation in MD simulation of the nucleation process, a “persistent-embryo method” has been developed, which opens a new avenue to study solidification under realistic experimental conditions via atomistic computer simulation. Based on this thesis study, we have achieved deeper understanding of the driving mechanisms of the phase selections, and laid a foundation for further prediction and control of the fabrication of novel metallic alloy materials. This thesis consists of the following seven chapters: read less USED (high confidence) K. V. Reddy and S. Pal, “Influence of Grain Boundary Complexion on Deformation Mechanism of High Temperature Bending Creep Process of Cu Bicrystal,” Transactions of the Indian Institute of Metals. 2018. link Times cited: 12 USED (high confidence) F. Puosi, A. Pasturel, N. Jakse, and D. Leporini, “Communication: Fast dynamics perspective on the breakdown of the Stokes-Einstein law in fragile glassformers.,” The Journal of chemical physics. 2018. link Times cited: 14 Abstract: The breakdown of the Stokes-Einstein (SE) law in fragile gla… read moreAbstract: The breakdown of the Stokes-Einstein (SE) law in fragile glassformers is examined by Molecular-Dynamics simulations of atomic liquids and polymers and consideration of the experimental data concerning the archetypical ortho-terphenyl glassformer. All the four systems comply with the universal scaling between the viscosity (or the structural relaxation) and the Debye-Waller factor ⟨u2⟩, the mean square amplitude of the particle rattling in the cage formed by the surrounding neighbors. It is found that the SE breakdown is scaled in a master curve by a reduced ⟨u2⟩. Two approximated expressions of the latter, with no and one adjustable parameter, respectively, are derived. read less USED (high confidence) H. Pang, Q. Bi, H. S. Huang, and Y. Lü, “Anisotropic stress inhibits crystallization in Cu-Zr glass-forming liquids.,” The Journal of chemical physics. 2017. link Times cited: 3 Abstract: Liquids attain a metastable state without crystallizing by c… read moreAbstract: Liquids attain a metastable state without crystallizing by cooling rapidly to a given temperature below the melting point. With increasing supercooling, the nucleation rate would show an increase based on the prediction of the classical nucleation theory. It is generally thought that the nucleation rate will reach the maximum upon approaching the glass transition temperature, Tg, for glass-forming liquids. We report that there exists a supercooled region above Tg in which the crystallization has actually been severely suppressed. Our molecular dynamics simulations show that the growth of embryos in the supercooled Cu60Zr40 melt is subjected to a strong anisotropic stress associated with the dynamic heterogeneity. Its long-range effect drives the embryo to grow into a ramified morphology so that the interface energy dominates over the embryo growth, leading to the suppression of nucleation. read less USED (high confidence) F. Li and M. Li, “Local environments of atomic clusters and the effect on dynamics in CuZr metallic glass-forming liquids,” Journal of Applied Physics. 2017. link Times cited: 12 Abstract: The effect of local environments of various atomic clusters … read moreAbstract: The effect of local environments of various atomic clusters on the dynamics in CuZr metallic glass-forming liquids was investigated via classical molecular dynamics simulations. It is found that atomic clusters exhibit different local connectivity, leading to different local environments, even for the same type of clusters. Moreover, local environments of atomic clusters are found to have a different impact on dynamics in supercooled liquids. For pentagon-rich clusters such as ⟨0,0,12,0⟩ and ⟨0,1,10,2⟩, the dynamics becomes slower with increasing connectivity in both α and β relaxation time scales. In contrast, as local connectivity increases, atomic mobility of connected ⟨0,3,6,4⟩ clusters is enhanced. The evolution of atomic symmetries in clusters with local connectivity is found to be the underlying structural basis for the correlation between local environments and dynamics of atomic clusters. These findings indicate that local environments of atomic clusters are more critical in the relaxation dynami... read less USED (high confidence) B. Zhu, M. Huang, and Z. Li, “Brittle to ductile transition of metallic glasses induced by embedding spherical nanovoids,” Journal of Applied Physics. 2017. link Times cited: 8 Abstract: The lack of global plasticity at low temperature seriously l… read moreAbstract: The lack of global plasticity at low temperature seriously limits the application of metallic glasses (MGs) as structural materials. An approach to enhance the MG-ductility by dispersed spherical nanovoids is suggested and validated by molecular dynamics in the present paper. By introducing these nanovoids, a deformation mode transition from localized shear banding to homogeneous flow occurs. The ratio of void-surface area to MG volume λ is revealed to be the dominant factor controlling this brittle-to-ductile transition. Generally, for a given void volume fraction, smaller nanovoids with larger λ have better toughening effects. It is also discovered that the ductile responses of porous MGs with embedded nanovoids remain unchanged, even after several cycles of tensile-compressive loads. The intrinsic mechanism may be the transition of energetic void-surface atoms into internal atoms with lower potential energy. This process induces many uniformly distributed potential nucleation sites for shear transforma... read less USED (high confidence) N. Amigo, M. Sepulveda-Macias, and G. Gutiérrez, “Martensitic transformation to monoclinic phase in bulk B2–CuZr,” Intermetallics. 2017. link Times cited: 14 USED (high confidence) L. Zhao, G. Bokas, J. Perepezko, and I. Szlufarska, “Nucleation kinetics in Al-Sm metallic glasses,” Acta Materialia. 2017. link Times cited: 24 USED (high confidence) E. Goudeli and S. Pratsinis, “Surface Composition and Crystallinity of Coalescing Silver-Gold Nanoparticles.,” ACS nano. 2017. link Times cited: 30 Abstract: Bimetallic nanoparticles exhibit catalytic, optical, electro… read moreAbstract: Bimetallic nanoparticles exhibit catalytic, optical, electronic, and magnetic synergy between their constituent metals. Typically, that synergy is traced to the domain structure and surface characteristics of such particles. Here these characteristics of coalescing Ag-Au nanoparticles of various initial sizes and morphologies (segregated or alloys) are investigated by atomistic molecular dynamics (MD) at different temperatures. Silver atoms exhibit increased mobility over Au and occupy gradually the surface of the coalesced (or sintered) bimetallic particle, consistent with scanning electron microscopy and selective O2 chemisorption experiments for heterogeneous catalysis of ethylene oxidation. The characteristic sintering time of equally sized Ag-Au nanoparticles is similar to that of pure Au but shorter than that of Ag nanoparticles. When the latter coalesce with substantially bigger Au ones, a patchy Ag layer is formed at the Au particle surface. However, when Ag nanoparticles are bigger, then Au is rather embedded into Ag, consistent with microscopy data. Most notably, X-ray diffraction (XRD) patterns of Ag-Au nanoparticles are obtained by MD, distinguishing segregated from alloyed ones. The latter exhibit a weaker XRD reflection of the (200) crystalline plane and, most distinctly, form smaller crystal size (highly polycrystalline) than coalescing pure and segregated Ag and Au nanoparticles, quantitatively explaining the structure of flame-made Ag-Au nanoparticles for biomaterial applications. read less USED (high confidence) F. Puosi, N. Jakse, and A. Pasturel, “Dynamical, structural and chemical heterogeneities in a binary metallic glass-forming liquid,” Journal of Physics: Condensed Matter. 2017. link Times cited: 16 Abstract: As it approaches the glass transition, particle motion in li… read moreAbstract: As it approaches the glass transition, particle motion in liquids becomes highly heterogeneous and regions with virtually no mobility coexist with liquid-like domains. This complex dynamic is believed to be responsible for different phenomena including non-exponential relaxation and the breakdown of the Stokes–Einstein relation. Understanding the relationships between dynamical heterogeneities and local structure in metallic liquids and glasses is a major scientific challenge. Here we use classical molecular dynamics simulations to study the atomic dynamics and microscopic structure of Cu50Zr50 alloy in the supercooling regime. Dynamical heterogeneities are identified via an isoconfigurational analysis. We demonstrate the transition from isolated to clustering low mobility with decreasing temperature. These slow clusters, whose sizes grow upon cooling, are also associated with concentration fluctuations, characterized by a Zr-enriched phase, with a composition CuZr2. In addition, a structural analysis of slow clusters based on Voronoi tessellation evidences an increase with respect of the bulk system of the fraction of Cu atoms having a local icosahedral order. These results are in agreement with the consolidated scenario of the relevant role played by icosahedral order in the dynamic slowing-down in supercooled metal alloys. read less USED (high confidence) C. Ma, G.-xiang Wang, C. Ye, and Y. Dong, “Shocking of metallic glass to induce microstructure heterogeneity: A molecular dynamics study,” Journal of Applied Physics. 2017. link Times cited: 10 Abstract: Surface severe plastic deformation (SSPD) has been demonstra… read moreAbstract: Surface severe plastic deformation (SSPD) has been demonstrated to improve the ductility of metallic glass. The physical interpretation, however, remains on the phenomenological level. In this study, a molecular dynamics (MD) simulation is carried out to elucidate the molecular mechanisms underlying the improvement in ductility. MD simulation reveals that shock waves resulting from SSPD can induce pre-deformed atoms, which are randomly embedded in the matrix of the metallic glass. The pre-deformed atoms have similar stress distribution and short-order structure as the matrix atoms, but with a larger atomic volume. When subjected to tensile or compressive stress, more shear bands are promoted by the pre-deformed atoms in the shock-treated sample as compared to the untreated one. The randomly distributed shear bands were found to experience more interactions, which delayed the catastrophic fracture, leading to increased ductility.Surface severe plastic deformation (SSPD) has been demonstrated to improve the ductility of metallic glass. The physical interpretation, however, remains on the phenomenological level. In this study, a molecular dynamics (MD) simulation is carried out to elucidate the molecular mechanisms underlying the improvement in ductility. MD simulation reveals that shock waves resulting from SSPD can induce pre-deformed atoms, which are randomly embedded in the matrix of the metallic glass. The pre-deformed atoms have similar stress distribution and short-order structure as the matrix atoms, but with a larger atomic volume. When subjected to tensile or compressive stress, more shear bands are promoted by the pre-deformed atoms in the shock-treated sample as compared to the untreated one. The randomly distributed shear bands were found to experience more interactions, which delayed the catastrophic fracture, leading to increased ductility. read less USED (high confidence) Y. Sun et al., “Overcoming the Time Limitation in Molecular Dynamics Simulation of Crystal Nucleation: A Persistent-Embryo Approach.,” Physical review letters. 2017. link Times cited: 36 Abstract: The crystal nucleation from liquid in most cases is too rare… read moreAbstract: The crystal nucleation from liquid in most cases is too rare to be accessed within the limited time scales of the conventional molecular dynamics (MD) simulation. Here, we developed a "persistent embryo" method to facilitate crystal nucleation in MD simulations by preventing small crystal embryos from melting using external spring forces. We applied this method to the pure Ni case for a moderate undercooling where no nucleation can be observed in the conventional MD simulation, and obtained nucleation rate in good agreement with the experimental data. Moreover, the method is applied to simulate an even more sluggish event: the nucleation of the B2 phase in a strong glass-forming Cu-Zr alloy. The nucleation rate was found to be 8 orders of magnitude smaller than Ni at the same undercooling, which well explains the good glass formability of the alloy. Thus, our work opens a new avenue to study solidification under realistic experimental conditions via atomistic computer simulation. read less USED (high confidence) M. Zhang et al., “Mechanical Relaxation-to-Rejuvenation Transition in a Zr-based Bulk Metallic Glass,” Scientific Reports. 2017. link Times cited: 52 USED (high confidence) C. Sterwerf, T. Kaub, C. Deng, G. Thompson, and L. Li, “Deformation mode transitions in amorphous-Cu45Zr55/crystalline-Cu multilayers,” Thin Solid Films. 2017. link Times cited: 22 USED (high confidence) M. Fu, Q. Bi, and Y. Lü, “Kinetics of Spherical Interface in Crystal Growth,” Chinese Physics Letters. 2017. link Times cited: 1 USED (high confidence) B. Schönfeld, J. Zemp, and U. Stuhr, “Thermal vibrations in the metallic glass Cu64Zr36,” Journal of Physics: Condensed Matter. 2017. link Times cited: 4 Abstract: Neutrons with 14.7 and 34 meV energy were used to determine … read moreAbstract: Neutrons with 14.7 and 34 meV energy were used to determine the elastic and inelastic part of the structure factor for the metallic glass Cu64Zr36 at 250 K. Based on the temperature dependence of the elastic scattering between 150 K and RT, an average mean-square displacement 〈u2〉=0.027(3) Å2 at 250 K is obtained. The experimental scattering-vector dependence of inelastic scattering in reference to elastic scattering is found to be well described by the Debye model. Both results are supported by molecular dynamics simulations. A procedure is presented to separate the elastic part also in total x-ray scattering. This allows the smearing of structural information due to thermal vibrations to be eliminated. read less USED (high confidence) C. Tang, H. Peng, Y. Chen, and M. Ferry, “Formation and dilatation of shear bands in a Cu-Zr metallic glass: A free volume perspective,” Journal of Applied Physics. 2016. link Times cited: 22 Abstract: We report the tensile deformation behaviour of metallic glas… read moreAbstract: We report the tensile deformation behaviour of metallic glass Cu50Zr50 as a function of quenching rate using molecular dynamics simulations. The atomic-scale shearing is found to be independent of atomic free volume, and the macroscopic correlation between the yield strength and density (or average free volume) is a coincidence, whereby samples with large free volume also have a low density of shear-resistant local five-fold symmetry. In the relatively slowly quenched (≤1010 K/s) samples, shear bands have a dilatation about 0.5%, which compares well with recent experimental results. In contrast, although more active local shearing occurs in the rapidly quenched samples, shear banding is not observed. This is because the strain energy disperses into local atomic shearing at the macroscopically elastic stage and, hence, is not sufficient for shear band activation, resulting in homogeneous deformation and appreciable plasticity. read less USED (high confidence) Z. Pan and T. Rupert, “Spatial variation of short-range order in amorphous intergranular complexions,” Computational Materials Science. 2016. link Times cited: 10 USED (high confidence) T. Rupert, “The role of complexions in metallic nano-grain stability and deformation,” Current Opinion in Solid State & Materials Science. 2016. link Times cited: 63 USED (high confidence) Z. Pan and T. Rupert, “Formation of ordered and disordered interfacial films in immiscible metal alloys,” arXiv: Materials Science. 2016. link Times cited: 24 USED (high confidence) Y.-C. Hu, F. Li, M. Li, H. Bai, and W. Wang, “Structural signatures evidenced in dynamic crossover phenomena in metallic glass-forming liquids,” Journal of Applied Physics. 2016. link Times cited: 31 Abstract: Molecular dynamics simulations were performed to investigate… read moreAbstract: Molecular dynamics simulations were performed to investigate dynamic evolution in metallic glass-forming liquids during quenching from high temperature above melting point down to supercooled region. Two crossover temperatures TA and TS (TA > TS) are identified, and their physical meanings are clarified. TA and TS are found to be not only the sign of dynamic crossover phenomena but also the manifestation of two key structure correlation lengths ξs. As temperature decreases below TA, ξs goes beyond the nearest-neighbor distance, resulting in the Arrhenius-to-non-Arrhenius transition of structural relaxation time and the failure of Stokes-Einstein (SE) relation. As TS is traversed, the increase rate of ξs reaches the maximum, leading to the simultaneous appearance of dynamical heterogeneity and fractional SE relation. It is further found that structure correlation increases much faster than dynamic correlation, playing a role of structural precursor for dynamic evolution in liquids. Thus, a structural link ... read less USED (high confidence) A. Liu, R. Tabor, L. Bourgeois, M. D. de Jonge, S. Mudie, and T. Petersen, “Probing local order in glasses from limited-volume electron and x-ray diffraction,” Journal of Statistical Mechanics: Theory and Experiment. 2016. link Times cited: 11 Abstract: It has long been recognised that spatial fluctuations in loc… read moreAbstract: It has long been recognised that spatial fluctuations in local order in disordered assemblies of particles can be probed using limited-volume diffraction measurements. These measurements have unique advantages over broad-beam diffraction experiments that isotropically average over many structural configurations and result in one-dimensional intensity curves, requiring modelling to interpret. Despite the advantages of limiting illumination to a low number of particle configurations, obtaining quantitative measurements of local order from such experiments remains a challenge. The effects on the diffraction pattern of changing the beam energy, lateral size, aberrations and coherence and the specimen thickness have only recently been clarified. We review theoretical and experimental efforts in this direction in the fields of both electron and x-ray diffraction and identify promising areas of future development. read less USED (high confidence) J. Douglas, B. A. P. Betancourt, X. Tong, and H. Zhang, “Localization model description of diffusion and structural relaxation in glass-forming Cu–Zr alloys,” Journal of Statistical Mechanics: Theory and Experiment. 2016. link Times cited: 56 Abstract: We test the localization model (LM) prediction of a paramete… read moreAbstract: We test the localization model (LM) prediction of a parameter-free relationship between the α-structural relaxation time τ α and the Debye–Waller factor 〈u 2 〉 for a series of simulated glass-forming Cu–Zr metallic liquids having a range of alloy compositions. After validating this relationship between the picosecond (‘fast’) and long-time relaxation dynamics over the full range of temperatures and alloy compositions investigated in our simulations, we show that it is also possible to estimate the self-diffusion coefficients of the individual atomic species (D Cu, D Zr) and the average diffusion coefficient D using the LM, in conjunction with the empirical fractional Stokes–Einstein (FSE) relation linking these diffusion coefficients to τ α . We further observe that the fragility and extent of decoupling between D and τ α strongly correlate with 〈u 2 〉 at the onset temperature of glass-formation T A where particle caging and the breakdown of Arrhenius relaxation first emerge. read less USED (high confidence) S. Q. Jiang, Z. W. Wu, and M. Li, “Effect of local structures on crystallization in deeply undercooled metallic glass-forming liquids.,” The Journal of chemical physics. 2016. link Times cited: 15 Abstract: The crystallization mechanism in deeply undercooled ZrCu met… read moreAbstract: The crystallization mechanism in deeply undercooled ZrCu metallic glass-forming liquids was investigated via molecular dynamics simulations. It was found that the crystallization process is mainly controlled by the growth of crystal nuclei formed by the BCC-like atomic clusters, consistent with experimental speculations. The crystallization rate is found to relate to the number of growing crystal nuclei in the crystallization process. The crystallization rate in systems with more crystal nuclei is significantly hindered by the larger surface fractions of crystal nuclei and their different crystalline orientations. It is further revealed that in the crystallization in deeply undercooled regions, the BCC-like crystal nuclei are formed from the inside of the precursors formed by the FCC-like atomic clusters, and growing at the expense of the precursors. Meanwhile, the precursors are expanding at the expense of the outside atomic clusters. This process is consistent with the so-called Ostwald step rule. The atomic structures of metallic glasses are found to have significant impact on the subsequent crystallization process. In the Zr85Cu15 system, the stronger spatial correlation of Cu atoms could hinder the crystallization processes in deeply undercooled regions. read less USED (high confidence) X. J. Han, J. G. Li, and H. Schober, “High temperature breakdown of the Stokes-Einstein relation in a computer simulated Cu-Zr melt.,” The Journal of chemical physics. 2016. link Times cited: 29 Abstract: Transport properties and the Stokes-Einstein (SE) relation i… read moreAbstract: Transport properties and the Stokes-Einstein (SE) relation in liquid Cu8Zr3 are studied by molecular dynamics simulation with a modified embedded atom potential. The critical temperature Tc of mode coupling theory (MCT) is derived as 930 K from the self-diffusion coefficient D and viscosity η. The SE relation breaks down around TSE = 1900 K, which is far above Tc. At temperatures below TSE, the product of D and η fluctuates around a constant value, similar to the prediction of MCT near Tc. The influence of the microscopic atomic motion on macroscopic properties is investigated by analyzing the time dependent liquid structure and the self-hole filling process. The self-holes for the two components are preferentially filled by atoms of the same component. The self-hole filling dynamics explains the different breakdown behaviors of the SE relation in Zr-rich liquid CuZr2 compared to Cu-rich Cu8Zr3. At TSE, a kink is found in the temperature dependence of both partial and total coordination numbers for the three atomic pair combinations and of the typical time of self-hole filling. This indicates a strong correlation between liquid structure, atomic dynamics, and the breakdown of SE relation. The previously suggested usefulness of the parameter d(D1/D2)/dT to predict TSE is confirmed. Additionally we propose a viscosity criterion to predict TSE in the absence of diffusion data. read less USED (high confidence) X. Yan and Y. Lü, “Mechanism of abnormally slow crystal growth of CuZr alloy.,” The Journal of chemical physics. 2015. link Times cited: 14 Abstract: Crystal growth of the glass-forming CuZr alloy is shown to b… read moreAbstract: Crystal growth of the glass-forming CuZr alloy is shown to be abnormally slow, which suggests a new method to identify the good glass-forming alloys. The crystal growth of elemental Cu, Pd and binary NiAl, CuZr alloys is systematically studied with the aid of molecular dynamics simulations. The temperature dependence of the growth velocity indicates the different growth mechanisms between the elemental and the alloy systems. The high-speed growth featuring the elemental metals is dominated by the non-activated collision between liquid-like atoms and interface, and the low-speed growth for NiAl and CuZr is determined by the diffusion across the interface. We find that, in contrast to Cu, Pd, and NiAl, a strong stress layering arisen from the density and the local order layering forms in front of the liquid-crystal interface of CuZr alloy, which causes a slow diffusion zone. The formation of the slow diffusion zone suppresses the interface moving, resulting in much small growth velocity of CuZr alloy. We provide a direct evidence of this explanation by applying the compressive stress normal to the interface. The compression is shown to boost the stress layering in CuZr significantly, correspondingly enhancing the slow diffusion zone, and eventually slowing down the crystal growth of CuZr alloy immediately. In contrast, the growth of Cu, Pd, and NiAl is increased by the compression because the low diffusion zones in them are never well developed. read less USED (high confidence) S. Pan, S. Feng, J. Qiao, W. M. Wang, and J. Qin, “Correlation between local structure and dynamic heterogeneity in a metallic glass-forming liquid,” arXiv: Disordered Systems and Neural Networks. 2015. link Times cited: 44 USED (high confidence) S. Lee, M. Jafary-Zadeh, D. Z. Chen, Y.-W. Zhang, and J. Greer, “Size Effect Suppresses Brittle Failure in Hollow Cu60Zr40 Metallic Glass Nanolattices Deformed at Cryogenic Temperatures.,” Nano letters. 2015. link Times cited: 73 Abstract: To harness "smaller is more ductile" behavior emer… read moreAbstract: To harness "smaller is more ductile" behavior emergent at nanoscale and to proliferate it onto materials with macroscale dimensions, we produced hollow-tube Cu60Zr40 metallic glass nanolattices with the layer thicknesses of 120, 60, and 20 nm. They exhibit unique transitions in deformation mode with tube-wall thickness and temperature. Molecular dynamics simulations and analytical models were used to interpret these unique transitions in terms of size effects on the plasticity of metallic glasses and elastic instability. read less USED (high confidence) J. E. Ludy and T. Rupert, “Amorphous intergranular films act as ultra-efficient point defect sinks during collision cascades,” arXiv: Materials Science. 2015. link Times cited: 24 USED (high confidence) H.-B. Yu, R. Richert, R. Maaß, and K. Samwer, “Strain induced fragility transition in metallic glass,” Nature Communications. 2015. link Times cited: 30 USED (high confidence) T. Brink, M. Peterlechner, H. Rosner, K. Albe, and G. Wilde, “Influence of Crystalline Nanoprecipitates on Shear-Band Propagation in Cu-Zr Based Metallic Glasses,” arXiv: Materials Science. 2015. link Times cited: 48 Abstract: The interaction of shear bands with crystalline nanoprecipit… read moreAbstract: The interaction of shear bands with crystalline nanoprecipitates in Cu-Zr-based metallic glasses is investigated by a combination of high-resolution TEM imaging and molecular-dynamics computer simulations. Our results reveal different interaction mechanisms: Shear bands can dissolve precipitates, can wrap around crystalline obstacles, or can be blocked depending on size and density of the precipitates. If the crystalline phase has a low yield strength, we also observe slip transfer through the precipitate. Based on the computational results and experimental findings, a qualitative mechanism map is proposed that categorizes the various processes as a function of the critical stress for dislocation nucleation, precipitate size, and distance. read less USED (high confidence) W. Song and S.-jin Zhao, “Effects of partitioned enthalpy of mixing on glass-forming ability.,” The Journal of chemical physics. 2015. link Times cited: 4 Abstract: We explore the inherent reason at atomic level for the glass… read moreAbstract: We explore the inherent reason at atomic level for the glass-forming ability of alloys by molecular simulation, in which the effect of partitioned enthalpy of mixing is studied. Based on Morse potential, we divide the enthalpy of mixing into three parts: the chemical part (ΔEnn), strain part (ΔEstrain), and non-bond part (ΔEnnn). We find that a large negative ΔEnn value represents strong AB chemical bonding in AB alloy and is the driving force to form a local ordered structure, meanwhile the transformed local ordered structure needs to satisfy the condition (ΔEnn/2 + ΔEstrain) < 0 to be stabilized. Understanding the chemical and strain parts of enthalpy of mixing is helpful to design a new metallic glass with a good glass forming ability. Moreover, two types of metallic glasses (i.e., "strain dominant" and "chemical dominant") are classified according to the relative importance between chemical effect and strain effect, which enriches our knowledge of the forming mechanism of metallic glass. Finally, a soft sphere model is established, different from the common hard sphere model. read less USED (high confidence) Z. Pan and T. Rupert, “Amorphous intergranular films as toughening structural features,” arXiv: Materials Science. 2015. link Times cited: 98 USED (high confidence) B. Qing-Ling and L. Yong-Jun, “A Kinetic Transition from Low to High Fragility in Cu-Zr Liquids,” Chinese Physics Letters. 2014. link Times cited: 1 Abstract: Researchers have reported that Cu-Zr liquids are kinetically… read moreAbstract: Researchers have reported that Cu-Zr liquids are kinetically strong at the best glass-forming compositions. Here we systematically study the temperature dependence of viscosity and diffusion of Cu-Zr liquids using molecular dynamics simulations, and the results illustrate that the better glass formers are actually more fragile close to the glass transition. There is a kinetic transition from low to high fragility when the optimal glass-forming liquids are quenched into glass states. This transition is associated with the more rapid decrease of the excess entropy of the liquids above and close to the glass transition temperature, Tg, compared to other compositions. Accompanied by the transition to high fragility, peaks in the thermal expansivity and specific heat are observed at the optimal compositions. Furthermore, the Stokes—Einstein relation is examined over a wide composition range for Cu-Zr alloys, and the results indicate that glass-forming ability closely correlates with dynamical heterogeneity. read less USED (high confidence) X. Fang, L. Huang, C. Wang, K. Ho, and Z. Ding, “Structure of Cu64.5Zr35.5 metallic glass by reverse Monte Carlo simulations,” Journal of Applied Physics. 2014. link Times cited: 6 Abstract: Reverse Monte Carlo simulations (RMC) have been widely used … read moreAbstract: Reverse Monte Carlo simulations (RMC) have been widely used to generate three dimensional (3D) atomistic models for glass systems. To examine the reliability of the method for metallic glass, we use RMC to predict the atomic configurations of a “known” structure from molecular dynamics (MD) simulations, and then compare the structure obtained from the RMC with the target structure from MD. We show that when the structure factors and partial pair correlation functions from the MD simulations are used as inputs for RMC simulations, the 3D atomistic structure of the glass obtained from the RMC gives the short- and medium-range order in good agreement with those from the target structure by the MD simulation. These results suggest that 3D atomistic structure model of the metallic glass alloys can be reasonably well reproduced by RMC method with a proper choice of input constraints. read less USED (high confidence) W. Liu, H. Ruan, and L. Zhang, “Understanding the brittleness of metallic glasses through dynamic clusters,” Journal of Materials Research. 2014. link Times cited: 3 Abstract: Exploiting molecular dynamics simulation, this article inves… read moreAbstract: Exploiting molecular dynamics simulation, this article investigates the dynamic process of atomic rearrangement in two metallic glasses (MGs), Cu_50Zr_50 and Fe_80P_20, which are well known as ductile and brittle MGs under compression, respectively. It was found that the local rearrangements can be identified clearly by the distribution of kinetic energy and atomic strain rate, and that they are always driven by several high-velocity atoms in the core and induce a large shear and tensile strain over a very short duration. The size, kinetic energy, strain rate, and cavitation rate of the clusters in Fe_80P_20 are markedly larger than those in Cu_50Zr_50, which explains the distinct strength and brittleness of these two MGs. This study further confirmed that localized rearrangement of atomic structure is the underlying mechanism of plastic deformation in MGs, which governs their macro-scale mechanical performance. read less USED (high confidence) A. Gangopadhyay et al., “Anomalous thermal contraction of the first coordination shell in metallic alloy liquids.,” The Journal of chemical physics. 2014. link Times cited: 35 Abstract: Except for a few anomalous solids and liquids, materials exp… read moreAbstract: Except for a few anomalous solids and liquids, materials expand upon heating. For liquids, this should be reflected as a shift in the peak positions in the pair correlation function, g(r), to higher r. Here, we present the results of a detailed study of the volume thermal expansion coefficients and the temperature dependences of g(r) for a large number of binary, ternary, and quaternary liquids in the equilibrium and supercooled (metastable liquid below the liquidus temperature) states. The data were obtained from x-ray scattering and volume measurements on levitated liquids using the electrostatic levitation technique. Although the volumes of all liquids expand with increasing temperature, the peak positions in g(r) for the first coordination shells contract for the majority of alloy liquids studied. The second and third peaks in g(r) expand, but at rates different from those expected from the volume expansion. This behavior is explained qualitatively in terms of changes in the coordination numbers and bond-lengths as clusters in liquids break up with increasing temperature. read less USED (high confidence) M. Mendelev, M. Kramer, S. Hao, K. Ho, and C. Z. Wang, “Development of interatomic potentials appropriate for simulation of liquid and glass properties of NiZr2 alloy,” Philosophical Magazine. 2012. link Times cited: 116 Abstract: A new interatomic potential for the Ni–Zr system is presente… read moreAbstract: A new interatomic potential for the Ni–Zr system is presented. This potential was developed specifically to match experimental scattering data from Ni, Zr and NiZr2 liquids. Both ab initio and published thermodynamic data were used to optimise the potential to study the liquid and amorphous structure of the NiZr2 alloy. This potential has the C 16 phase, being more stable than C 11b phase in the NiZr2 alloy, consistent with experiments. The potential leads to the correct glass structure in the molecular dynamics simulation and, therefore, can be used to study the liquid–glass transformation in the NiZr2 alloy. read less USED (high confidence) C. Deng and C. Schuh, “Atomistic mechanisms of cyclic hardening in metallic glass,” Applied Physics Letters. 2012. link Times cited: 57 Abstract: Molecular dynamics with an embedded-atom method potential is… read moreAbstract: Molecular dynamics with an embedded-atom method potential is used to simulate the nanoindentation of Cu63.5Zr36.5 metallic glasses. In particular, the effects of cyclic loading within the nominal elastic range on the overall strength and plasticity of metallic glass are studied. The simulated results are in line with the characteristics of experimentally observed hardening effects. In addition, analysis based on local von Mises strain suggests that the hardening is induced by confined microplasticity and stiffening in regions of the originally preferred yielding path, requiring a higher applied load to trigger a secondary one. read less USED (high confidence) M. Mendelev, “Molecular dynamics simulation of solidification and devitrification in a one-component system,” Modelling and Simulation in Materials Science and Engineering. 2012. link Times cited: 16 Abstract: A specially designed semi-empirical potential of the Finnis–… read moreAbstract: A specially designed semi-empirical potential of the Finnis–Sinclair type was used to simulate the phase transformation in a disordered one-component system. The potential provides that the face-centered cubic (fcc) phase is the most stable phase in the system below the melting temperature, Tm; however, the potential does not lead to the fcc nucleation during molecular dynamics (MD) simulation, allowing studying the liquid–glass transformation. The potential also allows studying the fcc-liquid and fcc-glass interface migration. It was found that the liquid–glass transformation described by this potential is of the first order. The Wilson–Frenkel theory of the solid–liquid interface (SLI) migration satisfactory describes the results of the MD simulation in the temperature interval from 0.55Tm to Tm while the Broughton–Gilmer–Jackson theory is less accurate in describing the temperature dependence of the SLI velocity in the same temperature interval. Below 0.55Tm, the results of the MD simulation strongly depend on how the disordered phase model was prepared and none of the existing theories is capable of reproducing the temperature dependence of the interface velocity. read less USED (high confidence) T. Wang and R. Napolitano, “A Phase-Field Model for Phase Transformations in Glass-Forming Alloys,” Metallurgical and Materials Transactions A. 2012. link Times cited: 11 USED (high confidence) M. Horstemeyer, D. Farkas, S. Kim, T. Tang, and G. Potirniche, “Nanostructurally small cracks (NSC): A review on atomistic modeling of fatigue,” International Journal of Fatigue. 2010. link Times cited: 72 USED (high confidence) M. Mendelev et al., “Experimental and computer simulation determination of the structural changes occurring through the liquid–glass transition in Cu–Zr alloys,” Philosophical Magazine. 2010. link Times cited: 44 Abstract: Molecular dynamics (MD) simulations were performed of the st… read moreAbstract: Molecular dynamics (MD) simulations were performed of the structural changes occurring through the liquid–glass transition in Cu–Zr alloys. The total scattering functions (TSF), and their associated primary diffuse scattering peak positions (K p), heights (K h) and full-widths at half maximum (K FWHM) were used as metrics to compare the simulations to high-energy X-ray scattering data. The residuals of difference between the model and experimental TSFs are ∼0.03 for the liquids and about 0.07 for the glasses. Over the compositional range studied, Zr1− x Cu x (0.1 ≤ x ≤ 0.9), K p, K h and K FWHM show a strong dependence on composition and temperature. The simulation and experimental data correlate well between each other. MD simulation revealed that the Cu–Zr bonds undergo the largest changes during cooling of the liquid, whereas the Cu–Cu bonds change the least. Changes in the partial-pair correlations are more readily seen in the second and third shells. The Voronoi polyhedra (VP) in glasses are dominated by only a few select types that are compositionally dependent. The relative concentrations of the dominant VPs rapidly change in their relative proportion in the deeply undercooled liquid. The experimentally determined region of best glass formability, x Cu ∼ 65%, shows the largest temperature dependent changes for the deeply undercooled liquid in the MD simulation. This region also exhibits very strong temperature dependence for the diffusivity and the total energy of the system. These data point to a strong topological change in the best glass-forming alloys and a concurrent change in the VP chemistry in the deeply undercooled liquid. read less USED (high confidence) G. Xinqiang, S. Yonghao, Z. Wang, M. Li, and H. Bai, “Effect of icosahedral clusters on β-relaxations in metallic glasses*,” Chinese Physics B. 2017. link Times cited: 2 Abstract: The most pronounced β-relaxation was found in the Y-based bi… read moreAbstract: The most pronounced β-relaxation was found in the Y-based binary metallic glasses (MGs). The correlation between β-relaxation and local atomic structure was studied. The dynamic mechanical measurements were performed for three chosen binary systems: Zr-, Ti-, and Y-based MGs. The experimental results show that, in each systemthe larger negative enthalpy of mixing ( between the component elements makes β-relaxation become more pronounced. The less negative value of facilitates the formation of icosahedral clusters, which have a pinning effect on the excitation of β-relaxations and correspondingly make the β-relaxation become less pronounced. These chemical effects on β-relaxations can only be compared in the same MG system, and it is not suitable for the comparison between different systems due to the different features of the major metallic elements. read less USED (low confidence) H. Ma et al., “Roots seeking of multiple shear-bands in amorphous alloys at the atomic scale,” Journal of Non-Crystalline Solids. 2024. link Times cited: 0 USED (low confidence) B. Fan and M. Z. Li, “Topology of icosahedral network responsible for yielding in CuZr metallic glasses,” Computational Materials Science. 2024. link Times cited: 0 USED (low confidence) J. Wang, X. Liu, Y. Wu, H. Wang, D. Ma, and Z. Lu, “Clustering-mediated enhancement of glass-forming ability and plasticity in oxygen-minor-alloyed Zr-Cu metallic glasses,” Acta Materialia. 2023. link Times cited: 0 USED (low confidence) Y. Xu, S. Feng, X. Lu, and L.-M. Wang, “Identification of atomic rearrangements in amorphous alloys based on machine learning,” Journal of Materials Research and Technology. 2023. link Times cited: 0 USED (low confidence) U. Rahardja, A. Sari, A. H. Alsalamy, S. K. Askar, A. Alawadi, and B. Abdullaeva, “Tribological Properties Assessment of Metallic Glasses Through a Genetic Algorithm-Optimized Machine Learning Model,” Metals and Materials International. 2023. link Times cited: 2 USED (low confidence) J. Dong et al., “Non-affine atomic rearrangement of glasses through stress-induced structural anisotropy,” Nature Physics. 2023. link Times cited: 1 USED (low confidence) Z. Zhou et al., “Effect of precipitate shape and distribution on mechanical behavior of shape memory metallic glass composites by molecular dynamics method,” Journal of Alloys and Compounds. 2023. link Times cited: 0 USED (low confidence) L. Gao, Y. Sun, and H.-B. Yu, “Mobility percolation as a source of Johari-Goldstein relaxation in glasses,” Physical Review B. 2023. link Times cited: 1 USED (low confidence) J. Li, Z. Du, M. Wang, C. Chen, and C. Deng, “Planar fault assisted dynamic recrystallization in copper during high-velocity impacts,” Journal of Applied Physics. 2023. link Times cited: 0 USED (low confidence) J. Xu, D. Xue, O. Gaidai, Y. Wang, and S. Xu, “Molecular Dynamics Simulation of Femtosecond Laser Ablation of Cu50Zr50 Metallic Glass Based on Two-Temperature Model,” Processes. 2023. link Times cited: 1 Abstract: Femtosecond laser machining, characterized by a small heat-a… read moreAbstract: Femtosecond laser machining, characterized by a small heat-affected zone, high precision, and non-contact operation, is ideal for processing metallic glasses. In this study, we employed a simulation method that combines the two-temperature model with molecular dynamics to investigate the effects of fluence and pulse duration on the femtosecond laser ablation of Cu50Zr50 metallic glass. Our results showed that the ablation threshold of the target material was 84 mJ/cm2 at a pulse duration of 100 fs. As the pulse durations increased, the maximum electron temperature at the same position on the target surface decreased, while the electron–lattice temperature coupling time showed no significant difference. As the absorbed fluence increased, the maximum electron temperature at the same position on the target surface increased, while the electron–lattice temperature coupling time became shorter. The surface ablation of the target material was mainly induced by phenomena such as melting, spallation, and phase explosion caused by femtosecond laser irradiation. Overall, our findings provide valuable insights for optimizing the femtosecond laser ablation process for metallic glasses. read less USED (low confidence) X. Wei, W. Wang, and P. Guan, “Local structural power exponent as an indicator of elastic heterogeneity in glasses,” Physical Review B. 2023. link Times cited: 0 USED (low confidence) J. Rong, P. Zhu, and Y. Xu, “Molecular dynamics simulation of mechanical response of Cu50Zr50 metallic glass under double shock loading,” Journal of Applied Physics. 2023. link Times cited: 1 Abstract: In real applications, materials are often subjected to multi… read moreAbstract: In real applications, materials are often subjected to multiple shock loadings, under which the mechanical response is rather complicated and needs in-depth studies. In this paper, molecular dynamics simulations of Cu50Zr50 metallic glass (MG) that has broad application prospects in various fields under double-shock loading have been carried out in order to uncover the deformation mechanism of MG in the dynamic process. By varying the velocity and the time interval from the first shock, we found that the double shock can lead to different phenomena such as recompaction, second spallation, uncompaction, or non-spallation. We further investigated the characteristics of these different phenomena through analyzing the damage area, stress distribution, density, and temperature in the shock processes. It was found that the void collapse caused high local stress and high temperature. We also found that the shear deformation resistance of the recompaction region cannot be recovered after recompaction through the quantitative statistics of the icosahedral clusters. Moreover, the material softening caused by high temperature in the recompaction region was the main reason for second spallation. In addition, a small second shock velocity could not induce the recompaction and a small interval time between two shocks inhibited the occurrence of the first spallation. The insights gained in this study contribute to a better understanding of the dynamic response of MGs under double-shock loadings. read less USED (low confidence) K. Zhao, Y. Wang, and P. Cao, “Fracture universality in amorphous nanowires,” Journal of the Mechanics and Physics of Solids. 2023. link Times cited: 3 USED (low confidence) Z.-yuan Gan, P.-wei Wang, M.-fei Li, Y. Zhou, B. Malomo, and L. Yang, “Structural mechanisms of enhanced mechanical properties in amorphous–nanocrystalline ZrCu alloys under irradiation,” Journal of Materials Science. 2023. link Times cited: 1 USED (low confidence) M. Wakeda and J. Saida, “Temperature-dependent effect of cooling rate on the melt-quenching process of metallic glasses,” Computational Materials Science. 2023. link Times cited: 2 USED (low confidence) Y. Liu, H. Liu, and H. Peng, “Pinning effect on the correlations of nonaffine displacement in metallic glasses,” Journal of Non-Crystalline Solids. 2023. link Times cited: 1 USED (low confidence) Y. Wu, B. Xu, X. Zhang, and P. Guan, “Machine-Learning Inspired Density-Fluctuation Model of Local Structural Instability in Metallic Glasses,” SSRN Electronic Journal. 2023. link Times cited: 10 USED (low confidence) J. Yang, H. Zhang, A. Salameh, V. R. Malik, and K. Saxena, “An investigation on plastic deformation and nanomechanical properties of Cu60Zr40/ Ni80P20 amorphous nanolaminates,” Proceedings of the Institution of Mechanical Engineers, Part E: Journal of Process Mechanical Engineering. 2023. link Times cited: 0 Abstract: This paper aims to investigate the nanomechanical properties… read moreAbstract: This paper aims to investigate the nanomechanical properties of amorphous nanolaminates by using the molecular dynamic (MD) simulation of nanoindentation process. To achieve this goal, two metallic glass (MG) nanolaminates with the arrangement of Cu60Zr40/Ni80P20 (CN type) and Ni80P20/Cu60Zr40 (NC type) were constructed. The MD outcomes unveiled that the NC-type sample exhibited a weaker strength at the loading stage and experienced a sharper relaxation at the end of holding stage. The strain maps of samples also revealed that the plastic deformation in the CN type initiated at the interface of substrate/indenter and was generated into the depth of material with a pear-like shape. On the other hand, the NC-type sample showed an accumulation of strain at the top layer normal to the direction of indenting process. This result indicated that the plasticity evolution occurred with a homogenous mode in the bulk of CN-type nanolaminate. read less USED (low confidence) R. Sivaraman, F. M. A. Altalbawy, A. M. H. Wais, H. A. Lafta, and S. H. Hashemi, “Characterization of Plastic Deformation in CuZr Metallic Glasses Subjected to the Rolling Process,” Advances in Materials Science and Engineering. 2023. link Times cited: 0 Abstract: Using the rolling process, it is possible to induce multiple… read moreAbstract: Using the rolling process, it is possible to induce multiple shear bands in the microstructure of metallic glasses (MGs) and improve the overall plasticity in the subsequent mechanical loadings. Hence, it is crucial to understand the mechanism of shear banding and plastic deformation under the rolling process. In this work, molecular dynamics (MD) simulation was applied to evaluate the formation and generation of shear bands in a CuZr MG under cold- and hot-rolling processes. Based on the results, it is found that the shear bands are formed with secondary branches in the cold rolling, while the shear events are scattered in the bulk of material in the hot rolling. Considering Voronoi analysis, it is revealed that the hot rolling is accompanied by the recovery of crystalline-like clusters provided that rolling process continues for subsequent passes. On the other hand, the cold-rolled sample shows a stable behavior in the evolution of crystalline-like clusters; however, the population of main icosahedral polyhedrons decreases in the system. read less USED (low confidence) J. Duan, Y. Wang, L. Dai, and M. Jiang, “Elastic interactions of plastic events in strained amorphous solids before yield,” Physical Review Materials. 2023. link Times cited: 5 USED (low confidence) H. Zhang, C. Luo, Z. Zheng, and Y. Han, “Effects of size ratio on particle packing in binary glasses,” Acta Materialia. 2023. link Times cited: 1 USED (low confidence) B. Waters, D. S. Karls, I. Nikiforov, R. Elliott, E. Tadmor, and B. Runnels, “Automated determination of grain boundary energy and potential-dependence using the OpenKIM framework,” Computational Materials Science. 2022. link Times cited: 5 USED (low confidence) P.-wei Wang, H. Jing, M.-fei Li, B. Malomo, and L. Yang, “Effective self-healing behavior of nanocrystalline-amorphous laminated alloy under irradiation,” Journal of Applied Physics. 2022. link Times cited: 0 Abstract: An extensive investigation on the microstructural evolution … read moreAbstract: An extensive investigation on the microstructural evolution of nanocrystalline–amorphous laminated alloys (NALAs) by molecular dynamics simulations and mechanistic analysis have been conducted to apprehend the interplay of complex phenomena governing structural changes in this alloy under neutron irradiation. It was discovered from the evolution profiles of free volumes, atomic unfilled spaces, and irradiation-induced vacancies that the profound structural response of the NALA was orchestrated by the rapid and spontaneous recovery of free volumes that indicate a self-healing ability in the amorphous zone, while the phenomenon of geometric atomic reconstitution in local structures governs the effective self-healing capacity for annihilated nanocrystal regions. Furthermore, a distinctive, self-migration/diffusion capture dynamics for the annihilation of defects by phase boundaries was discovered as an effective self-healing mechanism in NALAs. These findings will potentially facilitate the development of advanced nuclear materials with high irradiation resistance. read less USED (low confidence) J. Q. Wu, H. P. Zhang, Y. F. He, and M. Z. Li, “Unsupervised machine learning study on structural signature of glass transition in metallic glass-forming liquids,” Acta Materialia. 2022. link Times cited: 2 USED (low confidence) Z. Han, P.-wei Wang, M.-fei Li, B. Malomo, and L. Yang, “Structural responses of heterogeneous nanocrystalline/amorphous laminated alloy under irradiation,” Materialia. 2022. link Times cited: 0 USED (low confidence) N. Amigo, “Cryogenic thermal cycling rejuvenation in metallic glasses: Structural and mechanical assessment,” Journal of Non-Crystalline Solids. 2022. link Times cited: 2 USED (low confidence) J. Rong, P. Zhu, and Y. Xu, “Molecular Dynamics Simulation of Spallation of Metallic Glasses under Ultra-High Strain Rates,” Materials Today Communications. 2022. link Times cited: 2 USED (low confidence) D. Louzguine-Luzgin, “Structural Changes in Metallic Glass-Forming Liquids on Cooling and Subsequent Vitrification in Relationship with Their Properties,” Materials. 2022. link Times cited: 13 Abstract: The present review is related to the studies of structural c… read moreAbstract: The present review is related to the studies of structural changes observed in metallic glass-forming liquids on cooling and subsequent vitrification in terms of radial distribution function and its analogues. These structural changes are discussed in relationship with liquid’s properties, especially the relaxation time and viscosity. These changes are found to be directly responsible for liquid fragility: deviation of the temperature dependence of viscosity of a supercooled liquid from the Arrhenius equation through modification of the activation energy for viscous flow. Further studies of this phenomenon are necessary to provide direct mathematical correlation between the atomic structure and properties. read less USED (low confidence) P. Garg and T. Rupert, “Grain incompatibility determines the local structure of amorphous grain boundary complexions,” Acta Materialia. 2022. link Times cited: 4 USED (low confidence) S. Cui, H. Liu, and H. Peng, “Anisotropic correlations of plasticity on the yielding of metallic glasses.,” Physical review. E. 2022. link Times cited: 4 Abstract: We report computer simulations on the shear deformation of C… read moreAbstract: We report computer simulations on the shear deformation of CuZr metallic glasses at zero and room temperatures. Shear bands emerge in athermal alloys at strain γ_{c}, with a finite-size effect found. The correlation of nonaffine displacement exhibits an exponential decay even after yielding in thermal alloys, but transits to a power law at γ>γ_{c} in athermal ones. The algebraic exponent is around -1 for the decay inside shear bands, consistent with the theoretical prediction in random elastic media. We quantify the anisotropic correlation with harmonic projection, finding the spectrum is weak in the exponential-decay regime, while it displays a strong polar and quadrupolar symmetry in the power-law regime. The nonvanishing quadrupolar symmetry at long distance signifies the nonlocality of plastic correlation in the athermal alloys. In contrast, the plastic correlation was found to be isotropic and localized at the yielding in the thermal alloys without shear bands. read less USED (low confidence) P.-wei Wang, M.-fei Li, B. Malomo, and L. Yang, “Neutron irradiation-induced rejuvenation in ZrCu metallic glass,” Journal of Materials Science. 2022. link Times cited: 1 USED (low confidence) X. Lu et al., “Severe deformation-induced microstructural heterogeneities in Cu64Zr36 metallic glass,” Modelling and Simulation in Materials Science and Engineering. 2022. link Times cited: 4 Abstract: Deformation-induced rejuvenation is a promising strategy to … read moreAbstract: Deformation-induced rejuvenation is a promising strategy to improve the macroscopic plasticity of metallic glasses (MGs). Here, molecular dynamics simulations are performed to investigate the rejuvenated MGs’ atomic structure and mechanical behavior with high-pressure torsion (HPT) processing. The HPT induces the formation of soft and hard regions in MGs, which dramatically improves the microstructural heterogeneity. Potential energy, pair distribution function, short-range order, medium-range order, and vibrational behavior in HPT-deformed MGs are characterized. The microstructure of soft regions similar to the configuration slightly above the glass transition temperature can be adjusted by torsion angle, ultimately controlling the transformation of MGs from brittleness to ductility. These findings provide valuable guidelines for the design of MGs with enhanced deformability. read less USED (low confidence) X. Wang, J. Tang, X. Tian, W. Jiang, Q. Wang, and H. Fan, “Molecular dynamics simulations of displacement cascade near precipitate in zirconium alloys,” Nuclear Instruments and Methods in Physics Research Section B: Beam Interactions with Materials and Atoms. 2022. link Times cited: 0 USED (low confidence) V. Astanin, E. Korznikova, D. U. Abdullina, V. Astanin, and S. Dmitriev, “Application of Morse potential function to 2D metallic glass simulation,” Saratov Fall Meeting. 2022. link Times cited: 0 Abstract: The parameters of the Morse potential function for Vit105 Zr… read moreAbstract: The parameters of the Morse potential function for Vit105 Zr-based metallic glass are determined and its applicability for a multicomponent alloys is estimated. It is shown that the selected potential parameters make it possible to obtain an amorphous structure on a two-dimensional lattice and conduct basic research on it. read less USED (low confidence) M. Müser, S. Sukhomlinov, and L. Pastewka, “Interatomic potentials: achievements and challenges,” Advances in Physics: X. 2022. link Times cited: 12 Abstract: ABSTRACT Interatomic potentials approximate the potential en… read moreAbstract: ABSTRACT Interatomic potentials approximate the potential energy of atoms as a function of their coordinates. Their main application is the effective simulation of many-atom systems. Here, we review empirical interatomic potentials designed to reproduce elastic properties, defect energies, bond breaking, bond formation, and even redox reactions. We discuss popular two-body potentials, embedded-atom models for metals, bond-order potentials for covalently bonded systems, polarizable potentials including charge-transfer approaches for ionic systems and quantum-Drude oscillator models mimicking higher-order and many-body dispersion. Particular emphasis is laid on the question what constraints ensue from the functional form of a potential, e.g., in what way Cauchy relations for elastic tensor elements can be violated and what this entails for the ratio of defect and cohesive energies, or why the ratio of boiling to melting temperature tends to be large for potentials describing metals but small for short-ranged pair potentials. The review is meant to be pedagogical rather than encyclopedic. This is why we highlight potentials with functional forms sufficiently simple to remain amenable to analytical treatments. Our main objective is to provide a stimulus for how existing approaches can be advanced or meaningfully combined to extent the scope of simulations based on empirical potentials. Graphical abstract read less USED (low confidence) M. Wakeda, J. Saida, and T. Ichitsubo, “Atomistic study on simultaneous achievement of partial crystallization and rejuvenated glassy structure in thermal process of metallic glasses,” Philosophical Magazine. 2022. link Times cited: 4 Abstract: ABSTRACT The relaxation state and partial crystallization ar… read moreAbstract: ABSTRACT The relaxation state and partial crystallization are crucial factors that affect the material properties of metallic glasses. Rejuvenation induces a less relaxed glass state and hence facilitates the control of the relaxation state. The rejuvenation and crystallization during thermal processing are associated closely with the phase changes of metallic glasses upon heating. Most nanocrystalline metallic glasses formed via conventional thermal annealing have a relaxed glassy matrix. In this molecular dynamics study, we investigate the feasibility of thermal processing to simultaneously realise both partial crystallization and rejuvenation using model alloy system. Dynamic mechanical analyses reveal relaxation behaviours and local deformation features of metallic glasses composed of a crystalline phase and a rejuvenated glass matrix. The crystalline phase increases the macroscopic shear stiffness of the composite model over a wide temperature range, whereas it does not significantly affect the internal friction of the rejuvenated glass matrix. In addition, dispersed nanocrystals suppress the development of sharp and concentrated shear localisation in the rejuvenated glass matrix. The simultaneous adjustment of the relaxation state and crystalline phase in the glass matrix is discussed from a viewpoint of the microstructure design of metallic glasses. read less USED (low confidence) J. Q. Wu, H. P. Zhang, and M. Z. Li, “Common structural basis of short- and long-time relaxation dynamics in metallic glass-forming liquids,” Computational Materials Science. 2022. link Times cited: 1 USED (low confidence) N. Amigo and F. Valencia, “Species Content Effect on the Rejuvenation Degree of CuZr Metallic Glasses Under Thermal-Pressure Treatments,” Metals and Materials International. 2022. link Times cited: 4 USED (low confidence) H. Paudel, T. Jia, C. M. Andolina, W. Saidi, and Y. Duan, “Fundamental Studies of Tritium Formation and Diffusivity in Pure and Defective Zircaloy-4 Getters.” 2021. link Times cited: 0 USED (low confidence) Y. Lü, H. Qin, and C. Guo, “Vortex structure of excitation fields in a supercooled glass-forming liquid and its relationship with relaxations,” Physical Review B. 2021. link Times cited: 0 USED (low confidence) H. Jing, M.-fei Li, P.-wei Wang, B. Malomo, and L. Yang, “Self-healing mechanisms of ZrCu nanocrystalline/amorphous laminated alloy under irradiation,” Materialia. 2021. link Times cited: 4 USED (low confidence) X. Li, L. Zuo, and T. Zhang, “Effect of annealing on crystallization behavior in Cu15Zr85 amorphous film,” Journal of Alloys and Compounds. 2021. link Times cited: 3 USED (low confidence) K. V. Reddy and S. Pal, “Cold-rolling induced residual stress effect on the shock response of crystalline-metallic glass (Cu–CuZr) nanolaminates by molecular dynamics simulation,” Materials Chemistry and Physics. 2021. link Times cited: 8 USED (low confidence) Y. Guan, W. Song, Y. Wang, S. Liu, and Y. Yu, “Dynamic responses in shocked Cu-Zr nanoglasses with gradient microstructure,” International Journal of Plasticity. 2021. link Times cited: 11 USED (low confidence) Y. Zhang, J. Li, Y. Hu, S. Ding, F. Du, and R. Xia, “Mechanical properties and scaling laws of polycrystalline CuZr shape memory alloy,” Journal of Applied Physics. 2021. link Times cited: 5 Abstract: Thanks to their excellent properties such as superelasticity… read moreAbstract: Thanks to their excellent properties such as superelasticity, high hardness, and shape memory effect, polycrystalline shape memory alloys (SMAs) have extensive applications in various engineering fields including automobile, functional materials, and aerospace. Using molecular dynamics simulations, the present paper aims to a systematic study of the fundamental tensile behavior in the nanoscale of polycrystalline B2-CuZr SMAs with mean grain sizes in the range of 6–25 nm. Effects of mean grain size, temperature, and tensile rate on mechanical properties are considered. Our results show that along with the increase in mean grain size came increases in Young's modulus, yield strength, flow stress, and ultimate tensile strength. The development of amorphous regions in the grain cores is the major deformation mode in polycrystalline CuZr SMAs with larger grain sizes, while the grain boundary sliding and grain rotation for smaller grain sizes. Besides, an increased temperature results in mechanical performance degradation and the temperature sensitivity of mechanical properties does not depend on the mean grain size. Our work would lay the groundwork for the optimization of the mechanical properties of polycrystalline SMAs as well as serving as a useful theoretical guideline for their practical engineering applications. read less USED (low confidence) L. Wang and J. Hoyt, “Layering misalignment and negative temperature dependence of interfacial free energy of B2-liquid interfaces in a glass forming system,” Acta Materialia. 2021. link Times cited: 8 USED (low confidence) X. Lu et al., “Control of shear band formation in metallic glasses through introducing nanoscale pores,” Journal of Non-crystalline Solids. 2021. link Times cited: 9 USED (low confidence) D. Hua, Q. Zhou, W. Wang, S. Li, X. Liu, and H. Wang, “Atomic mechanism on the mechanical and tribological performance of amorphous/graphene nanolaminates,” Tribology International. 2021. link Times cited: 8 USED (low confidence) B. Fan, Y. Huang, and M. Li, “Cavity-mediated cooperative shear transformation in metallic glasses,” Journal of Applied Physics. 2021. link Times cited: 1 Abstract: Molecular dynamic simulation was performed to study the corr… read moreAbstract: Molecular dynamic simulation was performed to study the correlation between atomic packing and shear transformation under compressive deformation in apparent elastic regime in CuZr metallic glass. The packing feature of atomic structures was characterized in terms of cavities in metallic glass. It is found that while atoms surrounded by larger cavity volumes, i.e., loosely packed regions, show very small nonaffine displacements, some atoms surrounded by very small cavities, i.e., densely packed regions, undergo very large nonaffine displacement and form cooperative shear transformations with large scale in space. The size of shear transformation zones monotonically increases with decreasing cavity volume. However, shear transformations rarely occur in either densely packed or loosely packed regions with very small probability. In addition, metallic glasses are revealed to possess characteristic cavity volumes around which atoms have more probability to undergo relatively larger nonaffine displacements. It is found that more neighboring atoms together with these central atoms experience cooperative shear transformations. These findings are general in different metallic glasses and provide a general underlying structural basis for different sizes of shear transformation zones observed in previous studies. read less USED (low confidence) X. Y. Wang, S. Feng, L. Qi, W. Gao, and S. Zhang, “Mechanical properties of Cu50Zr50 amorphous/B2-CuZr crystalline composites studied by molecular dynamic method,” Journal of Non-crystalline Solids. 2021. link Times cited: 9 USED (low confidence) A. A. Deshmukh, J. Bhatt, P. Gade, and S. Pal, “Investigation of structural evolution in the Cu–Zr metallic glass at cryogenic temperatures by using molecular dynamics simulations,” Journal of Molecular Modeling. 2021. link Times cited: 7 USED (low confidence) N. Ren, L. Hu, B. Wang, K. Song, and P. Guan, “Structural topological signature of high-temperature non-Arrhenius crossover in metallic glass-forming liquids,” Scripta Materialia. 2021. link Times cited: 5 USED (low confidence) Y.-L. Guan, L. Dai, J. Shao, and W. Song, “Molecular dynamics study on the nanovoid collapse and local deformation in shocked Cu50Zr50 metallic glasses,” Journal of Non-crystalline Solids. 2021. link Times cited: 11 USED (low confidence) Y. Lü, C. Guo, H. Huang, J. A. Gao, H. Qin, and W. H. Wang, “Quantized Aging Mode in Metallic Glass-Forming Liquids,” ChemRN: Metals & Alloys (Topic). 2021. link Times cited: 10 Abstract: Physical aging exhibits complex off-equilibrium dynamics and… read moreAbstract: Physical aging exhibits complex off-equilibrium dynamics and its studies are of particular importance for understanding the nature of glassy state. We investigate the aging process of supercooled Cu50Zr50 glass-forming liquid numerically and theoretically. The relaxation time spectra based on molecular dynamics simulations show that the aging dynamics features the superposition of discrete homogeneous dynamic modes. The visiting probabilities of these modes decay toward slower relaxation regime, which is tuned by aging time from the compressed to the stretched exponential manner. Such multi-mode dynamics is found to be accompanied by the quantized hierarchy of mobile clusters with identical size increment. With this finding, we propose an aging model, which describes the aging dynamics as the aging-dependent weighted average over quantized dynamic modes. The two-time correlation functions associated with aging thus are separated into aging-time dependent factor and aging independent relaxation-time term. The model well predicts the heterogeneous dynamics in aging and equilibration of supercooled metallic liquids, and reveals the intrinsic aspects influencing aging process. read less USED (low confidence) B. Shang, W. Wang, A. L. Greer, and P. Guan, “Atomistic Modelling of Thermal-Cycling Rejuvenation in Metallic Glasses,” Computational Materials Science eJournal. 2020. link Times cited: 32 USED (low confidence) X. Li et al., “Ultrasonic plasticity of metallic glass near room temperature,” Applied Materials Today. 2020. link Times cited: 38 USED (low confidence) L. Tang, G. Ma, H. Liu, W. Zhou, and M. Bauchy, “Bulk Metallic Glasses’ Response to Oscillatory Stress Is Governed by the Topography of the Energy Landscape.,” The journal of physical chemistry. B. 2020. link Times cited: 4 Abstract: When subjected to cyclic loading, bulk metallic glasses tend… read moreAbstract: When subjected to cyclic loading, bulk metallic glasses tend to exhibit fatigue-induced damage. Although fatigue is a key limitation of metallic glasses, its atomic origin remains elusive. Here, based on molecular dynamics simulations, we investigate the response of metallic glasses prepared with varying cooling rates to oscillatory stress. We find that fatigue manifests itself as an accumulation of residual strain, which results from some nonaffine displacement of the atoms. Such local reorganizations are promoted under a high cooling rate. Importantly, we demonstrate that the fatigue-induced dynamics of the atoms is encoded in the topography of the static energy landscape, i.e., before any load is applied. read less USED (low confidence) N. Amigo, F. Urbina, and F. Valencia, “Shear transformation zones structure characterization in Cu50Zr50 metallic glasses under tensile test,” Computational Materials Science. 2020. link Times cited: 10 USED (low confidence) M. Li et al., “Structural mechanism of glass forming ability in Zr-based binary alloys,” Intermetallics. 2020. link Times cited: 1 USED (low confidence) S. Yuan and P. S. Branicio, “Gradient microstructure induced shear band constraint, delocalization, and delayed failure in CuZr nanoglasses,” International Journal of Plasticity. 2020. link Times cited: 26 USED (low confidence) S. Becker, E. Devijver, R. Molinier, and N. Jakse, “Glass-forming ability of elemental zirconium,” Physical Review B. 2020. link Times cited: 7 Abstract: We report large-scale molecular dynamics simulations of the … read moreAbstract: We report large-scale molecular dynamics simulations of the glass formation from the liquid phase and homogeneous nucleation phenomena of pure zirconium. For this purpose, we have built a modified embedded atom model potential in order to reproduce relevant structural, dynamic, and thermodynamic properties from ab initio and experimental data near the melting point. By means of liquid-solid interface simulations, we show that this potential provides a thermodynamic melting temperature and densities of the solid and liquid state in good agreement with experiments. Using melt-quenching simulations with one million atoms, we determine the glass transition from the temperature evolution of the inherent structure energy as well as the nose of the time-temperature-transformation curve located in the deep undercooling regime. We identify the local structural origin of the glass-forming ability as a competition between bcc and fivefold polytetrahedral structures that may represent an impediment of rapid homogeneous nucleation at such high undercoolings. This suggests the ability of single elemental zirconium to form a glass from the melt with cooling rates of at least ${10}^{12}\phantom{\rule{4pt}{0ex}}\mathrm{K}/\mathrm{s}$, compatible with modern experiments. read less USED (low confidence) Q. Zhang, Q. Li, and M. Li, “From deformation localization to melting and chemical segregation in metallic glass nanoparticles under high strain rate,” Journal of Applied Physics. 2020. link Times cited: 0 Abstract: Nanoparticles possess many distinguished properties due to t… read moreAbstract: Nanoparticles possess many distinguished properties due to their small size and unique internal and surface structures. For metallic glass nanoparticles, the small size combined with disordered atomic structure results in many unexpected results, some of which are superior to crystalline particles. This field, however, remains largely unexplored. Here, we report the mechanical and thermomechanical responses caused by the increasing strain rate in metallic glass nanoparticles under compression. The mechanical properties of nanoparticles resemble those of the bulk when the strain rate is below 1010 s−1; above this threshold, the nanoparticle exhibits localized deformation and then melting and even chemical segregation at the contact surface area. We reveal that these unique behaviors are the direct results of the lack of effective energy dissipation mechanisms in the disordered materials that are different from crystalline nanoparticles. read less USED (low confidence) H. P. Zhang, B. Fan, J. Wu, W. Wang, and M. Li, “Universal relationship of boson peak with Debye level and Debye-Waller factor in disordered materials,” Physical Review Materials. 2020. link Times cited: 4 Abstract: Due to the topological disorder, glass displays an anomalous… read moreAbstract: Due to the topological disorder, glass displays an anomalous vibrational density of states beyond the Debye model, i.e., formation of boson peaks, which is fundamental for understanding many glassy physical properties. However, the understanding of the boson peak remains notoriously complex and is a topic of hot debate. Here we report a universal quantitative relation between boson peak intensity and the Debye level of transverse phonons in different glasses, confirming the intrinsic link between boson peaks and transverse phonons. Moreover, an equation is derived for the boson peak intensity and Debye-Waller factor, indicating that boson peaks are fundamentally determined by the Debye-Waller factor. These findings could clarify some controversial issues and reveal a common basis for high-frequency boson peak dynamics $(\ensuremath{\sim}{10}^{12}\phantom{\rule{0.28em}{0ex}}\mathrm{Hz})$, short-time $\ensuremath{\beta}$ processes $({10}^{3}\ensuremath{\sim}{10}^{6}\phantom{\rule{0.28em}{0ex}}\mathrm{Hz})$, and long-time $\ensuremath{\alpha}$ processes $({10}^{\ensuremath{-}4}\ensuremath{\sim}{10}^{3}\phantom{\rule{0.28em}{0ex}}\mathrm{Hz})$ in disordered materials. read less USED (low confidence) W. Wang et al., “High-throughput investigations of configurational-transformation-dominated serrations in CuZr/Cu nanolaminates,” Journal of Materials Science & Technology. 2020. link Times cited: 13 USED (low confidence) B. Cai et al., “Balancing strength and ductility of cylindrical-shaped Cu64Zr36 nanoglass via embedded Cu nanocrystals,” Journal of Non-crystalline Solids. 2020. link Times cited: 3 USED (low confidence) S. Chen et al., “On the formation of shear bands in a metallic glass under tailored complex stress fields,” Journal of Materials Science & Technology. 2020. link Times cited: 22 USED (low confidence) E. Bøjesen, T. Petersen, A. V. Martin, M. Weyland, and A. Liu, “Statistical measures of angular correlations in amorphous materials from electron nano-diffraction in the scanning/transmission electron microscope,” Journal of Physics: Materials. 2020. link Times cited: 6 Abstract: Crystallography employing conventional large-volume diffract… read moreAbstract: Crystallography employing conventional large-volume diffraction has enabled the firm connections between structure and properties and structure and function that have solved many of the most difficult problems in materials science and biology. Disordered materials possess a large variety of local structural arrangements and pose a special challenge for crystallography. Often the local structures and symmetries that are responsible for observed phenomena in structurally complex disordered materials cannot be distinguished from conventional diffraction alone. In this article, we review analytical approaches for understanding local structure and symmetry from angular correlations in limited-volume diffraction patterns of amorphous materials, with a special focus on electron nano-diffraction. We discuss how these angular correlations can be interpreted in the context of dense, disordered, three-dimensional materials probed in a projection geometry and highlight the experimental challenges and considerations. New developments in this field are described whereby these angular correlations are statistically analyzed to probe the symmetry and variety of local structures, transformed to a real-space function that contains the 2-, 3- and 4-body particle correlations, and employed to develop reverse Monte Carlo models with more realistic higher-order correlations. read less USED (low confidence) D.-Q. Doan, T. Fang, and T.-H. Chen, “Nanotribological characteristics and strain hardening of amorphous Cu64Zr36/ crystalline Cu nanolaminates,” Tribology International. 2020. link Times cited: 36 USED (low confidence) H. Li, H. Liu, and H. Peng, “Atomic dynamics under oscillatory shear in metallic glasses,” Journal of Non-crystalline Solids. 2020. link Times cited: 6 USED (low confidence) M. Ghaemi and R. Tavakoli, “Universal correlation between the thermodynamic potentials and some physical quantities of metallic glasses as a function of cooling rate during molecular dynamics simulation,” Journal of Non-crystalline Solids. 2020. link Times cited: 2 USED (low confidence) N. Ren, L. Hu, L. Wang, and P. Guan, “Revealing a hidden dynamic signature of the non-Arrhenius crossover in metallic glass-forming liquids,” Scripta Materialia. 2020. link Times cited: 12 USED (low confidence) M. Wang, H. Liu, J. Li, Q. Jiang, W. Yang, and C. Tang, “Thermal-pressure treatment for tuning the atomic structure of metallic glass Cu-Zr,” Journal of Non-crystalline Solids. 2020. link Times cited: 12 USED (low confidence) D. Hua et al., “Molecular dynamics simulation of nanoindentation on amorphous/amorphous nanolaminates,” Applied Surface Science. 2020. link Times cited: 40 USED (low confidence) Y.-fu Wang, M.-fei Li, and L. Yang, “Element dependence of radiation-induced structural changes in metallic glasses,” Journal of Non-crystalline Solids. 2020. link Times cited: 4 USED (low confidence) D.-Q. Doan, T. Fang, A.-S. Tran, and T.-H. Chen, “High deformation capacity and dynamic shear band propagation of imprinted amorphous Cu50Zr50/crystalline Cu multilayered nanofilms,” Journal of Physics and Chemistry of Solids. 2020. link Times cited: 23 USED (low confidence) Y. Su et al., “The relationship between viscosity and local structure in liquid zirconium via electromagnetic levitation and molecular dynamics simulations,” Journal of Molecular Liquids. 2020. link Times cited: 15 USED (low confidence) J. Mo, B. Shen, W. Yixing, Z. Zhou, B. Sun, and L. Xiubing, “The effect of thermal history on structure and mechanical properties of Cu64Zr36 metallic glass,” Journal of Non-crystalline Solids. 2020. link Times cited: 8 USED (low confidence) F. Xiong, M.-fei Li, B. Malomo, and L. Yang, “Microstructural Evolution in Amorphous-Nanocrystalline ZrCu Alloy Under Neutron Irradiation,” MatSciRN: Other Materials Processing & Manufacturing (Topic). 2020. link Times cited: 20 USED (low confidence) D.-Q. Doan, T. Fang, A.-S. Tran, and T.-H. Chen, “Residual stress and elastic recovery of imprinted Cu-Zr metallic glass films using molecular dynamic simulation,” Computational Materials Science. 2019. link Times cited: 46 USED (low confidence) S. Pal, K. V. Reddy, and C. Deng, “On the role of Cu-Zr amorphous intergranular films on crack growth retardation in nanocrystalline Cu during monotonic and cyclic loading conditions,” Computational Materials Science. 2019. link Times cited: 14 USED (low confidence) C. Kalcher, T. Brink, J. Rohrer, A. Stukowski, and K. Albe, “Elastostatic loading of metallic glass-crystal nanocomposites: Relationship of creep rate and interface energy,” Physical Review Materials. 2019. link Times cited: 4 Abstract: We study the creep behavior of Cu_64Zr_36 glass-crystal nano… read moreAbstract: We study the creep behavior of Cu_64Zr_36 glass-crystal nanocomposites under elastostatic loading conditions in molecular dynamics simulations. By manipulating the glass-crystal interfaces of a precipitation-annealed glass containing Laves-type crystallites, we show that the creep behavior can be tuned. Specifically, we find that for the same microstructure the creep rate scales exponentially with the excess energy in the interfaces, which we raise artificially by disturbing the local short-range order in the atomistic model. The behavior shows analogies to Coble creep in crystalline metals, which depends on grain boundary diffusivity and implicitly on grain boundary energies. read less USED (low confidence) H. Peng et al., “Chemical effect on the structural and dynamical properties in Zr-Ni-Al liquids,” Physical Review B. 2019. link Times cited: 9 Abstract: We develop an embedded-atom method (EAM) model to perform cl… read moreAbstract: We develop an embedded-atom method (EAM) model to perform classical molecular-dynamics computer simulations of a model of Zr-Ni-Al ternary melts, based on the existing binary ones. The EAM potential is validated against a broad range of experimental data for the liquid melt, including both static-structure factors and dynamical data on the mass-transport coefficients. We use our simulation model to address the structural and dynamical changes induced by a systematic replacement of Zr by Al in ${\mathrm{Zr}}_{75\ensuremath{-}x}{\mathrm{Ni}}_{25}{\mathrm{Al}}_{x}\phantom{\rule{4pt}{0ex}}(x=0--30)$ ternary alloys. We find strong chemical-ordering effects exhibited as the locally preferred structure when the Al-concentration ${c}_{\text{Al}}$ is increased. Along with the chemical effects, effective-power-law relations are found between the self-diffusion coefficients in the melts, with an exponent that monotonically decreases with increasing Al concentration. The associated Stokes-Einstein relation between diffusivity and viscosity breaks down at higher temperature upon Al addition. We also address the influence of Al admixture on the vibrational spectrum of the melt. With increasing ${c}_{\text{Al}}$, sound waves move faster, and an optical vibrational mode is found. read less USED (low confidence) V. Turlo and T. Rupert, “Prediction of a wide variety of linear complexions in face centered cubic alloys,” Acta Materialia. 2019. link Times cited: 11 USED (low confidence) F. Puosi and A. Pasturel, “Nucleation kinetics in a supercooled metallic glass former,” Acta Materialia. 2019. link Times cited: 13 USED (low confidence) F. Xiong, M.-fei Li, and L. Yang, “Effective Self-Healing Behavior of Amorphous-Nanocrystalline Alloy Under Neutron Irradiation,” MatSciRN: Other Nanomaterials (Topic). 2019. link Times cited: 4 Abstract: The issue, structural response of the amorphous-nanocrystall… read moreAbstract: The issue, structural response of the amorphous-nanocrystalline alloys (ANA) under neutron irradiation, has been investigated by a series of simulations and calculations. It is found that the irradiation-induced vacancies are fully annihilated by the migration of the phase boundary between the nanocrystal and amorphous or liquid zones. In addition, there is an effective self-recovery in the amorphous zone and in particular the nanocrystal region, because the nanocrystal phase is more competitive than the amorphous phase during quenching. This work reveals a unique and effective structural self-healing mechanism in the ANA materials, and will shed light on the development of new materials with high irradiation resistance. read less USED (low confidence) M. Wakeda and J. Saida, “Heterogeneous structural changes correlated to local atomic order in thermal rejuvenation process of Cu-Zr metallic glass,” Science and Technology of Advanced Materials. 2019. link Times cited: 31 Abstract: ABSTRACT In this study, we investigated the atomistic mechan… read moreAbstract: ABSTRACT In this study, we investigated the atomistic mechanism of structural excitation in a thermal process (thermal rejuvenation) of metallic glass. In a molecular dynamics framework, Cu-Zr metallic glass was rejuvenated by a thermal process composed of an isothermal heat treatment at a temperature above the glass transition temperature , followed by fast cooling. Atomistic analyses of the local rearrangement, potential energy, and geometrical structure revealed structural changes correlating to the local atomic order in the rejuvenation process. In the early stage of the heat treatment for thermal rejuvenation, the structural excitation exhibited spatial heterogeneity at the nanometer scale. More-excited regions (i.e., regions with large atomic non-affine and affine transformations) exhibited low-ordered structures and vice versa, implying that the local structural excitation is significantly correlated with the local atomic order. The structural excitation transitioned from partial to whole as the isothermal process proceeded above . Although rejuvenation decreased the ordered structure, the calculation results suggested the formation of newly ordered local structures and newly disordered local structures correlated to local structural excitations and atomic dynamics in the thermal process. These results indicate that the heterogeneous structure evolution of the rejuvenation process induces a redistribution of the local atomic order in the microstructure of metallic glasses. Graphical abstract read less USED (low confidence) D.-peng Wang, Y.-fu Wang, B. Liao, and L. Yang, “A linear relationship between free volume and annealing temperature in ZrCu metallic glass,” Materials Research Express. 2019. link Times cited: 5 Abstract: In this work, the annealing effect on the microstructure of … read moreAbstract: In this work, the annealing effect on the microstructure of metallic glasses (MGs) was investigated, by using molecular dynamics simulation in a ZrCu model. An approach for calculating free volume was adopted, by which the free volume dependence on the annealing temperature was evaluated. It was found that there was a perfect linear relationship between free volume and the annealing temperature, and that the slope was influenced by the annealing time. This work provides a feasible strategy for estimating free volume in an annealed MG, and an in-depth understanding of the change in free volume induced by annealing. read less USED (low confidence) Y. Cheng et al., “Dynamic and structural heterogeneity in undercooled miscible and immiscible metallic liquid,” Journal of Alloys and Compounds. 2019. link Times cited: 4 USED (low confidence) Y. Lü, Q. Bi, and W. Wang, “Eigenstates of soft-mode vibrational excitations in thin-film metallic glasses,” Physical Review B. 2019. link Times cited: 2 Abstract: The vibrational excitations in ${\mathrm{Cu}}_{50}{\mathrm{Z… read moreAbstract: The vibrational excitations in ${\mathrm{Cu}}_{50}{\mathrm{Zr}}_{50}$ thin-film metallic glasses are investigated using molecular dynamics simulations. A strong density layering parallel to surfaces is formed in the glassy thin films. This layering behavior results in a layerlike arrangement of soft regions through films. The vibrational excitations in the periodic soft layers are proved to be harmonic and in analog y with the simple one-dimensional lattice vibration. A low-frequency and optical-like phonon mode features the soft-mode excitations. The soft-mode excitations enhance the vibrational density of states in the low-frequency side, depending on the softness of layers. Our results provide direct evidence supporting the low-frequency and nonacoustic vibrational excitations of soft domains in glasses. read less USED (low confidence) C. Peng et al., “Deformation behavior of designed dual-phase CuZr metallic glasses,” Materials & Design. 2019. link Times cited: 25 USED (low confidence) C. Ma, S. Suslov, C. Ye, and Y. Dong, “Improving plasticity of metallic glass by electropulsing-assisted surface severe plastic deformation,” Materials & Design. 2019. link Times cited: 24 USED (low confidence) S. Li, L. Pastewka, and P. Gumbsch, “Glass formation by severe plastic deformation of crystalline Cu|Zr nano-layers,” Acta Materialia. 2019. link Times cited: 13 USED (low confidence) F. Puosi and A. Pasturel, “Dynamic slowing-down and crystal nucleation in a supercooled metallic glass former induced by local icosahedral order,” Physical Review Materials. 2019. link Times cited: 5 USED (low confidence) K. V. Reddy, C. Deng, and S. Pal, “Dynamic characterization of shock response in crystalline-metallic glass nanolaminates,” Acta Materialia. 2019. link Times cited: 45 USED (low confidence) S. Feng et al., “Control of shear band dynamics in Cu50Zr50 metallic glass by introducing amorphous-crystalline interfaces,” Journal of Alloys and Compounds. 2019. link Times cited: 35 USED (low confidence) J. Yang, Y. Wang, E. Ma, A. Zaccone, L. Dai, and M. Jiang, “Structural Parameter of Orientational Order to Predict the Boson Vibrational Anomaly in Glasses.,” Physical review letters. 2019. link Times cited: 34 Abstract: It has so far remained a major challenge to quantitatively p… read moreAbstract: It has so far remained a major challenge to quantitatively predict the boson peak, a THz vibrational anomaly universal for glasses, from features in the amorphous structure. Using molecular dynamics simulations of a model Cu_{50}Zr_{50} glass, we decompose the boson peak to contributions from atoms residing in different types of Voronoi polyhedra. We then introduce a microscopic structural parameter to depict the "orientational order," using the vector pointing from the center atom to the farthest vertex of its Voronoi coordination polyhedron. This order parameter represents the most probable direction of transverse vibration at low frequencies. Its magnitude scales linearly with the boson peak intensity, and its spatial distribution accounts for the quasilocalized modes. This correlation is shown to be universal for different types of glasses. read less USED (low confidence) J. Wang, C. Chang, K. Song, L. Wang, and Y. Pan, “Short-range ordering in metallic supercooled liquids and glasses,” Journal of Alloys and Compounds. 2019. link Times cited: 11 USED (low confidence) O. Adjaoud and K. Albe, “Influence of Microstructural Features on the Plastic Deformation Behavior of Metallic Nanoglasses,” MatSciRN: Other Nanomaterials (Topic). 2018. link Times cited: 24 Abstract: We investigate the influence of microstructural properties o… read moreAbstract: We investigate the influence of microstructural properties on the plastic deformation behavior of Cu64 Zr36 nanoglasses by means of molecular dynamics simulations. Two different setups are used to prepare nanoglasses. One sample type is a nanoglass obtained by cold-compaction of chemically homogenous and inhomogenous nanoparticles. The second type is generated by assembling pre-shaped polyhedral cuts from the bulk phase. A detailed analysis of both types of microstructures shows that the volume fraction of interfaces in the particle-derived nanoglasses is significantly higher than in the bulk-derived nanoglasses with the same average grain size. The simulations also reveal a clearly distinct plastic response on uniaxial loading: The particle derived samples do not show a stress drop upon yielding, very little strain localization and no strain softening, whereas the bulk-derived samples exhibit a stress drop, strain softening and large strain localization upon loading. These findings are explained in terms of the different glass-glass interfaces present in both structure types. Our results therefore show that the macroscopic deformation behavior of metallic nanoglasses is intimately linked to the structure and topology of the glass-glass interfaces which in turn depend on the processing route. read less USED (low confidence) X. D. Liu, T. Wang, Y. Ye, J. Qiao, and Y. Yang, “Unusual vortex-like atomic motion observed for viscoelasticity in metallic glass,” Computational Materials Science. 2018. link Times cited: 4 USED (low confidence) M. Ghaemi, R. Tavakoli, and A. Foroughi, “Comparing short–range and medium–range ordering in Cu Zr and Ni Zr metallic glasses – Correlation between structure and glass form ability,” Journal of Non-Crystalline Solids. 2018. link Times cited: 22 USED (low confidence) J. Hoyt, S. Raman, N. Ma, and M. Asta, “Unusual temperature dependence of the solid-liquid interfacial free energy in the Cu-Zr system,” Computational Materials Science. 2018. link Times cited: 21 USED (low confidence) H. N. Pishkenari, F. S. Yousefi, and A. Taghibakhshi, “Determination of surface properties and elastic constants of FCC metals: a comparison among different EAM potentials in thin film and bulk scale,” Materials Research Express. 2018. link Times cited: 22 Abstract: Three independent elastic constants C11, C12, and C44 were c… read moreAbstract: Three independent elastic constants C11, C12, and C44 were calculated and compared using available potentials of eight different metals with FCC crystal structure; Gold, Silver, Copper, Nickel, Platinum, Palladium, Aluminum and Lead. In order to calculate the elastic constants, the second derivative of the energy density of each system was calculated with respect to different directions of strains. Each set of the elastic constants of the metals in bulk scale was compared with experimental results, and the average relative error was for each was calculated and compared with other available potentials. Then, using the Voigt-Reuss-Hill method, approximated values for Young and shear moduli and Poisson’s ratio of the FCC metals in the bulk scale were found for each potential. Furthermore, to observe the surface effects on the metals in nanoscale, surface elastic constants of the thin films of the metals have been calculated. In the study of the thin films of materials in nanoscale, the number of surface atoms is considerable compared to all atoms of the object. This leads to an increase in the surface effects, which influence the elastic properties. By considering this fact and employing related definitions and equations, the properties of the thin films of the metals were calculated, and the surface effects for different crystallographic directions were compared. Subsequently, in some cases, comparisons among characteristics of the metals in the thin film and bulk material were made. read less USED (low confidence) X. J. Liu et al., “Static atomic-scale structural heterogeneity and its effects on glass formation and dynamics of metallic glasses,” Intermetallics. 2018. link Times cited: 9 USED (low confidence) V. Borovikov, M. Mendelev, and A. King, “Effects of Ag and Zr solutes on dislocation emission from Σ11(332)[110] symmetric tilt grain boundaries in Cu: Bigger is not always better,” International Journal of Plasticity. 2018. link Times cited: 22 USED (low confidence) X. Yue, C. Liu, S. Pan, A. Inoue, P. Liaw, and C. Fan, “Effect of cooling rate on structures and mechanical behavior of Cu50Zr50 metallic glass: A molecular-dynamics study,” Physica B: Condensed Matter. 2018. link Times cited: 24 USED (low confidence) C. Tang, K. Laws, and M. Ferry, “Atomistic origin of stress overshoots and serrations in a CuZr metallic glass,” Materialia. 2018. link Times cited: 9 USED (low confidence) Y. Zhao et al., “Interdiffusion behaviors and mechanical properties of Cu-Zr system,” Calphad. 2018. link Times cited: 21 USED (low confidence) M. Sepulveda-Macias, G. Gutiérrez, and F. Lund, “Strain rate and temperature effect on Zr50Cu50 metallic glass under pure shear,” Journal of Physics: Conference Series. 2018. link Times cited: 3 Abstract: We present a molecular dynamics study of the mechanical prop… read moreAbstract: We present a molecular dynamics study of the mechanical properties of Zr50Cu50 glass under pure shear. The samples have 145.200 atoms with dimensions of 40 × 20 × 2 nm in the x, y and z directions, respectively. After quenching, we obtain 3 different systems at temperatures of 10, 50, 300 K. All systems were then subjected to dynamic pure shear at constant shear rates of 2.5×10⁸ s−1, 5×10⁸ s−1 and 2.5×10⁹ s−1. We investigate the changes of mechanical properties as a function of temperature and shear rate, and find that the shear modulus is not sensitive to the changes of the shear rate, but decreases as the temperature rises. Ultimate strength is enhanced at higher shear rates and decreases with temperature. A study of the atomic structure reveals that the low values of ultimate strength are associated with high values of local atomic shear strain. These results are reminiscent of what happens at the jamming transition. read less USED (low confidence) Q. Bi, Y. J. Lü, and W. H. Wang, “Multiscale Relaxation Dynamics in Ultrathin Metallic Glass-Forming Films.,” Physical review letters. 2018. link Times cited: 18 Abstract: The density layering phenomenon originating from a free surf… read moreAbstract: The density layering phenomenon originating from a free surface gives rise to the layerlike dynamics and stress heterogeneity in ultrathin Cu-Zr glassy films, which facilitates the occurrence of multistep relaxations in the timescale of computer simulations. Taking advantage of this condition, we trace the relaxation decoupling and evolution with temperature simply via the intermediate scattering function. We show that the β relaxation hierarchically follows fast and slow modes in films, and there is a β-relaxation transition as the film is cooled close to the glass transition. We provide the direct observation of particle motions responsible for the β relaxation and reveal the dominant mechanism varying from the thermal activated to the cooperative jumps across the transition. read less USED (low confidence) L. Yang, F. Zhang, C. Wang, K. Ho, and A. Travesset, “Implementation of metal-friendly EAM/FS-type semi-empirical potentials in HOOMD-blue: A GPU-accelerated molecular dynamics software,” J. Comput. Phys. 2018. link Times cited: 8 USED (low confidence) C. Wu and C. Hou, “Molecular dynamics analysis of plastic deformation and mechanics of imprinted metallic glass films,” Computational Materials Science. 2018. link Times cited: 23 USED (low confidence) M. Sepulveda-Macias, N. Amigo, and G. Gutiérrez, “Tensile behavior of Cu 50 Zr 50 metallic glass nanowire with a B2 crystalline precipitate,” Physica B-condensed Matter. 2018. link Times cited: 21 USED (low confidence) O. Adjaoud and K. Albe, “Microstructure formation of metallic nanoglasses: Insights from molecular dynamics simulations,” Acta Materialia. 2018. link Times cited: 48 USED (low confidence) C. Tang and P. Harrowell, “Chemical ordering and crystal nucleation at the liquid surface: A comparison of Cu50Zr50 and Ni50Al50 alloys.,” The Journal of chemical physics. 2018. link Times cited: 6 Abstract: We study the influence of the liquid-vapor surface on the cr… read moreAbstract: We study the influence of the liquid-vapor surface on the crystallization kinetics of supercooled metal alloys. While a good glass former, Cu50Zr50, shows no evidence of surface enhancement of crystallization, Ni50Al50 exhibits an increased rate of crystallization due to heterogeneous nucleation at the free liquid surface. The difference in the compositional fluctuations at the interface is proposed as the explanation of the distinction between the two alloys. Specifically, we observe compositional ordering at the surface of Ni50Al50, while the Cu50Zr50 alloy only exhibits a diffuse adsorption of the Cu at the interface. We argue that the general difference in composition susceptibilities at planar surfaces represents an important factor in understanding the difference in the glass forming ability of the two alloys. read less USED (low confidence) C. Kalcher, O. Adjaoud, J. Rohrer, A. Stukowski, and K. Albe, “Reinforcement of nanoglasses by interface strengthening,” Scripta Materialia. 2017. link Times cited: 22 USED (low confidence) H. Fan, X. J. Liu, H. Wang, Y. Wu, and Z. Lu, “Mechanical heterogeneity and its relation with glass-forming ability in Zr-Cu and Zr-Cu-Al metallic glasses,” Intermetallics. 2017. link Times cited: 8 USED (low confidence) Y. Feng et al., “Nanocrystals generated under tensile stress in metallic glasses with phase selectivity.,” Nanoscale. 2017. link Times cited: 3 Abstract: Revealing the mechanism of phase selectivity can provide gui… read moreAbstract: Revealing the mechanism of phase selectivity can provide guidance for controlling crystals with certain phases for special properties. In the present work, nanocrystals of about 2-4 nm diameters with a B2 structure (thermodynamic metastable phase) are generated from CuZr glassy fiber by applying tensile stress at ambient temperature. By combining the ab initio calculations with the molecular dynamics simulations, the stabilities of B2 austenite and B19' martensitic phases under applied tensile stress are compared, and the phase transformation mechanism is revealed. The results show that the B2 structure has a bigger attractive basin, and the phase transition could occur with a larger applied stress during the deformation. Therefore, insights into the higher symmetric B2 nanocrystal with selective nucleation driven under directional stress are provided. read less USED (low confidence) M. Meraj, K. Dutta, R. Bhardwaj, N. Yedla, V. Karthik, and S. Pal, “Influence of Asymmetric Cyclic Loading on Structural Evolution and Deformation Behavior of Cu-5 at.% Zr Alloy: An Atomistic Simulation-Based Study,” Journal of Materials Engineering and Performance. 2017. link Times cited: 2 USED (low confidence) C. Ma et al., “Increasing fracture strength in bulk metallic glasses using ultrasonic nanocrystal surface modification,” Journal of Alloys and Compounds. 2017. link Times cited: 21 USED (low confidence) D. Zhao, H. Zhao, B. Zhu, and S. Wang, “Investigation on hardening behavior of metallic glass under cyclic indentation loading via molecular dynamics simulation,” Applied Surface Science. 2017. link Times cited: 43 USED (low confidence) M. Kozłowski, D. Scopece, J. Janczak-Rusch, L. Jeurgens, R. Abdank-Kozubski, and D. Passerone, “Validation of an Embedded-Atom Copper Classical Potential via Bulk and Nanostructure Simulations,” Diffusion Foundations. 2017. link Times cited: 0 Abstract: The validation of classical potentials for describing multic… read moreAbstract: The validation of classical potentials for describing multicomponent materials in complex geometries and their high temperature structural modifications (disordering and melting) requires to verify both a faithful description of the individual phases and a convincing scheme for the mixed interactions, like it is the case of the embedded atom scheme. The present paper addresses the former task for an embedded atom potential for copper, namely the widely adopted parametrization by Zhou, through application to bulk, surface and nanocluster systems. It is found that the melting point is underestimated by 200 degrees with respect to experiment, but structural and temperature-dependent properties are otherwise faithfully reproduced. read less USED (low confidence) Y. Sato, C. Nakai, M. Wakeda, and S. Ogata, “Predictive modeling of Time-Temperature-Transformation diagram of metallic glasses based on atomistically-informed classical nucleation theory,” Scientific Reports. 2017. link Times cited: 15 USED (low confidence) P. Lü, K. Zhou, X. Cai, and H. Wang, “Thermophysical properties of undercooled liquid Ni-Zr alloys: Melting temperature, density, excess volume and thermal expansion,” Computational Materials Science. 2017. link Times cited: 8 USED (low confidence) S. Pan, S. Feng, J. Qiao, X.-feng Niu, W.-M. Wang, and J. Qin, “Correlation between initial structure and athermal quasi-static compressive deformation in a metallic glass,” Journal of Alloys and Compounds. 2017. link Times cited: 9 USED (low confidence) S. Pan, Z. W. Wu, W.-chao Wang, M. Li, and L. Xu, “Structural origin of fractional Stokes-Einstein relation in glass-forming liquids,” Scientific Reports. 2017. link Times cited: 27 USED (low confidence) M. Jafary-Zadeh, R. Tavakoli, D. Srolovitz, and Y.-W. Zhang, “Thermally induced failure mechanism transition and its correlation with short-range order evolution in metallic glasses,” Extreme Mechanics Letters. 2016. link Times cited: 23 USED (low confidence) S. Uporov, V. Bykov, and S. Estemirova, “Electrical and thermal conductivities of rapidly crystallized Cu-Zr alloys: The effect of anharmonicity,” Physica B-condensed Matter. 2016. link Times cited: 10 USED (low confidence) N. Miyazaki, Y. Lo, M. Wakeda, and S. Ogata, “Properties of high-density, well-ordered, and high-energy metallic glass phase designed by pressurized quenching,” Applied Physics Letters. 2016. link Times cited: 13 Abstract: We applied gigapascal-level compressive hydrostatic pressure… read moreAbstract: We applied gigapascal-level compressive hydrostatic pressure to the melt-quenching process of metallic glass to obtain a unique high-pressure glass state with high density that is well-ordered yet has high energy. This state contradicts the common understanding that high-density, well-ordered metallic glass states have low energy. Through molecular dynamics simulations, we found that the high-pressure glass state of the metallic glass Zr50Cu40Al10 has a rich anti-free volume and that its relaxation is dominated by the annihilation of full icosahedra and the rich anti-free volume. The aging rate of the high-pressure metallic glass state (energy reduction rate) is almost the same as that of typical high-energy metallic glass, suggesting that it has a lifetime similar to that of a typical high-energy metallic glass that has been experimentally realized and reported previously [Wakeda et al., Sci. Rep. 5, 10545 (2015)]. Thus, the high-pressure phase can be realized even under the experimental cooling rate, su... read less USED (low confidence) M. Yang, Y. Li, J. Li, and B. Liu, “Retraction: Atomic-scale simulation to study the dynamical properties and local structure of Cu-Zr and Ni-Zr metallic glass-forming alloys.,” Physical chemistry chemical physics : PCCP. 2016. link Times cited: 2 Abstract: Retraction of 'Atomic-scale simulation to study the dyn… read moreAbstract: Retraction of 'Atomic-scale simulation to study the dynamical properties and local structure of Cu-Zr and Ni-Zr metallic glass-forming alloys' by M. H. Yang et al., Phys. Chem. Chem. Phys., 2016, 18, 7169-7183. read less USED (low confidence) O. Adjaoud and K. Albe, “Interfaces and interphases in nanoglasses: Surface segregation effects and their implications on structural properties,” Acta Materialia. 2016. link Times cited: 47 USED (low confidence) N. Miyazaki, M. Wakeda, Y. Wang, and S. Ogata, “Prediction of pressure-promoted thermal rejuvenation in metallic glasses.” 2016. link Times cited: 62 USED (low confidence) Y. Ye, X. D. Liu, S. C. Wang, J. Fan, C. Liu, and Y. Yang, “The kinetic origin of delayed yielding in metallic glasses,” Applied Physics Letters. 2016. link Times cited: 8 Abstract: Recent experiments showed that irreversible structural chang… read moreAbstract: Recent experiments showed that irreversible structural change or plasticity could occur in metallic glasses (MGs) even within the apparent elastic limit after a sufficiently long waiting time. To explain this phenomenon, a stochastic shear transformation model is developed based on a unified rate theory to predict delayed yielding in MGs, which is validated afterwards through extensive atomistic simulations carried out on different MGs. On a fundamental level, an analytic framework is established in this work that links time, stress, and temperature altogether into a general yielding criterion for MGs. read less USED (low confidence) S. M. Rassoulinejad-Mousavi, Y. Mao, and Y. Zhang, “Evaluation of Copper, Aluminum and Nickel Interatomic Potentials on Predicting the Elastic Properties,” arXiv: Computational Physics. 2016. link Times cited: 63 Abstract: Choice of appropriate force field is one of the main concern… read moreAbstract: Choice of appropriate force field is one of the main concerns of any atomistic simulation that needs to be seriously considered in order to yield reliable results. Since, investigations on mechanical behavior of materials at micro/nanoscale has been becoming much more widespread, it is necessary to determine an adequate potential which accurately models the interaction of the atoms for desired applications. In this framework, reliability of multiple embedded atom method based interatomic potentials for predicting the elastic properties was investigated. Assessments were carried out for different copper, aluminum and nickel interatomic potentials at room temperature which is considered as the most applicable case. Examined force fields for the three species were taken from online repositories of National Institute of Standards and Technology (NIST), as well as the Sandia National Laboratories, the LAMMPS database. Using molecular dynamic simulations, the three independent elastic constants, C11, C12 and C44 were found for Cu, Al and Ni cubic single crystals. Voigt-Reuss-Hill approximation was then implemented to convert elastic constants of the single crystals into isotropic polycrystalline elastic moduli including Bulk, Shear and Young's modulus as well as Poisson's ratio. Simulation results from massive molecular dynamic were compared with available experimental data in the literature to justify the robustness of each potential for each species. Eventually, accurate interatomic potentials have been recommended for finding each of the elastic properties of the pure species. Exactitude of the elastic properties was found to be sensitive to the choice of the force fields. Those potentials were fitted for a specific compound may not necessarily work accurately for all the existing pure species. read less USED (low confidence) F. Delogu, “Thermal and mechanical activation of inelastic events in metallic glasses,” Scripta Materialia. 2016. link Times cited: 6 USED (low confidence) Y. Zhao, X. Wei, Y. Zhang, F. Wu, and D. Huo, “Investigation on Cutting Force and Temperature of Cutting Cu50Zr50 Metallic Glass by Molecular Dynamics Simulation,” Key Engineering Materials. 2015. link Times cited: 4 Abstract: Metallic glasses have a variety of excellent properties comp… read moreAbstract: Metallic glasses have a variety of excellent properties compared with the majority of conventional crystalline alloys, and have a broad application prospects in the military, aerospace and sports equipment. Cutting, as an efficient and high-precision machining process, is expected to be an important processing method for metallic glasses. Currently, investigation on cutting metallic glasses is in a nascent stage. Although the machining precision of several tens of nanometers has been achieved, its cutting mechanism remains unclear. In this paper, a molecular dynamics simulation of orthogonal nanometric cutting of metallic glass Cu50Zr50 was carried out.The material deformation, cutting force, and workpiece temperature distribution were studied at microscopic scale. It is found that the deformation accumulation first occurred on the tool rake face. Then with the cutting progressing, materials underwent stable plastic deformation in the shear zone. Analysis on cutting force shows that in the initial material deformation process the cutting force increases rapidly until the cutting process is stabilized, , and then it is reduced to a stable value. Finally, the temperature change of the workpiece during cutting was calculated, and the result shows that the maximum temperature reaches the glass transition temperature. Further, the radial distribution function analysis of workpiece was used to confirm the occurrence of the glass transition. read less USED (low confidence) Y.-C. Hu, F. Li, M. Li, H. Bai, and W.-chao Wang, “Five-fold symmetry as indicator of dynamic arrest in metallic glass-forming liquids,” Nature Communications. 2015. link Times cited: 190 USED (low confidence) D. Z. Chen et al., “Fractal atomic-level percolation in metallic glasses,” Science. 2015. link Times cited: 103 Abstract: Percolating cluster, factal structure Metallic glasses are a… read moreAbstract: Percolating cluster, factal structure Metallic glasses are appealing materials because they are strong and can bend without breaking. These materials are disordered but possess none of the defects seen in crystalline counterparts. Chen et al. developed a model for metallic glasses in which clusters of atoms float free in the liquid, begin to jam, and finally organize into a short-range fractal structure below the glass transition temperature. This model also accounted for the density and high strength characteristics of bulk samples. Science, this issue p. 1306 X-ray diffraction experiments and simulations show a crossover from fractal to homogeneous structure in metallic glasses. Metallic glasses are metallic alloys that exhibit exotic material properties. They may have fractal structures at the atomic level, but a physical mechanism for their organization without ordering has not been identified. We demonstrated a crossover between fractal short-range (<2 atomic diameters) and homogeneous long-range structures using in situ x-ray diffraction, tomography, and molecular dynamics simulations. A specific class of fractal, the percolation cluster, explains the structural details for several metallic-glass compositions. We postulate that atoms percolate in the liquid phase and that the percolating cluster becomes rigid at the glass transition temperature. read less USED (low confidence) W. Song, S.-jin Zhao, and G. Wang, “Mechanisms of metastable states in CuZr systems with glass-like structures.,” The Journal of chemical physics. 2015. link Times cited: 3 Abstract: The local structural inhomogeneity of glasses, as evidenced … read moreAbstract: The local structural inhomogeneity of glasses, as evidenced from broad bond-length distributions (BLDs), has been widely observed. However, the relationship between this particular structural feature and metastable states of glassy solids is poorly understood. It is important to understand the main problems of glassy solids, such as the plastic deformation mechanisms and glass-forming ability. The former is related to β-relaxation, the relaxation of a system from a subbasin to another in the potential energy landscape (PEL). The latter represents the stability of a metastable state in the PEL. Here, we explain the main reason why CuZr systems with glass-like structures exist in metastable states: a large strain energy. The calculation results obtained in this study indicate that a system with broad BLD has a large strain energy because of the nonlinear and asymmetric strain energy of bonds. Unstable polyhedra have larger volumes and more short and long bonds than stable polyhedra, which are most prone to form deformation units. The driving force for pure metal crystallization was also elucidated to be the decrease in strain energy. The results obtained in this study, which are verified by a series of calculations as well as molecular dynamics simulations, indicate the presence of metastable states in amorphous materials and elucidate the mechanisms of plastic deformation and the driving force for crystallization without chemical bonding. read less USED (low confidence) A. C. Y. Liu, G. Lumpkin, T. Petersen, J. Etheridge, and L. Bourgeois, “Interpretation of angular symmetries in electron nanodiffraction patterns from thin amorphous specimens.,” Acta crystallographica. Section A, Foundations and advances. 2015. link Times cited: 14 Abstract: The interpretation of angular symmetries in electron nanodif… read moreAbstract: The interpretation of angular symmetries in electron nanodiffraction patterns from thin amorphous specimens is examined. It is found that in general there are odd symmetries in experimental electron nanodiffraction patterns. Using simulation, it is demonstrated that this effect can be attributed to dynamical scattering, rather than other divergences from the ideal experimental conditions such as probe-forming lens aberrations and camera noise. The departure of opposing diffracted intensities from Friedel's law in the phase grating formalism is calculated using a general structure factor for disordered materials. On the basis of this, a simple correction procedure is suggested to recover the kinematical angular symmetries, and thus readily interpretable information that reflects the symmetries of the original projected object. This correction is numerically tested using both the phase object and multislice calculations, and is demonstrated to fully recover all the kinematical diffracted symmetries from a simulated atomic model of a metallic glass. read less USED (low confidence) P. Thurnheer, R. Maaß, K. Laws, S. Pogatscher, and J. F. Löffler, “Dynamic properties of major shear bands in Zr-Cu-Al bulk metallic glasses,” Acta Materialia. 2015. link Times cited: 27 USED (low confidence) S. Feng et al., “Atomic structure of shear bands in Cu64Zr36 metallic glasses studied by molecular dynamics simulations,” Acta Materialia. 2015. link Times cited: 98 USED (low confidence) S. Amokrane, A. Ayadim, and L. Levrel, “Structure of the glass-forming metallic liquids by ab-initio and classical molecular dynamics, a case study: Quenching the Cu60Ti20Zr20 alloy,” Journal of Applied Physics. 2015. link Times cited: 9 Abstract: We consider the question of the amorphization of metallic al… read moreAbstract: We consider the question of the amorphization of metallic alloys by melt quenching, as predicted by molecular dynamics simulations with semi-empirical potentials. The parametrization of the potentials is discussed on the example of the ternary Cu-Ti-Zr transition metals alloy, using the ab-initio simulation as a reference. The pair structure in the amorphous state is computed from a potential of the Stillinger-Weber form. The transferability of the parameters during the quench is investigated using two parametrizations: from solid state data, as usual and from a new parametrization on the liquid structure. When the adjustment is made on the pair structure of the liquid, a satisfactory transferability is found between the pure components and their alloys. The liquid structure predicted in this way agrees well with experiment, in contrast with the one obtained using the adjustment on the solid. The final structure, after quenches down to the amorphous state, determined with the new set of parameters is show... read less USED (low confidence) L. Meng, L. Wang, S. Wang, and Y. Qi, “Relating glass formation to eutectic composition in Cu100-xZrx alloy by molecular dynamics simulation,” Physics and Chemistry of Liquids. 2015. link Times cited: 1 Abstract: The relationship between eutectic compositions and glass-for… read moreAbstract: The relationship between eutectic compositions and glass-forming ability (GFA) in Cu100-xZrx (x = 8–83) system is studied by molecular dynamic (MD) simulation based on the embedded atom method (EAM). Local maxima of GFA occur in Cu56Zr44, Cu47Zr53 and Cu31Zr69 alloys, close to eutectic points in Cu-Zr binary phase diagram. The structural parameters indicate that the heterogeneous Cu-Zr pairs exhibit stronger and more stable interaction than that of homogeneous pairs. The small peak with a negative amplitude ahead of the main peak in SCuZr(Q) also implies the preference of Cu-Zr pairs. The avoidance of Cu-Cu neighbours and Zr-Zr neighbours, which correspond to the prepeak prior to the main peak of SCuCu(Q) and SZrZr(Q), leads to structural order on intermediate length scales. Perfect and defect icosahedra constitute medium range order (MRO) clusters by sharing atoms, which promotes the glass formation. read less USED (low confidence) H. Zhang et al., “Role of string-like collective atomic motion on diffusion and structural relaxation in glass forming Cu-Zr alloys.,” The Journal of chemical physics. 2015. link Times cited: 84 Abstract: We investigate Cu-Zr liquid alloys using molecular dynamics … read moreAbstract: We investigate Cu-Zr liquid alloys using molecular dynamics simulation and well-accepted embedded atom method potentials over a wide range of chemical composition and temperature as model metallic glass-forming (GF) liquids. As with other types of GF materials, the dynamics of these complex liquids are characterized by "dynamic heterogeneity" in the form of transient polymeric clusters of highly mobile atoms that are composed in turn of atomic clusters exhibiting string-like cooperative motion. In accordance with the string model of relaxation, an extension of the Adam-Gibbs (AG) model, changes in the activation free energy ΔGa with temperature of both the Cu and Zr diffusion coefficients D, and the alpha structural relaxation time τα can be described to a good approximation by changes in the average string length, L. In particular, we confirm that the strings are a concrete realization of the abstract "cooperatively rearranging regions" of AG. We also find coexisting clusters of relatively "immobile" atoms that exhibit predominantly icosahedral local packing rather than the low symmetry packing of "mobile" atoms. These two distinct types of dynamic heterogeneity are then associated with different fluid structural states. Glass-forming liquids are thus analogous to polycrystalline materials where the icosahedrally packed regions correspond to crystal grains, and the strings reside in the relatively disordered grain boundary-like regions exterior to these locally well-ordered regions. A dynamic equilibrium between localized ("immobile") and wandering ("mobile") particles exists in the liquid so that the dynamic heterogeneity can be considered to be type of self-assembly process. We also characterize changes in the local atomic free volume in the course of string-like atomic motion to better understand the initiation and propagation of these fluid excitations. read less USED (low confidence) S. Wang, Y. Ye, B. Sun, C. Liu, S. Shi, and Y. Yang, “Softening-induced plastic flow instability and indentation size effect in metallic glass,” Journal of The Mechanics and Physics of Solids. 2015. link Times cited: 36 USED (low confidence) A. Kumar and N. Yedla, “Mechanical and structure studies of Zr50Cu50 glass matrix composites during nano-indentation-a molecular dynamics study,” IOP Conference Series: Materials Science and Engineering. 2015. link Times cited: 1 Abstract: In this paper we report molecular dynamics simulations of na… read moreAbstract: In this paper we report molecular dynamics simulations of nano-indentation on Zr50Cu50 metallic glass matrix composite (14% crystalline volume fraction) at various strain rates. The objective of this paper is to investigate the effect of strain rate on the deformation behaviour and understand the deformation mechanism during deformation. Structural analysis during deformation is done by centro-symmetry parameter (CSP) studies. The load- displacement plots are drawn for the loading portion of indentation to analyze the deformation behaviour. It is found that strain rate has significant effect on the nature of the load- displacement plot. With increasing strain rate serrations decreased and flat load-displacement regime is observed with progress of indentation (~10 Å) at strain rate of 1 × 10¹¹s−1. This could be due to atoms getting less time to get rearranged themselves so as to bear further load. Also, the structure studies by CSP indicated that, at low strain rates (2 × 10¹⁰s−1 and 5 × 10¹⁰s−1) there is significant plastic deformation of the crystallite as compared to that at higher strain rate value of 1 × 10¹¹s−1 at a particular indentation depth. This indicates that there is load transfer from the glassy matrix to the crystallite much earlier at low strain rates. However, at indentation depths of 20 Å at all the strain rates amorphization of the crystallite is observed. read less USED (low confidence) P. Zhu, C. Qiu, F. Fang, D. Yuan, and X. Shen, “Molecular dynamics simulations of nanometric cutting mechanisms of amorphous alloy,” Applied Surface Science. 2014. link Times cited: 84 USED (low confidence) C. Yu, X. J. Liu, and C. Liu, “First-principles prediction of the glass-forming ability in Zr–Ni binary metallic glasses,” Intermetallics. 2014. link Times cited: 8 USED (low confidence) C. Qiu, P. Zhu, F. Fang, D. Yuan, and X. Shen, “Study of nanoindentation behavior of amorphous alloy using molecular dynamics,” Applied Surface Science. 2014. link Times cited: 96 USED (low confidence) J. Ding, Y. Q. Cheng, and E. Ma, “Full icosahedra dominate local order in Cu64Zr34 metallic glass and supercooled liquid,” Acta Materialia. 2014. link Times cited: 231 USED (low confidence) F. Zhang, M. Mendelev, Y. Zhang, C. Wang, M. Kramer, and K. Ho, “Effects of sub-Tg annealing on Cu64.5Zr35.5 glasses: A molecular dynamics study,” Applied Physics Letters. 2014. link Times cited: 52 Abstract: Creating metallic glasses by cooling liquid melts in molecul… read moreAbstract: Creating metallic glasses by cooling liquid melts in molecular dynamics simulations faces a well-known challenge that the cooling rate is too fast compared with experiments. Taking the prototypical Cu64.5Zr35.5 glasses as an example, we propose an efficient cooling strategy in which most of the computer time is spent on a prolonged isothermal process slightly below the glass-transition temperature, Tg. The glassy sample prepared in this way demonstrates significant energetic stability, slow dynamics, and well-developed short-range icosahedral order. By conventional uniform cooling, similar properties can only be obtained using a cooling rate more than 15 times slower. read less USED (low confidence) N. Mauro et al., “Anomalous structural evolution and liquid fragility signatures in Cu-Zr and Cu-Hf liquids and glasses,” Acta Materialia. 2013. link Times cited: 20 USED (low confidence) C. Tang and P. Harrowell, “Anomalously slow crystal growth of the glass-forming alloy CuZr.,” Nature materials. 2013. link Times cited: 178 USED (low confidence) A. C. Y. Liu et al., “Systematic mapping of icosahedral short-range order in a melt-spun Zr36Cu64 metallic glass.,” Physical review letters. 2013. link Times cited: 76 Abstract: By analyzing the angular correlations in scanning electron n… read moreAbstract: By analyzing the angular correlations in scanning electron nanodiffraction patterns from a melt-spun Zr(36)Cu(64) glass, the dominant local order was identified as icosahedral clusters. Mapping the extent of this icosahedral short-range order demonstrates that the medium-range order in this material is consistent with a face-sharing or interpenetrating configuration. These conclusions support results from atomistic modeling and a structural basis for the glass formability of this system. read less USED (low confidence) Q. An, S. Luo, W. Goddard, W. Han, B. Arman, and W. Johnson, “Synthesis of single-component metallic glasses by thermal spray of nanodroplets on amorphous substrates,” Applied Physics Letters. 2012. link Times cited: 23 Abstract: We show that single component metallic glasses can be synthe… read moreAbstract: We show that single component metallic glasses can be synthesized by thermal spray coating of nanodroplets onto an amorphous substrate. We demonstrate this using molecular dynamics simulations of nanodroplets up to 30 nm that the spreading of the nanodroplets during impact on a substrate leads to sufficiently rapid cooling (1012–1013 K/s) sustained by the large temperature gradients between the thinned nanodroplets and the bulk substrate. However, even under these conditions, in order to ensure that the glass transition outruns crystal nucleation, it is essential that the substrate be amorphous (eliminating sites for heterogeneous nucleation of crystallization). read less USED (low confidence) K. Park, H. Park, and E. Fleury, “Strain localization in annealed Cu50Zr50 metallic glass,” Materials Science and Engineering A-structural Materials Properties Microstructure and Processing. 2011. link Times cited: 7 USED (low confidence) J. Fan, “Basics of Atomistic Simulation.” 2010. link Times cited: 1 USED (low confidence) C. Valencia-Balvín, C. Loyola, J. Osorio-Guillén, and G. Gutiérrez, “Structural and dynamical properties of the Cu46Zr54 alloy in crystalline, amorphous and liquid state: A molecular dynamicstudy,” Physica B-condensed Matter. 2010. link Times cited: 6 USED (low confidence) S. Wu, C. Wang, S. Hao, Z.-zhong Zhu, and K. Ho, “Energetics of local clusters in Cu64.5Zr35.5 metallic liquid and glass,” Applied Physics Letters. 2010. link Times cited: 53 Abstract: Correlation between the cluster energy and its population an… read moreAbstract: Correlation between the cluster energy and its population and dynamics can provide a better understanding of the complicated energy landscape of disordered metallic systems. We propose a method to analyze the cluster energy distribution for different kinds of short-range order (local clusters) in liquid and glass systems. By applying this analysis to an interesting and important glass forming system— Cu 64.5 Zr 35.5 we observe a direct correlation between the energy and dynamics of the cluster in this realistic glass-forming system. This study suggests that dynamic arrest originates from the environment-dependent energetics of local clusters. read less USED (low confidence) M. Mendelev and M. Kramer, “Reliability of methods of computer simulation of structure of amorphous alloys,” Journal of Applied Physics. 2010. link Times cited: 16 Abstract: We took a model created by the molecular dynamics (MD) simul… read moreAbstract: We took a model created by the molecular dynamics (MD) simulation with a semiempirical potential as a target system and explored how its amorphous structure and a few other properties depend on the simulation method. We found that if the cooling rate is too high, 1013–1014 K/s, the system has no time to adjust its structure to the change in temperature/density. Since this cooling corresponds to a typical ab initio MD simulation, this brings into doubt that an equilibrium glass structure can be obtained using ab initio MD simulation. We also used the target partial pair correlation functions (PPCFs) to explore a possibility to create the atomic models from diffraction data alone. We were able to create models with the PPCFs, which nearly coincided with the target ones. Nevertheless, we found that the potential energy of the quenched states and the distribution of the Voronoi polyhedra in the models created from PPCFs were different than the target quantities. This study shows that reverse Monte Carlo techn... read less USED (low confidence) J. Zhang, M. Zhang, X. Wang, and M. Li, “Gradient network architecture design induced strain delocalization and delayed failure in metallic glass matrix composites,” Scripta Materialia. 2023. link Times cited: 0 USED (low confidence) D. Hua et al., “Molecular dynamics simulation of the tribological performance of amorphous/amorphous nano-laminates,” Journal of Materials Science & Technology. 2022. link Times cited: 23 USED (low confidence) Y. Xiao, X. Kong, B. Yao, D. Legut, T. Germann, and R. Zhang, “Atomistic insight into the dislocation nucleation at crystalline/crystalline and crystalline/amorphous interfaces without full symmetry,” Acta Materialia. 2019. link Times cited: 16 USED (low confidence) С. Волегов, Р. М. Герасимов, and Р. П. Давлятшин, “MODELS OF MOLECULAR DYNAMICS: A REVIEW OF EAM-POTENTIALS. PART 2. POTENTIALS FOR MULTI-COMPONENT SYSTEMS.” 2018. link Times cited: 1 Abstract: Получена: 18 мая 2018 г. Принята: 25 июня 2018 г. Опубликова… read moreAbstract: Получена: 18 мая 2018 г. Принята: 25 июня 2018 г. Опубликована: 29 июня 2018 г. В статье представлена вторая часть обзора современных подходов и работ, посвященных построению потенциалов межатомного взаимодействия с использованием методологии погруженного атома (EAM-потенциалы). Эта часть обзора посвящена одной из наиболее остро стоящих проблем в молекулярной динамике – вопросам построения потенциалов, которые были бы пригодны для описания структуры и физико-механических свойств многокомпонентных (в первую очередь – бинарных и тернарных) материалов. Отмечены первые работы, в которых предлагались подходы к построению функций перекрестного взаимодействия для сплавов никеля и меди – как с использованием методологии EAM, так и несколько отличающийся по процедуре построения потенциал типа Финисса-Синклера. Рассматриваются работы, в которых производится сопоставление различных подходов к построению потенциалов, а также к процедуре идентификации их параметров на примере одних и тех же многокомпонентных систем (типа Al-Ni или Cu-Au). Кроме того, особый интерес представляют некоторые тернарные системы, например Fe–Ni–Cr, W–H– He или U–Mo–Xe, которые являются ключевыми для материалов атомной энергетики и которые в последние годы активно изучаются как возможные материалы для использования в термоядерных ректорах. Приведены примеры работ, в которых предлагаются и исследуются потенциалы для описания многокомпонентных систем, пригодных для использования в аэрокосмической промышленности и изготовленных прежде всего на основе никеля. Рассмотрены результаты исследований различных интерметаллических соединений, отмечены работы, в которых при помощи построенного EAM потенциала удалось количественно точно описать фазовые диаграммы соединений и вычислить характеристики фазовых переходов. read less USED (low confidence) E. Alishahi and C. Deng, “Orientation dependent plasticity of metallic amorphous-crystalline interface,” Computational Materials Science. 2018. link Times cited: 25 USED (low confidence) Y. Ye, S. D. Wang, J. Fan, C. Liu, and Y. Yang, “Atomistic mechanism of elastic softening in metallic glass under cyclic loading revealed by molecular dynamics simulations,” Intermetallics. 2016. link Times cited: 25 USED (low confidence) M. Blodgett, “Thermophysical Properties and Structural Evolution of Supercooled Metallic Liquids.” 2015. link Times cited: 1 USED (low confidence) R. Soklaski, “A Molecular Dynamics Study of the Structure-Dynamics Relationships of Supercooled Liquids and Glasses.” 2015. link Times cited: 1 Abstract: OF THE DISSERTATION ix Chapter 1: Introduction 1 1.1 An Over… read moreAbstract: OF THE DISSERTATION ix Chapter 1: Introduction 1 1.1 An Overview of Supercooling and the Glass Transition 1 1.2 Two-Step Relaxation processes Near TG 4 1.3 Theories of Supercooled Liquids and Glasses 9 1.3.1 Mode-Coupling Theory & p-spin Models 9 1.3.2 Goldstein Activated Dynamics 13 1.3.3 AGDM Theory & Random First-Order Transition Theory 15 1.3.4 Frustration & Avoided Criticality 19 1.4 Crossover Behavior at TA & Structural Cooperativity 23 1.4.1 Solid-like Features of a Liquid Below TA 23 1.4.2 The Onset of Cooperative Dynamics at TA 24 1.4.3 Surprising Empirical Results Regarding TA, FLDT, & Cooperativity 26 1.4.4 A Computational Approach to Studying TA 28 1.5 Chapter 1 References 30 Chapter 2: Dynamical Regimes of Fragile Liquids 36 read less USED (low confidence) C. Tackes, “Thermal analysis of undercooled metallic liquids by electromagnetic levitation drop calorimetry.” 2013. link Times cited: 2 Abstract: . . . . . . . . . . . . . . . . . . . . . . . . . . . . . . … read moreAbstract: . . . . . . . . . . . . . . . . . . . . . . . . . . . . . . . . . . . . . . . xvi CHAPTER read less NOT USED (low confidence) H. Liu et al., “Learning molecular dynamics: predicting the dynamics of glasses by a machine learning simulator.,” Materials horizons. 2023. link Times cited: 1 Abstract: Many-body dynamics of atoms such as glass dynamics is genera… read moreAbstract: Many-body dynamics of atoms such as glass dynamics is generally governed by complex (and sometimes unknown) physics laws. This challenges the construction of atom dynamics simulations that both (i) capture the physics laws and (ii) run with little computation cost. Here, based on graph neural network (GNN), we introduce an observation-based graph network (OGN) framework to "bypass all physics laws" to simulate complex glass dynamics solely from their static structure. By taking the example of molecular dynamics (MD) simulations, we successfully apply the OGN to predict atom trajectories evolving up to a few hundred timesteps and ranging over different families of complex atomistic systems, which implies that the atom dynamics is largely encoded in their static structure in disordered phases and, furthermore, allows us to explore the capacity of OGN simulations that is potentially generic to many-body dynamics. Importantly, unlike traditional numerical simulations, the OGN simulations bypass the numerical constraint of small integration timestep by a multiplier of ≥5 to conserve energy and momentum until hundreds of timesteps, thus leapfrogging the execution speed of MD simulations for a modest timescale. read less NOT USED (low confidence) Z. Trautt, F. Tavazza, and C. Becker, “Facilitating the selection and creation of accurate interatomic potentials with robust tools and characterization,” Modelling and Simulation in Materials Science and Engineering. 2015. link Times cited: 14 Abstract: The Materials Genome Initiative seeks to significantly decre… read moreAbstract: The Materials Genome Initiative seeks to significantly decrease the cost and time of development and integration of new materials. Within the domain of atomistic simulations, several roadblocks stand in the way of reaching this goal. While the NIST Interatomic Potentials Repository hosts numerous interatomic potentials (force fields), researchers cannot immediately determine the best choice(s) for their use case. Researchers developing new potentials, specifically those in restricted environments, lack a comprehensive portfolio of efficient tools capable of calculating and archiving the properties of their potentials. This paper elucidates one solution to these problems, which uses Python-based scripts that are suitable for rapid property evaluation and human knowledge transfer. Calculation results are visible on the repository website, which reduces the time required to select an interatomic potential for a specific use case. Furthermore, property evaluation scripts are being integrated with modern platforms to improve discoverability and access of materials property data. To demonstrate these scripts and features, we will discuss the automation of stacking fault energy calculations and their application to additional elements. While the calculation methodology was developed previously, we are using it here as a case study in simulation automation and property calculations. We demonstrate how the use of Python scripts allows for rapid calculation in a more easily managed way where the calculations can be modified, and the results presented in user-friendly and concise ways. Additionally, the methods can be incorporated into other efforts, such as openKIM. read less NOT USED (high confidence) R. Forrest, E. Lazar, S. Goel, and J. J. Bean, “Quantifying the differences in properties between polycrystals containing planar and curved grain boundaries,” Nanofabrication. 2022. link Times cited: 0 Abstract: There are several methods in which grain boundaries can be m… read moreAbstract: There are several methods in which grain boundaries can be made for modelling, but most produce planar (flat) grains. In this study, we investigated the difference in materials properties between polycrystalline systems comprised of planar grain and curved grain boundaries. Several structural and mechanical properties for both systems were determined. For systems with curved grain boundaries, it was found that the elastic moduli are all larger in magnitude, the excess volumes are comparable, and the plastic properties are smaller. In addition, a grain tracking algorithm was used to determine the differences in the numbers of triple junctions detected between polycrystalline systems with planar and curved grain boundaries. This can be theoretically determined and compared to a simple model system. We find that planar systems of grain boundaries possess significantly more triple junctions than systems of curved grain boundaries by a factor of two. There are also systematic differences between the two types of a system when they undergo grain growth, when there is an anomalous close-packed hexagonal phase which grows in the system of planar grain boundaries. read less NOT USED (high confidence) N. Amigo, P. Cortés, and F. Valencia, “Research on metallic glasses at the atomic scale: a systematic review,” Sn Applied Sciences. 2022. link Times cited: 1 NOT USED (high confidence) O. G. Nicholls, D. Frost, V. Tuli, J. Smutná, M. Wenman, and P. Burr, “Transferability of Zr-Zr interatomic potentials,” Journal of Nuclear Materials. 2022. link Times cited: 6 NOT USED (high confidence) N. Amigo, “Effect of the atomic construction and preparation procedure on the deformation behaviour of CuZr metallic glasses,” Molecular Simulation. 2021. link Times cited: 2 Abstract: ABSTRACT The construction of metallic glasses (MGs) at the a… read moreAbstract: ABSTRACT The construction of metallic glasses (MGs) at the atomic scale for molecular dynamics simulations involves several factors that ultimately affect the deformation behaviour, a matter that has been rarely addressed in the literature. In order to explore this issue, 10 Cu Zr MGs with different random initial arrangements were subjected to compression tests under identical simulation conditions. Three different deformation behaviours were identified: weak shear band (SB) formation + homogeneous nucleation of shear transformation zones (STZs); SB formation + weak STZs nucleation; and heavily localised SB formation. Structural characterisation revealed that samples exhibiting localised SB formation presented larger populations of clusters with a high degree of local five-fold symmetry, fivefold and quasi-fivefold bonding. The deformation behaviour also varied from sample to sample when exploring other parameters such as the initial random velocities and the annealing temperature after replication of the small samples. Therefore, the preparation procedure must be considered cautiously when studying MGs ductility. read less NOT USED (high confidence) P. Garg, Z. Pan, V. Turlo, and T. Rupert, “Segregation competition and complexion coexistence within a polycrystalline grain boundary network,” Acta Materialia. 2021. link Times cited: 13 NOT USED (high confidence) S. Sun and P. Guan, “The critical model size for simulating the structure-dynamics correlation in bulk metallic glasses,” Science China Materials. 2021. link Times cited: 5 NOT USED (high confidence) A. K. A. Lu, K. Nishio, T. Morishita, K. Ohara, Z. Lu, and A. Hirata, “Frank-Kasper Z16 local structures in Cu-Zr metallic glasses,” Physical Review B. 2020. link Times cited: 1 Abstract: Although previous molecular dynamics studies proposed the ex… read moreAbstract: Although previous molecular dynamics studies proposed the existence of Zr-centered Frank-Kasper Z16 structures in Cu-Zr metallic glasses, it cannot be concluded yet, owing to the degeneracy problem of the Voronoi index and the artifact in sets of potentials for Cu-Zr systems. We solve both problems by combining a recently developed Finnis-Sinclair potentials to generate realistic atomic structures and the ${p}_{3}$ code to properly differentiate local structures. In previous studies, the Voronoi index $\ensuremath{\langle}0,0,12,4\ensuremath{\rangle}$ was typically associated with Frank-Kasper Z16 local structures. However, we demonstrate that this index includes two types of polyhedra, only one of which is associated with the Frank-Kasper Z16 structures. We reveal that the Z16 structures are more frequent than the other structures and that the two have different behaviors. The tendency of Zr-centered Z16 local structures to be neighbors of Cu-centered icosahedral local structures is also confirmed. Our findings illustrate the importance of properly differentiating local structures in order to elucidate the behavior of metallic glasses at the atomic scale. read less NOT USED (high confidence) M. Kramer and M. Li, “Changes in short- and medium-range order in metallic liquids during undercooling,” MRS Bulletin. 2020. link Times cited: 12 Abstract: It has been widely speculated that dominant motifs, such as … read moreAbstract: It has been widely speculated that dominant motifs, such as short-range icosahedral order, can influence glass formation and the properties of glasses. Experimental data on both fragile and strong undercooled liquids show corresponding changes in their thermophysical properties consistent with increasing development of a network of interconnect motifs based on molecular dynamics. Describing these regions of local order, how they connect, and how they are related to property changes have been challenging issues, both computationally and experimentally. Yet the consensus is that metallic liquids develop interconnected medium-range order consisting of some regions with lower mobility with deeper undercooling. Less well understood is how these motifs (or “crystal genes”) in the liquid can inhibit nucleation in the deeply undercooled liquid or influence phase selection upon devitrification. These motifs tend to have local packing unlike stable compounds with icosahedral order tending to dominate the best glass formers. The underlying kinetic and thermodynamic forces that guide the formation of these motifs and how they interconnect during undercooling remain open questions. read less NOT USED (high confidence) P. Derlet, “Correlated disorder in a model binary glass through a local SU(2) bonding topology,” Physical Review Materials. 2020. link Times cited: 4 Abstract: A quantitative understanding of the microscopic constraints … read moreAbstract: A quantitative understanding of the microscopic constraints which underlie a well relaxed glassy structure is the key to developing a microscopic theory of structural evolution and plasticity for the amorphous solid. Here we demonstrate the applicability of one such theory of local bonding constraints developed by D. R. Nelson [Phys. Rev. B 28, 5515 (1983)], for a model binary Lennard-Jones glass structure that has undergone an isothermal annealing simulation spanning over 10 micro-seconds of physical simulation time. By introducing a modified radical Voronoi tessellation which removes some ambiguity in how nearest neighbour bonds are enumerated, it is found, that a large proportion ($>95\%$) of local atomic environments follow the connectivity rules of the SU(2) topology of Nelson's work resulting in a dense network of disclination lines characterizing the defect bonds. Furthermore, it is numerically shown that a low energy glass structure corresponds to a reduced level of bond-length frustration and thus a minimally defected bond-defect network. It is then demonstrated that such a defect network provides a framework in which to analyse thermally-activated structural excitations, revealing those high-energy/low-density regions not following the connectivity constraints are more likely to undergo structural rearrangement that often results in a local relaxation that ends with the creation of new SU(2) local topology content. read less NOT USED (high confidence) Y.-C. Hu, K. Zhang, S. A. Kube, J. Schroers, M. Shattuck, and C. O’Hern, “Glass formation in binary alloys with different atomic symmetries,” arXiv: Materials Science. 2020. link Times cited: 4 Abstract: Prediction of the glass forming ability (GFA) of alloys rema… read moreAbstract: Prediction of the glass forming ability (GFA) of alloys remains a major challenge. We are not able to predict the composition dependence of the GFA of even binary alloys. To investigate the effect of each element's propensity to form particular crystal structures on glass formation, we focus on binary alloys composed of elements with the same size, but different atomic symmetries using the patchy-particle model. For mixtures with atomic symmetries that promote different crystal structures, the minimum critical cooling rate $R_c$ is only a factor of $5$ lower than that for the pure substances. For mixtures with different atomic symmetries that promote local crystalline and icosahedral order, the minimum $R_c$ is more than $3$ orders of magnitude lower than that for pure substances. Results for $R_c$ for the patchy-particle model are in agreement with those from embedded atom method simulations and sputtering experiments of NiCu, TiAl, and high entropy alloys. read less NOT USED (high confidence) S. Ganorkar, Y.-hee Lee, S. Lee, Y. C. Cho, T. Ishikawa, and G. Lee, “Unequal effect of thermodynamics and kinetics on glass forming ability of Cu–Zr alloys,” AIP Advances. 2020. link Times cited: 3 Abstract: The glass forming ability (GFA) of Cu–Zr alloys has been sti… read moreAbstract: The glass forming ability (GFA) of Cu–Zr alloys has been still ambiguous, due to incomplete or lacking thermophysical properties of Cu–Zr liquids in supercooled and stable states, although tremendous effort has been devoted. We provide here the comprehensive thermophysical properties of Cu–Zr liquids, such as undercoolability, density, viscosity, fusion enthalpy, temperature–time-transformation (TTT) diagram, and crystal–liquid interfacial free energy. Three compositions, Cu64Zr36, Cu56Zr44, and Cu50Zr50, show distinctive anomalies in undercoolability, nose time in TTT, and crystal–liquid interfacial free energy, but not in density and viscosity in supercooled and stable liquid states. The anomalies reflect that the GFA is dominantly governed by thermodynamics rather than kinetics in these bulk metallic glasses (BMGs). In addition, we find that positions of nose temperatures in the TTT curves are below 1/2 (Tg + Tl), which implies unequal contribution of thermodynamics and kinetics. We discuss that empiri... read less NOT USED (high confidence) C. M. Andolina, P. Williamson, and W. Saidi, “Optimization and validation of a deep learning CuZr atomistic potential: Robust applications for crystalline and amorphous phases with near-DFT accuracy.,” The Journal of chemical physics. 2020. link Times cited: 32 Abstract: We show that a deep-learning neural network potential (DP) b… read moreAbstract: We show that a deep-learning neural network potential (DP) based on density functional theory (DFT) calculations can well describe Cu-Zr materials, an example of a binary alloy system, that can coexist in as ordered intermetallic and as an amorphous phase. The complex phase diagram for Cu-Zr makes it a challenging system for traditional atomistic force-fields that cannot accurately describe the different properties and phases. Instead, we show that a DP approach using a large database with ∼300k configurations can render results generally on par with DFT. The training set includes configurations of pristine and bulk elementary metals and intermetallic structures in the liquid and solid phases in addition to slab and amorphous configurations. The DP model was validated by comparing bulk properties such as lattice constants, elastic constants, bulk moduli, phonon spectra, and surface energies to DFT values for identical structures. Furthermore, we contrast the DP results with values obtained using well-established two embedded atom method potentials. Overall, our DP potential provides near DFT accuracy for the different Cu-Zr phases but with a fraction of its computational cost, thus enabling accurate computations of realistic atomistic models, especially for the amorphous phase. read less NOT USED (high confidence) X. Wang, W.-S. Xu, H. Zhang, and J. Douglas, “Universal nature of dynamic heterogeneity in glass-forming liquids: A comparative study of metallic and polymeric glass-forming liquids.,” The Journal of chemical physics. 2019. link Times cited: 29 Abstract: Glass-formation is a ubiquitous phenomenon that is often obs… read moreAbstract: Glass-formation is a ubiquitous phenomenon that is often observed in a broad class of materials ranging from biological matter to commonly encountered synthetic polymer, as well as metallic and inorganic glass-forming (GF) materials. Despite the many regularities in the dynamical properties of GF materials, the structural origin of the universal dynamical properties of these materials has not yet been identified. Recent simulations of coarse-grained polymeric GF liquids have indicated the coexistence of clusters of mobile and immobile particles that appear to be directly linked, respectively, to the rate of molecular diffusion and structural relaxation. The present work examines the extent to which these distinct types of "dynamic heterogeneity" (DH) arise in metallic GF liquids (Cu-Zr, Ni-Nb, and Pd-Si alloys) having a vastly different molecular structure and chemistry. We first identified mobile and immobile particles and their transient clusters and found the DH in the metallic alloys to be remarkably similar in form to polymeric GF liquids, confirming the "universality" of the DH phenomenon. Furthermore, the lifetime of the mobile particle clusters was found to be directly related to the rate of diffusion in these materials, while the lifetime of immobile particles was found to be proportional to the structural relaxation time, providing some insight into the origin of decoupling in GF liquids. An examination of particles having a locally preferred atomic packing, and clusters of such particles, suggests that there is no one-to-one relation between these populations of particles so that an understanding of the origin of DH in terms of static fluid structure remains elusive. read less NOT USED (high confidence) M. Sepulveda-Macias, G. Gutiérrez, and F. Lund, “Precursors to plastic failure in a numerical simulation of CuZr metallic glass,” Journal of Physics: Condensed Matter. 2019. link Times cited: 2 Abstract: We deform, in pure shear, a thin sample of Cu50Zr50 metallic… read moreAbstract: We deform, in pure shear, a thin sample of Cu50Zr50 metallic glass using a molecular dynamics simulation up to, and including, failure. The experiment is repeated ten times in order to have average values and standard deviations. Although failure occurs at the same value of the externally imposed strain for the ten samples, there is significant sample-to-sample variation in the specific microscopic material behavior. Failure can occur along one, two, or three planes, located at the boundaries of previously formed shear bands (SBs). These SBs form shortly before failure. However, well before their formation and at external strains where plastic deformation just begins to be significant, non-affine displacement organizes itself along localized bands. The SBs subsequently form at the edges of these non-affine-displacement-bands, and present an alternating rotation-quadrupole structure, as found previously by Şopu et al (2017 Phys. Rev. Lett. 119 195503) in the case of a notched sample loaded in tension. The thickness of SBs is roughly determined by the available plastic energy. The onset of shear banding is accompanied by a sharp increase in the rate of change of the rotation angle localization, the strain localization, and the non-affine square displacement. read less NOT USED (high confidence) Q. Cao, F. Tu, L. Xue, and F.-hou Wang, “Assessing relationships between self-diffusion coefficient and viscosity in Ni-Al alloys based on the pair distribution function,” Journal of Applied Physics. 2019. link Times cited: 5 Abstract: Based on the pair distribution function g(r), molecular dyna… read moreAbstract: Based on the pair distribution function g(r), molecular dynamics simulations on NiAl and Ni3Al melts were carried out to investigate the relationships between self-diffusion coefficient and viscosity. The self-diffusion coefficients of Ni in melts and the viscosity of melts were calculated using the Einstein relation and Green-Kubo equation, respectively. Our result shows that there is a crossover in the self-diffusion coefficient and viscosity from high-temperature Arrhenius behavior to low-temperature non-Arrhenius behavior, and the crossover is accompanied by the breakdown of Stokes-Einstein relation (SER) and the onset of fractional Stokes-Einstein relation. The breakdown temperature of SER is nearly twice the glass-transition temperature and much higher than the mode-coupling critical temperature for both NiAl and Ni3Al melts. Further analyses based on g(r) suggest that temperature dependences of the pair correlation entropy and the partial pair correlation entropy of components may be used as probes for testing the validity of Stokes-Einstein relation and predicting its breakdown temperature.Based on the pair distribution function g(r), molecular dynamics simulations on NiAl and Ni3Al melts were carried out to investigate the relationships between self-diffusion coefficient and viscosity. The self-diffusion coefficients of Ni in melts and the viscosity of melts were calculated using the Einstein relation and Green-Kubo equation, respectively. Our result shows that there is a crossover in the self-diffusion coefficient and viscosity from high-temperature Arrhenius behavior to low-temperature non-Arrhenius behavior, and the crossover is accompanied by the breakdown of Stokes-Einstein relation (SER) and the onset of fractional Stokes-Einstein relation. The breakdown temperature of SER is nearly twice the glass-transition temperature and much higher than the mode-coupling critical temperature for both NiAl and Ni3Al melts. Further analyses based on g(r) suggest that temperature dependences of the pair correlation entropy and the partial pair correlation entropy of components may be used as probes... read less NOT USED (high confidence) S. Chavoshi and S. Xu, “Nanoindentation/scratching at finite temperatures: Insights from atomistic-based modeling,” Progress in Materials Science. 2019. link Times cited: 37 NOT USED (high confidence) Z. Pan, V. Borovikov, M. Mendelev, and F. Sansoz, “Development of a semi-empirical potential for simulation of Ni solute segregation into grain boundaries in Ag,” Modelling and Simulation in Materials Science and Engineering. 2018. link Times cited: 19 Abstract: An Ag–Ni semi-empirical potential was developed to simulate … read moreAbstract: An Ag–Ni semi-empirical potential was developed to simulate the segregation of Ni solutes at Ag grain boundaries (GBs). The potential combines a new Ag potential fitted to correctly reproduce the stable and unstable stacking fault energies in this metal and the existing Ni potential from Mendelev et al (2012 Phil. Mag. 92 4454–69). The Ag–Ni cross potential functions were fitted to ab initio data on the liquid structure of the Ag80Ni20 alloy to properly incorporate the Ag–Ni interaction at small atomic separations, and to the Ni segregation energies at different sites within a high-energy Σ9 (221) symmetric tilt GB. By deploying this potential with hybrid Monte Carlo/molecular dynamics simulations, it was found that heterogeneous segregation and clustering of Ni atoms at GBs and twin boundary defects occur at low Ni concentrations, 1 and 2 at%. This behavior is profoundly different from the homogeneous interfacial dispersion generally observed for the Cu segregation in Ag. A GB transformation to amorphous intergranular films was found to prevail at higher Ni concentrations (10 at%). The developed potential opens new opportunities for studying the selective segregation behavior of Ni solutes in interface-hardened Ag metals and its effect on plasticity. read less NOT USED (high confidence) R. Ryltsev et al., “Nucleation instability in supercooled Cu-Zr-Al glass-forming liquids.,” The Journal of chemical physics. 2018. link Times cited: 27 Abstract: Few general models representing certain classes of real glas… read moreAbstract: Few general models representing certain classes of real glass-forming systems play a special role in computer simulations of supercooled liquid and glasses. Recently, it was shown that one of the most widely used model glassformers-the Kob-Andersen binary mixture-crystalizes in quite lengthy molecular dynamics simulations, and moreover, it is in fact a very poor glassformer at large system sizes. Thus, our understanding of crystallization stability of model glassformers is far from complete due to the fact that relatively small system sizes and short time scales have been considered so far. Here we address this issue for two embedded atom models intensively used last years in numerical studies of Cu-Zr-(Al) bulk metallic glasses. Exploring the structural evolution of Cu64.5Zr35.5 and Cu46Zr46Al8 alloys at continuous cooling and isothermal annealing, we observe that both systems nucleate in sufficiently lengthy simulations, although critical nucleation time for the latter is an order of magnitude higher than that for the former. We show that Cu64.5Zr35.5 is actually unstable to crystallization for large system sizes (N > 20 000). Both systems crystallize with the formation of tetrahedrally close packed Laves phases of different types. We argue that nucleation instability of the simulated Cu64.5Zr35.5 alloy is due to the fact that its composition is very close to that for the stable Cu2Zr compound with a C15 Laves phase structure. read less NOT USED (high confidence) B. Demaske, S. Phillpot, and D. Spearot, “Atomic-level deformation of CuxZr100-x metallic glasses under shock loading,” Journal of Applied Physics. 2018. link Times cited: 18 Abstract: Plastic deformation mechanisms in CuxZr100-x bulk metallic g… read moreAbstract: Plastic deformation mechanisms in CuxZr100-x bulk metallic glasses (MGs) subjected to shock are investigated using molecular dynamics simulations. MGs with Cu compositions between 30 and 70 at. % subjected to shock waves generated via piston velocities that range from 0.125 to 2.0 km/s are considered. In agreement with prior studies, plastic deformation is initiated via formation of localized regions of high von Mises shear strain, known as shear transformation zones (STZs). At low impact velocities, but above the Hugoniot elastic limit, STZ nucleation is dispersed behind the shock front. As impact velocity is increased, STZ nucleation becomes more homogeneous, eventually leading to shock-induced melting, which is identified in this work via high atomic diffusivity. The shear stress necessary to initiate plastic deformation within the shock front is independent of composition at shock intensities near the elastic limit but increases with increasing Cu content at high shock intensities. By contrast, both the flow stress in the plastically deformed MG and the critical shock pressure associated with melting behind the shock front are found to increase with increasing Cu content over the entire range of impact velocities. The evolution of the short-range order in the MG samples during shock wave propagation is analyzed using a polydisperse Voronoi tessellation method. Cu-centered polyhedra with full icosahedral symmetry are found to be most resistant to change under shock loading independent of the MG composition. A saturation is observed in the involvement of select Cu-centered polyhedra in the plastic deformation processes at a piston velocity around 0.75 km/s.Plastic deformation mechanisms in CuxZr100-x bulk metallic glasses (MGs) subjected to shock are investigated using molecular dynamics simulations. MGs with Cu compositions between 30 and 70 at. % subjected to shock waves generated via piston velocities that range from 0.125 to 2.0 km/s are considered. In agreement with prior studies, plastic deformation is initiated via formation of localized regions of high von Mises shear strain, known as shear transformation zones (STZs). At low impact velocities, but above the Hugoniot elastic limit, STZ nucleation is dispersed behind the shock front. As impact velocity is increased, STZ nucleation becomes more homogeneous, eventually leading to shock-induced melting, which is identified in this work via high atomic diffusivity. The shear stress necessary to initiate plastic deformation within the shock front is independent of composition at shock intensities near the elastic limit but increases with increasing Cu content at high shock intensities. By contrast, both t... read less NOT USED (high confidence) X. W. Zhou, D. Ward, and M. E. Foster, “A bond-order potential for the Al–Cu–H ternary system,” New Journal of Chemistry. 2018. link Times cited: 13 Abstract: Al-Based Al–Cu alloys have a very high strength to density r… read moreAbstract: Al-Based Al–Cu alloys have a very high strength to density ratio, and are therefore important materials for transportation systems including vehicles and aircrafts. These alloys also appear to have a high resistance to hydrogen embrittlement, and as a result, are being explored for hydrogen related applications. To enable fundamental studies of mechanical behavior of Al–Cu alloys under hydrogen environments, we have developed an Al–Cu–H bond-order potential according to the formalism implemented in the molecular dynamics code LAMMPS. Our potential not only fits well to properties of a variety of elemental and compound configurations (with coordination varying from 1 to 12) including small clusters, bulk lattices, defects, and surfaces, but also passes stringent molecular dynamics simulation tests that sample chaotic configurations. Careful studies verified that this Al–Cu–H potential predicts structural property trends close to experimental results and quantum-mechanical calculations; in addition, it properly captures Al–Cu, Al–H, and Cu–H phase diagrams and enables simulations of H2 dissociation, chemisorption, and absorption on Al–Cu surfaces. read less NOT USED (high confidence) T. D. Xu, X. D. Wang, H. Zhang, Q. Cao, D. X. Zhang, and J. Jiang, “Structural evolution and atomic dynamics in Ni-Nb metallic glasses: A molecular dynamics study.,” The Journal of chemical physics. 2017. link Times cited: 17 Abstract: The composition and temperature dependence of static and dyn… read moreAbstract: The composition and temperature dependence of static and dynamic structures in NixNb1-x (x = 50-70 at. %) were systematically studied using molecular dynamics with a new-released semi-empirical embedded atom method potential by Mendelev. The calculated pair correlation functions and the structure factor match well with the experimental data, demonstrating the reliability of the potential within relatively wide composition and temperature ranges. The local atomic structures were then characterized by bond angle distributions and Voronoi tessellation methods, demonstrating that the icosahedral ⟨0,0,12,0⟩ is only a small fraction in the liquid state but increases significantly during cooling and becomes dominant at 300 K. The most abundant clusters are identified as ⟨0,0,12,0⟩ and distorted icosahedron ⟨0,2,8,2⟩. The large fraction of these two clusters hints that the relatively good glass forming ability is near the eutectic point. Unlike Cu-Zr alloys, both the self-diffusion coefficient and shear viscosity are insensitive to compositions upon cooling in Ni-Nb alloys. The breakdown of the Stokes-Einstein relation happens at around 1.6Tg (Tg: glass transition temperature). In the amorphous state, the solid and liquid-like atoms can be distinguished based on the Debye-Waller factor ⟨u2⟩. The insensitivity of the dynamic properties of Ni-Nb alloys to compositions may result from the relatively simple solidification process in the phase diagram, in which only one eutectic point exists in the studied composition range. read less NOT USED (high confidence) Y. Li, Y. T. Sun, Z. Lu, M. Li, H. Bai, and W. Wang, “Size effect on dynamics and glass transition in metallic liquids and glasses.,” The Journal of chemical physics. 2017. link Times cited: 13 Abstract: The relaxation dynamics and glass transition in finite-sized… read moreAbstract: The relaxation dynamics and glass transition in finite-sized metallic liquid droplets were investigated via molecular dynamic simulations in model monoatomic Ta and binary Cu50Zr50 metallic liquids. We find that the droplet size has a significant impact on liquid dynamics and glass transition. Glass transition temperature and structural relaxation time exhibit strong size dependence and decrease drastically as the droplet is smaller than a certain size. It is revealed that this results from a liquid-like surface layer (∼1 nm thick) of droplets, in which the dynamics is much faster than the interior of droplets. A proposed scaling relationship can well describe the size dependent behavior of the glass transition temperature in metallic liquid droplets. These findings provide insight into the dynamics of metallic liquid droplets and plausible understanding of recent novel experimental observations. Apart from temperature and pressure, size may be another important parameter for potentially tuning the properties of metallic liquids and glasses in nanometer scale. read less NOT USED (high confidence) N. T. Brown, J. Qu, and E. Martínez, “Modeling material interfaces with hybrid adhesion method,” Computational Materials Science. 2017. link Times cited: 1 NOT USED (high confidence) K. N. Lad, N. Jakse, and A. Pasturel, “How closely do many-body potentials describe the structure and dynamics of Cu-Zr glass-forming alloy?,” The Journal of chemical physics. 2017. link Times cited: 6 Abstract: Molecular dynamics investigations of the structure and dynam… read moreAbstract: Molecular dynamics investigations of the structure and dynamics of Cu64.5Zr35.5 metallic glass-forming alloy have been carried out using five different semi-empirical, many-body interaction potentials based on the Finnis-Sinclair model [M. I. Mendelev et al., J. Appl. Phys. 102, 043501 (2007) (MSK); M. I. Mendelev et al., Philos. Mag. 89, 967 (2009) (MKOSYP); L. Ward et al., e-print arXiv:1209.0619 (2012) (WAFW)] and the embedded-atom model [Y. Q. Cheng et al., Phys. Rev. Lett. 102, 245501 (2009) (CMS) and N. Jakse et al., Phys. Rev. B 85, 174201 (2012) (JNP)]. Although the total static structure factor of the alloy for all the five interaction potentials is, in general, found to be in good agreement with the experimental results, the investigation of a local structure in terms of icosahedral short-range order reveals that the effect of the interaction potential (especially the cohesive part) on the structure of the alloy is not as trivial as it seems. For MSK and JNP potentials, the self-intermediate scattering function Fs(q, t), q-dependence of the structural relaxation time τα in the low-q region, and the self-diffusion coefficient, Ds, for Cu-atoms in the alloy are in excellent agreement with the experimental results. The results for MKOSYP, CMS, and WAFW potentials deviate significantly from the experiment and suggest the dynamics of the alloy to be faster. The difference in the description of the dynamics of the alloy by different potentials is found to be due to the difference in the relevant energy scales corresponding to the temperature scales. τα and Ds exhibit Arrhenius temperature dependence in the high temperature regime above the melting temperature. We also suggest that the attractive forces influence the dynamics of the liquid alloy significantly, which is against the mere perturbative role assigned to the attractive forces in the van der Waals picture of liquids that has been challenged in the recent years. As the five interaction potentials are frequently employed to study thermodynamic, mechanical, and transport properties of Cu-Zr alloys, our study also provides a suitability check for these potentials. read less NOT USED (high confidence) K. Kelton, “Kinetic and structural fragility—a correlation between structures and dynamics in metallic liquids and glasses,” Journal of Physics: Condensed Matter. 2017. link Times cited: 52 Abstract: The liquid phase remains poorly understood. In many cases, t… read moreAbstract: The liquid phase remains poorly understood. In many cases, the densities of liquids and their crystallized solid phases are similar, but since they are amorphous they lack the spatial order of the solid. Their dynamical properties change remarkably over a very small temperature range. At high temperatures, near their melting temperature, liquids flow easily under shear. However, only a few hundred degrees lower flow effectively ceases, as the liquid transforms into a solid-like glass. This temperature-dependent dynamical behavior is frequently characterized by the concept of kinetic fragility (or, generally, simply fragility). Fragility is believed to be an important quantity in glass formation, making it of significant practical interest. The microscopic origin of fragility remains unclear, however, making it also of fundamental interest. It is widely (although not uniformly) believed that the dynamical behavior is linked to the atomic structure of the liquid, yet experimental studies show that although the viscosity changes by orders of magnitude with temperature, the structural change is barely perceptible. In this article the concept of fragility is discussed, building to a discussion of recent results in metallic glass-forming liquids that demonstrate the presumed connection between structural and dynamical changes. In particular, it becomes possible to define a structural fragility parameter that can be linked with the kinetic fragility. read less NOT USED (high confidence) X. W. Zhou, D. Ward, and M. E. Foster, “An analytical bond-order potential for the aluminum copper binary system,” Journal of Alloys and Compounds. 2016. link Times cited: 38 NOT USED (high confidence) B. Klumov, R. Ryltsev, and N. Chtchelkatchev, “Simulated Cu–Zr glassy alloys: the impact of composition on icosahedral order,” JETP Letters. 2016. link Times cited: 10 NOT USED (high confidence) R. Ryltsev et al., “Cooling rate dependence of simulated Cu64.5Zr35.5 metallic glass structure.,” The Journal of chemical physics. 2016. link Times cited: 46 Abstract: Using molecular dynamics simulations with embedded atom mode… read moreAbstract: Using molecular dynamics simulations with embedded atom model potential, we study structural evolution of Cu64.5Zr35.5 alloy during the cooling in a wide range of cooling rates γ ∈ (1.5 ⋅ 10(9), 10(13)) K/s. Investigating short- and medium-range orders, we show that the structure of Cu64.5Zr35.5 metallic glass essentially depends on cooling rate. In particular, a decrease of the cooling rate leads to an increase of abundances of both the icosahedral-like clusters and Frank-Kasper Z16 polyhedra. The amounts of these clusters in the glassy state drastically increase at the γmin = 1.5 ⋅ 10(9) K/s. Analysing the structure of the glass at γmin, we observe the formation of nano-sized crystalline grain of Cu2Zr intermetallic compound with the structure of Cu2Mg Laves phase. The structure of this compound is isomorphous with that for Cu5Zr intermetallic compound. Both crystal lattices consist of two types of clusters: Cu-centered 13-atom icosahedral-like cluster and Zr-centered 17-atom Frank-Kasper polyhedron Z16. That suggests the same structural motifs for the metallic glass and intermetallic compounds of Cu-Zr system and explains the drastic increase of the abundances of these clusters observed at γmin. read less NOT USED (high confidence) I. Douglass, T. Hudson, and P. Harrowell, “Density and glass forming ability in amorphous atomic alloys: The role of the particle softness.,” The Journal of chemical physics. 2016. link Times cited: 3 Abstract: A key property of glass forming alloys, the anomalously smal… read moreAbstract: A key property of glass forming alloys, the anomalously small volume difference with respect to the crystal, is shown to arise as a direct consequence of the soft repulsive potentials between metals. This feature of the inter-atomic potential is demonstrated to be responsible for a significant component of the glass forming ability of alloys due to the decrease in the enthalpy of fusion and the associated depression of the freezing point. read less NOT USED (high confidence) M. Mendelev et al., “Development of interatomic potentials appropriate for simulation of devitrification of Al90Sm10 alloy,” Modelling and Simulation in Materials Science and Engineering. 2015. link Times cited: 59 Abstract: A semi-empirical potential for the Al90Sm10 alloy is present… read moreAbstract: A semi-empirical potential for the Al90Sm10 alloy is presented. The potential provides satisfactory reproduction of pure Al properties, the formation energies of a set of Al–Sm crystal phases with Sm content about 10%, and the structure of the liquid Al90Sm10 alloy. During molecular dynamics simulation in which the liquid alloy is cooled at a rate of 1010 K s−1, the developed potential produces a glass structure with lower ab initio energy than that produced by ab initio molecular dynamics (AIMD) itself using a typical AIMD cooling rate of 8·1013 K s−1. Based on these facts the developed potential should be suitable for simulations of phase transformations in the Al90Sm10 alloy. read less NOT USED (high confidence) S. Wilson, K. Gunawardana, and M. Mendelev, “Solid-liquid interface free energies of pure bcc metals and B2 phases.,” The Journal of chemical physics. 2015. link Times cited: 32 Abstract: The solid-liquid interface (SLI) free energy was determined … read moreAbstract: The solid-liquid interface (SLI) free energy was determined from molecular dynamics (MD) simulation for several body centered cubic (bcc) metals and B2 metallic compounds (space group: Pm3̄m; prototype: CsCl). In order to include a bcc metal with a low melting temperature in our study, a semi-empirical potential was developed for Na. Two additional synthetic "Na" potentials were also developed to explore the effect of liquid structure and latent heat on the SLI free energy. The obtained MD data were compared with the empirical Turnbull, Laird, and Ewing relations. All three relations are found to predict the general trend observed in the MD data for bcc metals obtained within the present study. However, only the Laird and Ewing relations are able to predict the trend obtained within the sequence of "Na" potentials. The Laird relation provides the best prediction for our MD data and other MD data for bcc metals taken from the literature. Overall, the Laird relation also agrees well with our B2 data but requires a proportionality constant that is substantially different from the bcc case. It also fails to explain a considerable difference between the SLI free energies of some B2 phases which have nearly the same melting temperature. In contrast, this difference is satisfactorily described by the Ewing relation. Moreover, the Ewing relation obtained from the bcc dataset also provides a reasonable description of the B2 data. read less NOT USED (high confidence) M. Blodgett and K. Kelton, “Estimated partial pair correlation functions in Cu–Zr liquids,” Journal of Non-crystalline Solids. 2015. link Times cited: 5 NOT USED (high confidence) R. Soklaski, V. Tran, Z. Nussinov, K. Kelton, and L. Yang, “A locally preferred structure characterises all dynamical regimes of a supercooled liquid,” Philosophical Magazine. 2015. link Times cited: 50 Abstract: Recent experimental results suggest that metallic liquids un… read moreAbstract: Recent experimental results suggest that metallic liquids universally exhibit a high-temperature dynamical crossover, which is correlated with the glass transition temperature (). We demonstrate, using molecular dynamics results for , that this temperature, , is linked with cooperative atomic rearrangements that produce domains of connected icosahedra. Supercooling to a new characteristic temperature, , is shown to produce higher order cooperative rearrangements amongst connected icosahedra, which manifests as the formation of large Zr-rich connected domains that possess macroscopic proportions of the liquid’s icosahedra. This coincides with the decoupling of atomic diffusivities, large-scale domain fluctuations and the onset of glassy dynamics in the liquid. These extensive domains then abruptly stabilise above and eventually percolate before the glass is formed. All characteristic temperatures (, and ) are thus connected by successive manifestations of the structural cooperativity that begins at . read less NOT USED (high confidence) X. W. Zhou, D. Ward, M. Foster, and J. Zimmerman, “An analytical bond-order potential for the copper–hydrogen binary system,” Journal of Materials Science. 2015. link Times cited: 18 NOT USED (high confidence) F. Zhang et al., “Composition-dependent stability of the medium-range order responsible for metallic glass formation,” Acta Materialia. 2014. link Times cited: 24 NOT USED (high confidence) P. Zhu and F. Fang, “On the mechanism of material removal in nanometric cutting of metallic glass,” Applied Physics A. 2014. link Times cited: 25 NOT USED (high confidence) M. Kramer, M. Mendelev, and M. Asta, “Structure of liquid Al and Al67Mg33 alloy: comparison between experiment and simulation,” Philosophical Magazine. 2014. link Times cited: 9 Abstract: We report data on the structure of liquid Al and an Al67Mg33… read moreAbstract: We report data on the structure of liquid Al and an Al67Mg33 alloy obtained from state-of-the-art X-ray diffraction experiments and ab initio molecular dynamics (AIMD) simulations. To facilitate a direct comparison between these data, we develop a method to elongate the AIMD pair correlation function in order to obtain reliable AIMD structure factors. The comparison reveals an appreciable level of discrepancy between experimental and AIMD liquid structures, with the latter being consistently more ordered than the former at the same temperature. The discrepancy noted in this study is estimated to have significant implications for simulation-based calculations of liquid transport properties and solid–liquid interface kinetic properties. read less NOT USED (high confidence) P. Zhu and F. Fang, “On the mechanism of material removal in nanometric cutting of metallic glass,” Applied Physics A. 2013. link Times cited: 0 NOT USED (high confidence) R. Soklaski, Z. Nussinov, Z. E. Markow, K. Kelton, and L. Yang, “Connectivity of icosahedral network and a dramatically growing static length scale in Cu-Zr binary metallic glasses,” Physical Review B. 2013. link Times cited: 126 Abstract: We report on and characterize, via molecular dynamics studie… read moreAbstract: We report on and characterize, via molecular dynamics studies, the evolution of the structure of Cu${}_{50}$Zr${}_{50}$ and Cu${}_{64}$Zr${}_{36}$ metallic glasses (MGs) as temperature is varied. Interestingly, a percolating icosahedral network appears in the Cu${}_{64}$Zr${}_{36}$ system as it is supercooled. This leads us to introduce a static length scale, which grows dramatically as this three-dimensional system approaches the glass transition. Amidst interpenetrating connections, noninterpenetrating connections between icosahedra are shown to become prevalent upon supercooling and to greatly enhance the connectivity of the MG's icosahedral network. Additionally, we characterize the chemical compositions of the icosahedral networks and their components. These findings demonstrate the importance of noninterpenetrating connections for facilitating extensive structural networks in Cu-Zr MGs, which in turn drive dynamical slowing in these materials. read less NOT USED (high confidence) C. Tang and P. Harrowell, “Predicting the solid state phase diagram for glass-forming alloys of copper and zirconium,” Journal of Physics: Condensed Matter. 2012. link Times cited: 19 Abstract: The free energies of six crystal structures associated with … read moreAbstract: The free energies of six crystal structures associated with Cu–Zr alloys—Cu (face centred cubic), Cu2Zr, Cu10Zr7, CuZr, CuZr2 and Zr (hexagonal close packed)—are calculated using the embedded atom potential of Mendelev et al (2009 Phil. Mag. 89 967). We find that the observed low temperature stability of the Cu10Zr7 and CuZr2 phases is not reproduced. Instead, the model predicts that the CuZr phase remains stable down to T = 0 K. This discrepancy is largely removed when the interaction potentials are cut off at a short distance, such as that used by Duan et al (2005 Phys. Rev. B 71 224208). We present evidence, however, that the cut-off distance necessary to achieve the change in phase stability results in pathological artefacts in the energetics of some crystal phases. read less NOT USED (high confidence) J. Harvey, A. Gheribi, and P. Chartrand, “Accurate determination of the Gibbs energy of Cu-Zr melts using the thermodynamic integration method in Monte Carlo simulations.,” The Journal of chemical physics. 2011. link Times cited: 19 Abstract: The design of multicomponent alloys used in different applic… read moreAbstract: The design of multicomponent alloys used in different applications based on specific thermo-physical properties determined experimentally or predicted from theoretical calculations is of major importance in many engineering applications. A procedure based on Monte Carlo simulations (MCS) and the thermodynamic integration (TI) method to improve the quality of the predicted thermodynamic properties calculated from classical thermodynamic calculations is presented in this study. The Gibbs energy function of the liquid phase of the Cu-Zr system at 1800 K has been determined based on this approach. The internal structure of Cu-Zr melts and amorphous alloys at different temperatures, as well as other physical properties were also obtained from MCS in which the phase trajectory was modeled by the modified embedded atom model formalism. A rigorous comparison between available experimental data and simulated thermo-physical properties obtained from our MCS is presented in this work. The modified quasichemical model in the pair approximation was parameterized using the internal structure data obtained from our MCS and the precise Gibbs energy function calculated at 1800 K from the TI method. The predicted activity of copper in Cu-Zr melts at 1499 K obtained from our thermodynamic optimization was corroborated by experimental data found in the literature. The validity of the amplitude of the entropy of mixing obtained from the in silico procedure presented in this work was analyzed based on the thermodynamic description of hard sphere mixtures. read less NOT USED (high confidence) X. J. Han and H. Schober, “Transport properties and Stokes-Einstein relation in a computer-simulated glass-forming Cu 33 . 3 Zr 66 . 7 melt,” Physical Review B. 2011. link Times cited: 66 Abstract: Molecular dynamics simulation with a modified embedded atom … read moreAbstract: Molecular dynamics simulation with a modified embedded atom potential was used to study transport properties and the Stokes-Einstein relation of a glass-forming Cu${}_{33.3}$Zr${}_{66.7}$ metallic melt. Upon cooling, at high temperatures, the self-diffusion coefficients of the two species evolve nearly parallel, whereas they diverge below 1600 K. The viscosity as function of temperature is calculated from the Green-Kubo equation. The critical temperature of mode coupling theory ${T}_{\mathrm{c}}$ is found as 1030 K, from both the transport properties and the \ensuremath{\alpha}-relaxation time. It is found that the Stokes-Einstein relation between viscosity and diffusivity breaks down at around 1600 K, far above ${T}_{\mathrm{c}}$ and even above the melting temperature. The temperature dependence of the effective diameter in the Stokes-Einstein relation correlates closely with the first derivative of the ratio of the self-diffusion coefficients of the two components. We propose that the onset of Stokes-Einstein relation breakdown could be predicted quantitatively by the divergence behavior of diffusion coefficients, and the breakdown of Stokes-Einstein relation is ascribed to the sudden increase of the dynamic heterogeneity. read less NOT USED (high confidence) M. Mendelev, M. Asta, M. J. Rahman, and J. Hoyt, “Development of interatomic potentials appropriate for simulation of solid–liquid interface properties in Al–Mg alloys,” Philosophical Magazine. 2009. link Times cited: 126 Abstract: Different approaches are analyzed for construction of semi-e… read moreAbstract: Different approaches are analyzed for construction of semi-empirical potentials for binary alloys, focusing specifically on the capability of these potentials to describe solid–liquid phase equilibria, as a pre-requisite to studies of solidification phenomena. Fitting ab initio compound data does not ensure correct reproduction of the dilute solid-solution formation energy, and explicit inclusion of this quantity in the potential development procedure does not guarantee that the potential will predict the correct solid–liquid phase diagram. Therefore, we conclude that fitting only to solid phase properties, as is done in most potential development procedures, generally is not sufficient to develop a semi-empirical potential suitable for the simulation of solidification. A method is proposed for the incorporation of data for liquid solution energies in the potential development procedure, and a new semi-empirical potential developed suitable for simulations of dilute alloys of Mg in Al. The potential correctly reproduces both zero-temperature solid properties and solidus and liquid lines on the Al-rich part of the Al–Mg phase diagram. read less NOT USED (high confidence) R. Singh, “An Implementation of Wang Tilings for the Representation of Metallic Glasses in Molecular Dynamics.” 2016. link Times cited: 0 Abstract: This thesis presents an implementation of a mathematical mod… read moreAbstract: This thesis presents an implementation of a mathematical model, Wang tilings, for the representation of metallic glasses in Molecular Dynamics. The purpose is to assess whether a Wang tiling specimen can be considered a representation of a metallic glass. The implementation of Wang tilings for the representation of amorphous structures can potentially increase system sizes and enable the study of small tile sets that achieve the same results. A technique for creating a Wang tiling specimen and a true specimen is developed. These specimens are then submitted to uniaxial tension deformation and analyzed macroscopic and microscopically. The analysis consisted of stress-strain curves, atomic bond deficiency defect concentrations and a shear banding analysis. The technique for the creation of a Wang tiling specimen was accurately developed, however, the tiled system is not a surrogate of the true specimen. This research is a first approach for implementing Wang tilings in Molecular Dynamics. read less NOT USED (definite) S. Weng, T. Fu, X. Peng, and X. Chen, “Anisotropic Phase Transformation in B2 Crystalline CuZr Alloy,” Nanoscale Research Letters. 2019. link Times cited: 17 NOT USED (definite) J. Li, G. Huang, X. Mi, L. Peng, H. Xie, and Y. Kang, “Effect of Ni/Si Mass Ratio and Thermomechanical Treatment on the Microstructure and Properties of Cu-Ni-Si Alloys,” Materials. 2019. link Times cited: 24 Abstract: The effect of the Ni/Si mass ratio and combined thermomechan… read moreAbstract: The effect of the Ni/Si mass ratio and combined thermomechanical treatment on the microstructure and properties of ternary Cu-Ni-Si alloys is discussed systematically. The Cu-Ni-Si alloy with a Ni/Si mass ratio of 4–5 showed good comprehensive properties. Precipitates with disc-like shapes were confirmed as the Ni2Si phase with orthorhombic structure through transmission electron microscopy, high-resolution transmission electron microscopy, and 3D atom probe characterization. After the appropriate thermomechanical treatment, the studied alloy with a Ni/Si mass ratio of 4.2 exhibited excellent mechanical properties: a hardness of 290 HV, tensile strength of 855 MPa, yield strength of 782 MPa, and elongation of 4.5%. Compared with other approaches, the thermomechanical treatment increased the hardness and strength without sacrificing electrical conductivity. Theoretical calculations indicated that the high strength was primarily attributed to the Orowan precipitation strengthening and secondarily ascribed to the work hardening, which were highly consistent with the experimental results. The appropriate Ni/Si mass ratio with a low content of Ni and Si atoms shows high strength and excellent electrical conductivity through combined thermomechanical treatment. This work provides a guideline for the design and preparation of multicomponent Cu-Ni-Si-X alloys with ultrahigh strength and excellent electrical conductivity. read less NOT USED (definite) W. B. Zhang et al., “Size effect on atomic structure in low-dimensional Cu-Zr amorphous systems,” Scientific Reports. 2017. link Times cited: 12 NOT USED (definite) J. Ding, M. Asta, and R. Ritchie, “On the question of fractal packing structure in metallic glasses,” Proceedings of the National Academy of Sciences. 2017. link Times cited: 29 Abstract: Significance Our work clearly demonstrates a lack of fractal… read moreAbstract: Significance Our work clearly demonstrates a lack of fractal structure in metallic glasses, considering the packing of all atoms or solute-centered clusters. This finding clarifies the long-standing debate over the packing structure of metallic glasses from the perspective of fractal models; it is thus of significance for the community of researchers working with amorphous solids. Moreover, our percolation analysis of metallic glasses, revealing their cluster structure and percolation threshold, provides an important and powerful theoretical framework to describe the properties of amorphous alloys, such as the glass transition and mechanical deformation. This work addresses the long-standing debate over fractal models of packing structure in metallic glasses (MGs). Through detailed fractal and percolation analyses of MG structures, derived from simulations spanning a range of compositions and quenching rates, we conclude that there is no fractal atomic-level structure associated with the packing of all atoms or solute-centered clusters. The results are in contradiction with conclusions derived from previous studies based on analyses of shifts in radial distribution function and structure factor peaks associated with volume changes induced by pressure and compositional variations. The interpretation of such shifts is shown to be challenged by the heterogeneous nature of MG structure and deformation at the atomic scale. Moreover, our analysis in the present work illustrates clearly the percolation theory applied to MGs, for example, the percolation threshold and characteristics of percolation clusters formed by subsets of atoms, which can have important consequences for structure–property relationships in these amorphous materials. read less NOT USED (definite) X. Fang et al., “Spatially Resolved Distribution Function and the Medium-Range Order in Metallic Liquid and Glass,” Scientific Reports. 2011. link Times cited: 70 NOT USED (definite) D. Rodney, A. Tanguy, and D. Vandembroucq, “Modeling the mechanics of amorphous solids at different length scale and time scale,” Modelling and Simulation in Materials Science and Engineering. 2011. link Times cited: 244 Abstract: We review the recent literature on the simulation of the str… read moreAbstract: We review the recent literature on the simulation of the structure and deformation of amorphous solids, including oxide and metallic glasses. We consider simulations at different length scale and time scale. At the nanometer scale, we review studies based on atomistic simulations, with a particular emphasis on the role of the potential energy landscape and of the temperature. At the micrometer scale, we present the different mesoscopic models of amorphous plasticity and show the relation between shear banding and the type of disorder and correlations (e.g. elastic) included in the models. At the macroscopic range, we review the different constitutive laws used in finite-element simulations. We end with a critical discussion on the opportunities and challenges offered by multiscale modeling and information transfer between scales to study amorphous plasticity. read less |
 EAM_Dynamo_MendelevKramerOtt_2009_CuZr__MO_600021860456_005