 EAM_Dynamo_OBrienBarrPrice_2018_PtAu__MO_946831081299_000
| Title
A single sentence description.
|
EAM potential (LAMMPS cubic hermite tabulation) for the Pt-Au system developed by O'Brien et al. (2018) v000 |
|---|---|
| Description
A short description of the Model describing its key features including for example: type of model (pair potential, 3-body potential, EAM, etc.), modeled species (Ac, Ag, ..., Zr), intended purpose, origin, and so on.
|
EAM potential for the Pt-Au system developed by O'Brien et al. (2018). There has recently been a great deal of interest in employing immiscible solutes to stabilize nanocrystalline microstructures. Existing modeling efforts largely rely on mesoscale Monte Carlo approaches that employ a simplified model of the microstructure and result in highly homogeneous segregation to grain boundaries. However, there is ample evidence from experimental and modeling studies that demonstrates segregation to grain boundaries is highly non-uniform and sensitive to boundary character. This work employs a realistic nanocrystalline microstructure with experimentally relevant global solute concentrations to illustrate inhomogeneous boundary segregation. Experiments quantifying segregation in thin films are reported that corroborate the prediction that grain boundary segregation is highly inhomogeneous. In addition to grain boundary structure modifying the degree of segregation, the existence of a phase transformation between low and high solute content grain boundaries is predicted. In order to conduct this study, new embedded atom method interatomic potentials are developed for Pt, Au, and the PtAu binary alloy. |
| Species
The supported atomic species.
| Au, Pt |
| Disclaimer
A statement of applicability provided by the contributor, informing users of the intended use of this KIM Item.
|
None |
| Content Origin | NIST IPRP (https://www.ctcms.nist.gov/potentials/Pt.html#Au-Pt) |
| Contributor |
Ellad B. Tadmor |
| Maintainer |
Ellad B. Tadmor |
| Developer |
Christopher J O'Brien Christopher M Barr Khalid Hattar Patrick M Price Stephen M. Foiles |
| Published on KIM | 2018 |
| How to Cite | Click here to download this citation in BibTeX format. |
| Citations
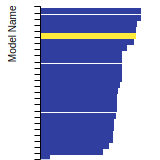
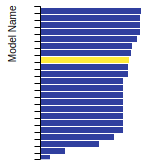
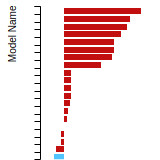
This panel presents information regarding the papers that have cited the interatomic potential (IP) whose page you are on. The OpenKIM machine learning based Deep Citation framework is used to determine whether the citing article actually used the IP in computations (denoted by "USED") or only provides it as a background citation (denoted by "NOT USED"). For more details on Deep Citation and how to work with this panel, click the documentation link at the top of the panel. The word cloud to the right is generated from the abstracts of IP principle source(s) (given below in "How to Cite") and the citing articles that were determined to have used the IP in order to provide users with a quick sense of the types of physical phenomena to which this IP is applied. The bar chart shows the number of articles that cited the IP per year. Each bar is divided into green (articles that USED the IP) and blue (articles that did NOT USE the IP). Users are encouraged to correct Deep Citation errors in determination by clicking the speech icon next to a citing article and providing updated information. This will be integrated into the next Deep Citation learning cycle, which occurs on a regular basis. OpenKIM acknowledges the support of the Allen Institute for AI through the Semantic Scholar project for providing citation information and full text of articles when available, which are used to train the Deep Citation ML algorithm. |
This panel provides information on past usage of this interatomic potential (IP) powered by the OpenKIM Deep Citation framework. The word cloud indicates typical applications of the potential. The bar chart shows citations per year of this IP (bars are divided into articles that used the IP (green) and those that did not (blue)). The complete list of articles that cited this IP is provided below along with the Deep Citation determination on usage. See the Deep Citation documentation for more information. 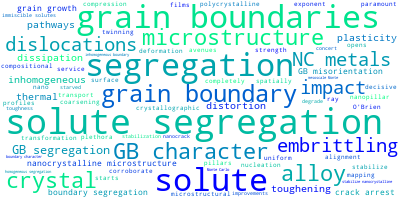
55 Citations (39 used)
Help us to determine which of the papers that cite this potential actually used it to perform calculations. If you know, click the .
USED (high confidence) X. Zhou et al., “The hidden structure dependence of the chemical life of dislocations,” Science Advances. 2021. link Times cited: 25 Abstract: Combined atomic-scale characterization and simulation reveal… read more USED (high confidence) C. Barr et al., “The role of grain boundary character in solute segregation and thermal stability of nanocrystalline Pt-Au.,” Nanoscale. 2021. link Times cited: 24 Abstract: Nanocrystalline (NC) metals suffer from an intrinsic thermal… read more USED (high confidence) M. Bagheripoor and R. Klassen, “Effect of crystal orientation on the size effects of nano-scale fcc metals,” Materials Science and Technology. 2020. link Times cited: 3 Abstract: The present work investigates the dominant mechanisms in the… read more USED (high confidence) M. Wagih, P. M. Larsen, and C. Schuh, “Learning grain boundary segregation energy spectra in polycrystals,” Nature Communications. 2020. link Times cited: 62 USED (high confidence) N. Heckman et al., “New nanoscale toughening mechanisms mitigate embrittlement in binary nanocrystalline alloys.,” Nanoscale. 2018. link Times cited: 24 Abstract: Nanocrystalline metals offer significant improvements in str… read more USED (low confidence) Y. Mahmood, M. S. Daw, M. Chandross, and F. Abdeljawad, “Universal trends in computed grain boundary energies of FCC metals,” Scripta Materialia. 2024. link Times cited: 0 USED (low confidence) J. Niu, R. Hu, X. Luo, Z. Gao, and P. Li, “Study on the Microscopic Compression Deformation Mechanism of Nanocrystalline Single-phase Gold Platinum Alloy,” Journal of Materials Research and Technology. 2023. link Times cited: 0 USED (low confidence) G. Luo, Y. Tian, F. Chen, J. Liu, S. Chen, and C. Du, “Atomic insight into mechanical behavior of AuPt alloys,” International Journal of Mechanical Sciences. 2023. link Times cited: 0 USED (low confidence) T. Pradhan, S. Pal, and C. Deng, “Investigation on wear-resistance of nanocrystalline Pt-Au by molecular dynamics simulations,” Tribology International. 2023. link Times cited: 0 USED (low confidence) C. Liu, Z. Zhuang, J. Chen, W. Yip, and S. To, “Atomic-scale investigation of Pt composition on deformation mechanism of AuPt alloy during nano-scratching process,” Surfaces and Interfaces. 2023. link Times cited: 1 USED (low confidence) N. Tuchinda and C. Schuh, “Triple junction solute segregation in Al-based polycrystals,” Physical Review Materials. 2023. link Times cited: 3 USED (low confidence) C. Hu, S. Berbenni, D. Medlin, and R. Dingreville, “Discontinuous segregation patterning across disconnections,” Acta Materialia. 2023. link Times cited: 3 USED (low confidence) N. Tuchinda and C. Schuh, “The Vibrational Entropy Spectra of Grain Boundary Segregation in Polycrystals,” Acta Materialia. 2022. link Times cited: 7 USED (low confidence) X.-W. Chen, R. Huang, and Y. Wen, “Phase segregation in bimetallic nanodroplets,” Journal of Materials Science. 2022. link Times cited: 0 USED (low confidence) A. Hernandez and T. Mueller, “Generalizability of Functional Forms for Interatomic Potential Models Discovered by Symbolic Regression,” ArXiv. 2022. link Times cited: 0 Abstract: In recent years there has been great progress in the use of … read more USED (low confidence) E.-A. Picard and F. Sansoz, “Ni Solute Segregation and Associated Plastic Deformation Mechanisms into Random FCC Ag, BCC Nb and HCP Zr Polycrystals,” Acta Materialia. 2022. link Times cited: 5 USED (low confidence) H. Jo et al., “Direct strain correlations at the single-atom level in three-dimensional core-shell interface structures,” Nature Communications. 2022. link Times cited: 8 USED (low confidence) A. Pedrazo-Tardajos et al., “Thermal Activation of Gold Atom Diffusion in Au@Pt Nanorods.,” ACS nano. 2022. link Times cited: 7 Abstract: Understanding the thermal stability of bimetallic nanopartic… read more USED (low confidence) L. Cao and T. Mueller, “Catalytic Activity Maps for Alloy Nanoparticles.,” Journal of the American Chemical Society. 2022. link Times cited: 6 Abstract: To enable rational design of alloy nanoparticle catalysts, w… read more USED (low confidence) N. Heckman et al., “Solute segregation improves the high-cycle fatigue resistance of nanocrystalline Pt-Au,” Acta Materialia. 2022. link Times cited: 4 USED (low confidence) T. Prithiv et al., “Grain boundary segregation and its implications regarding the formation of the grain boundary α phase in the metastable β-Titanium Ti–5Al–5Mo–5V–3Cr alloy,” Scripta Materialia. 2022. link Times cited: 18 USED (low confidence) N. Tuchinda and C. Schuh, “Grain Size Dependencies of Intergranular Solute Segregation in Nanocrystalline Materials,” Acta Materialia. 2021. link Times cited: 15 USED (low confidence) F. Torre et al., “Investigation on the Thermodynamic Stability of Nanocrystalline W-Based Alloys: A Combined Theoretical and Experimental Approach,” Materials. 2021. link Times cited: 1 Abstract: The stability of nanostructured metal alloys is currently be… read more USED (low confidence) M. Wagih and C. Schuh, “Thermodynamics and design of nanocrystalline alloys using grain boundary segregation spectra,” Acta Materialia. 2021. link Times cited: 20 USED (low confidence) X. Zhou, R. D. Kamachali, B. Boyce, B. G. Clark, D. Raabe, and G. Thompson, “Spinodal Decomposition in Nanocrystalline Alloys,” Acta Materialia. 2021. link Times cited: 25 USED (low confidence) C. Hu, D. Medlin, and R. Dingreville, “Disconnection-Mediated Transition in Segregation Structures at Twin Boundaries.,” The journal of physical chemistry letters. 2021. link Times cited: 4 Abstract: Twin boundaries play an important role in the thermodynamics… read more USED (low confidence) N. Zhou, C. Hu, and J. Luo, “Grain Boundary Segregation Transitions and Critical Phenomena in Binary Regular Solutions: A Systematics of Complexion Diagrams with Universal Characters,” Acta Materialia. 2021. link Times cited: 5 USED (low confidence) J. L. Priedeman and G. Thompson, “The influence of alloying in stabilizing a faceted grain boundary structure,” Acta Materialia. 2020. link Times cited: 11 USED (low confidence) Z. Pan and F. Sansoz, “Heterogeneous solute segregation suppresses strain localization in nanocrystalline Ag-Ni alloys,” Acta Materialia. 2020. link Times cited: 13 USED (low confidence) J. Chapman and R. Ramprasad, “Nanoscale Modeling of Surface Phenomena in Aluminum Using Machine Learning Force Fields,” The Journal of Physical Chemistry C. 2020. link Times cited: 7 Abstract: The study of nano-scale surface phenomena is essential in un… read more USED (low confidence) P. Cantwell et al., “Grain Boundary Complexion Transitions,” Annual Review of Materials Research. 2020. link Times cited: 94 Abstract: Grain boundaries can undergo phase-like transitions, called … read more USED (low confidence) J. Chapman, R. Batra, and R. Ramprasad, “Machine learning models for the prediction of energy, forces, and stresses for Platinum,” Computational Materials Science. 2020. link Times cited: 18 USED (low confidence) G. Wang, Y. Xu, P. Qian, and Y. Su, “Vacancy concentration of films and nanoparticles,” Computational Materials Science. 2020. link Times cited: 8 USED (low confidence) J. Schuler, C. M. Grigorian, C. Barr, B. Boyce, K. Hattar, and T. Rupert, “Amorphous Intergranular Films Mitigate Radiation Damage in Nanocrystalline Cu-Zr,” Nanomaterials eJournal. 2019. link Times cited: 15 Abstract: Nanocrystalline metals are promising radiation tolerant mate… read more USED (low confidence) M. Wagih and C. Schuh, “Spectrum of grain boundary segregation energies in a polycrystal,” Acta Materialia. 2019. link Times cited: 74 USED (low confidence) G. Kaptay, “Thermodynamic Stability of Nano-grained Alloys Against Grain Coarsening and Precipitation of Macroscopic Phases,” Metallurgical and Materials Transactions A. 2019. link Times cited: 12 USED (low confidence) J. A. Bahena, J. Riano, M. Chellali, T. Boll, and A. Hodge, “Thermally activated microstructural evolution of sputtered nanostructured Mo–Au,” Materialia. 2018. link Times cited: 7 USED (low confidence) Z. Pan, V. Borovikov, M. Mendelev, and F. Sansoz, “Development of a semi-empirical potential for simulation of Ni solute segregation into grain boundaries in Ag,” Modelling and Simulation in Materials Science and Engineering. 2018. link Times cited: 19 Abstract: An Ag–Ni semi-empirical potential was developed to simulate … read more USED (low confidence) T. Frolov, Q. Zhu, T. Oppelstrup, J. Marian, and R. Rudd, “Structures and transitions in bcc tungsten grain boundaries and their role in the absorption of point defects,” Acta Materialia. 2018. link Times cited: 48 NOT USED (high confidence) I. S. Winter, R. E. Rudd, T. Oppelstrup, and T. Frolov, “Nucleation of Grain Boundary Phases.,” Physical review letters. 2021. link Times cited: 9 Abstract: We derive a theory that describes homogeneous nucleation of … read more NOT USED (high confidence) X. Zhou et al., “Revealing in-plane grain boundary composition features through machine learning from atom probe tomography data,” Acta Materialia. 2021. link Times cited: 9 NOT USED (high confidence) C. Li, S. Lu, and L. Vitos, “Predicting grain boundary energies of complex alloys from ab initio calculations,” Scripta Materialia. 2021. link Times cited: 6 NOT USED (high confidence) T. Frolov, D. Medlin, and M. Asta, “Dislocation content of grain boundary phase junctions and its relation to grain boundary excess properties,” Physical Review B. 2021. link Times cited: 8 Abstract: We analyze the dislocation content of grain boundary (GB) ph… read more NOT USED (high confidence) S. Mathaudhu, “Building on Gleiter: The Foundations and Future of Deformation Processing of Nanocrystalline Metals,” Metallurgical and Materials Transactions A. 2020. link Times cited: 9 NOT USED (high confidence) N. Peter, M. J. Duarte, C. Kirchlechner, C. Liebscher, and G. Dehm, “Faceting diagram for Ag segregation induced nanofaceting at an asymmetric Cu tilt grain boundary,” arXiv: Materials Science. 2020. link Times cited: 11 NOT USED (high confidence) X. Zhou, T. Kaub, F. Vogel, and G. Thompson, “Complications of using thin film geometries for nanocrystalline thermal stability investigations,” Journal of Materials Research. 2020. link Times cited: 0 Abstract: We report the sputter deposition of Cu-7V and Cu-27V (at.%) … read more NOT USED (high confidence) J. Chapman and R. Ramprasad, “Predicting the dynamic behavior of the mechanical properties of platinum with machine learning.,” The Journal of chemical physics. 2020. link Times cited: 2 Abstract: Over the last few decades, computational tools have been ins… read more NOT USED (high confidence) E. Antillon and M. Ghazisaeidi, “Efficient determination of solid-state phase equilibrium with the multicell Monte Carlo method.,” Physical review. E. 2020. link Times cited: 5 Abstract: Building on our previously introduced multicell Monte Carlo … read more NOT USED (high confidence) J. Hur, “Modified potential for atomistic simulation of the growth of carbon materials from binary alloy catalysts.,” Physical chemistry chemical physics : PCCP. 2019. link Times cited: 3 Abstract: A new hybrid bond order potential has been developed and imp… read more NOT USED (high confidence) D. Aksoy, R. Dingreville, and D. Spearot, “An embedded-atom method potential parameterized for sulfur-induced embrittlement of nickel,” Modelling and Simulation in Materials Science and Engineering. 2019. link Times cited: 4 Abstract: The embrittling or strengthening effect of solute atoms at g… read more NOT USED (high confidence) D. Spearot, G. Tucker, A. K. Gupta, and G. Thompson, “Mechanical properties of stabilized nanocrystalline FCC metals,” Journal of Applied Physics. 2019. link Times cited: 13 Abstract: In this perspective, recent advances and current research ch… read more NOT USED (high confidence) Y. Su, S. Xu, and I. Beyerlein, “Density functional theory calculations of generalized stacking fault energy surfaces for eight face-centered cubic transition metals,” Journal of Applied Physics. 2019. link Times cited: 38 Abstract: In this work, we use density functional theory to calculate … read more NOT USED (high confidence) M. Zouini, S. Khamlich, and W. Dimassi, “Bismuth induced crystallization of hydrogenated amorphous silicon thin films: effect of annealing time,” Journal of Materials Science: Materials in Electronics. 2019. link Times cited: 0 |
| Funding | Not available |
| Short KIM ID
The unique KIM identifier code.
| MO_946831081299_000 |
| Extended KIM ID
The long form of the KIM ID including a human readable prefix (100 characters max), two underscores, and the Short KIM ID. Extended KIM IDs can only contain alpha-numeric characters (letters and digits) and underscores and must begin with a letter.
| EAM_Dynamo_OBrienBarrPrice_2018_PtAu__MO_946831081299_000 |
| DOI |
10.25950/a57b36d8 https://doi.org/10.25950/a57b36d8 https://commons.datacite.org/doi.org/10.25950/a57b36d8 |
| KIM Item Type
Specifies whether this is a Portable Model (software implementation of an interatomic model); Portable Model with parameter file (parameter file to be read in by a Model Driver); Model Driver (software implementation of an interatomic model that reads in parameters).
| Portable Model using Model Driver EAM_Dynamo__MD_120291908751_005 |
| Driver | EAM_Dynamo__MD_120291908751_005 |
| KIM API Version | 2.0 |
| Potential Type | eam |
| Forked By | EAM_QuinticClampedSpline_Kim_2021_PtAu__MO_463728687265_000 |
| Grade | Name | Category | Brief Description | Full Results | Aux File(s) |
|---|---|---|---|---|---|
| P | vc-species-supported-as-stated | mandatory | The model supports all species it claims to support; see full description. |
Results | Files |
| P | vc-periodicity-support | mandatory | Periodic boundary conditions are handled correctly; see full description. |
Results | Files |
| P | vc-permutation-symmetry | mandatory | Total energy and forces are unchanged when swapping atoms of the same species; see full description. |
Results | Files |
| C | vc-forces-numerical-derivative | consistency | Forces computed by the model agree with numerical derivatives of the energy; see full description. |
Results | Files |
| F | vc-dimer-continuity-c1 | informational | The energy versus separation relation of a pair of atoms is C1 continuous (i.e. the function and its first derivative are continuous); see full description. |
Results | Files |
| P | vc-objectivity | informational | Total energy is unchanged and forces transform correctly under rigid-body translation and rotation; see full description. |
Results | Files |
| P | vc-inversion-symmetry | informational | Total energy is unchanged and forces change sign when inverting a configuration through the origin; see full description. |
Results | Files |
| N/A | vc-memory-leak | informational | The model code does not have memory leaks (i.e. it releases all allocated memory at the end); see full description. |
Results | Files |
| P | vc-thread-safe | mandatory | The model returns the same energy and forces when computed in serial and when using parallel threads for a set of configurations. Note that this is not a guarantee of thread safety; see full description. |
Results | Files |
| P | vc-unit-conversion | mandatory | The model is able to correctly convert its energy and/or forces to different unit sets; see full description. |
Results | Files |
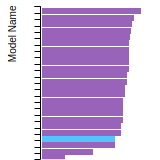
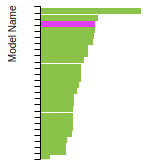
BCC Lattice Constant
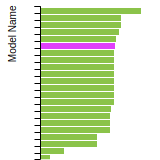
This bar chart plot shows the mono-atomic body-centered cubic (bcc) lattice constant predicted by the current model (shown in the unique color) compared with the predictions for all other models in the OpenKIM Repository that support the species. The vertical bars show the average and standard deviation (one sigma) bounds for all model predictions. Graphs are generated for each species supported by the model.
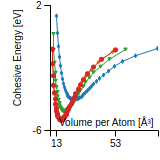
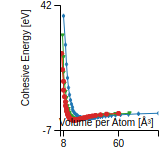
Cohesive Energy Graph
This graph shows the cohesive energy versus volume-per-atom for the current mode for four mono-atomic cubic phases (body-centered cubic (bcc), face-centered cubic (fcc), simple cubic (sc), and diamond). The curve with the lowest minimum is the ground state of the crystal if stable. (The crystal structure is enforced in these calculations, so the phase may not be stable.) Graphs are generated for each species supported by the model.
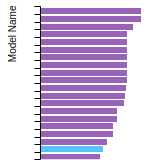
Diamond Lattice Constant
This bar chart plot shows the mono-atomic face-centered diamond lattice constant predicted by the current model (shown in the unique color) compared with the predictions for all other models in the OpenKIM Repository that support the species. The vertical bars show the average and standard deviation (one sigma) bounds for all model predictions. Graphs are generated for each species supported by the model.
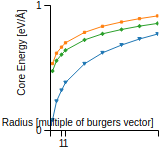
Dislocation Core Energies
This graph shows the dislocation core energy of a cubic crystal at zero temperature and pressure for a specific set of dislocation core cutoff radii. After obtaining the total energy of the system from conjugate gradient minimizations, non-singular, isotropic and anisotropic elasticity are applied to obtain the dislocation core energy for each of these supercells with different dipole distances. Graphs are generated for each species supported by the model.
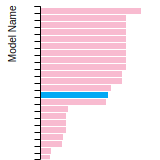
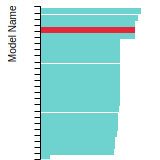
FCC Elastic Constants
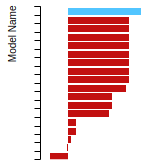
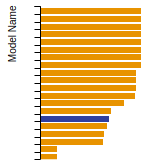
This bar chart plot shows the mono-atomic face-centered cubic (fcc) elastic constants predicted by the current model (shown in blue) compared with the predictions for all other models in the OpenKIM Repository that support the species. The vertical bars show the average and standard deviation (one sigma) bounds for all model predictions. Graphs are generated for each species supported by the model.
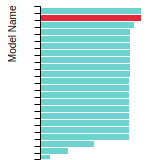
FCC Lattice Constant
This bar chart plot shows the mono-atomic face-centered cubic (fcc) lattice constant predicted by the current model (shown in red) compared with the predictions for all other models in the OpenKIM Repository that support the species. The vertical bars show the average and standard deviation (one sigma) bounds for all model predictions. Graphs are generated for each species supported by the model.
FCC Stacking Fault Energies
This bar chart plot shows the intrinsic and extrinsic stacking fault energies as well as the unstable stacking and unstable twinning energies for face-centered cubic (fcc) predicted by the current model (shown in blue) compared with the predictions for all other models in the OpenKIM Repository that support the species. The vertical bars show the average and standard deviation (one sigma) bounds for all model predictions. Graphs are generated for each species supported by the model.
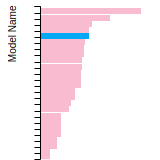
FCC Surface Energies
This bar chart plot shows the mono-atomic face-centered cubic (fcc) relaxed surface energies predicted by the current model (shown in blue) compared with the predictions for all other models in the OpenKIM Repository that support the species. The vertical bars show the average and standard deviation (one sigma) bounds for all model predictions. Graphs are generated for each species supported by the model.

SC Lattice Constant
This bar chart plot shows the mono-atomic simple cubic (sc) lattice constant predicted by the current model (shown in the unique color) compared with the predictions for all other models in the OpenKIM Repository that support the species. The vertical bars show the average and standard deviation (one sigma) bounds for all model predictions. Graphs are generated for each species supported by the model.
Cubic Crystal Basic Properties Table
Species: AuSpecies: Pt
Creators:
Contributor: karls
Publication Year: 2019
DOI: https://doi.org/10.25950/64cb38c5
This Test Driver uses LAMMPS to compute the cohesive energy of a given monoatomic cubic lattice (fcc, bcc, sc, or diamond) at a variety of lattice spacings. The lattice spacings range from a_min (=a_min_frac*a_0) to a_max (=a_max_frac*a_0) where a_0, a_min_frac, and a_max_frac are read from stdin (a_0 is typically approximately equal to the equilibrium lattice constant). The precise scaling and number of lattice spacings sampled between a_min and a_0 (a_0 and a_max) is specified by two additional parameters passed from stdin: N_lower and samplespacing_lower (N_upper and samplespacing_upper). Please see README.txt for further details.
| Test | Test Results | Link to Test Results page | Benchmark time
Usertime multiplied by the Whetstone Benchmark. This number can be used (approximately) to compare the performance of different models independently of the architecture on which the test was run.
Measured in Millions of Whetstone Instructions (MWI) |
|---|---|---|---|
| Cohesive energy versus lattice constant curve for bcc Au v004 | view | 8498 | |
| Cohesive energy versus lattice constant curve for bcc Pt v004 | view | 5799 | |
| Cohesive energy versus lattice constant curve for diamond Au v004 | view | 7241 | |
| Cohesive energy versus lattice constant curve for diamond Pt v004 | view | 6773 | |
| Cohesive energy versus lattice constant curve for fcc Au v004 | view | 6714 | |
| Cohesive energy versus lattice constant curve for fcc Pt v004 | view | 5679 | |
| Cohesive energy versus lattice constant curve for sc Au v004 | view | 6783 | |
| Cohesive energy versus lattice constant curve for sc Pt v004 | view | 6847 |
Creators:
Contributor: qyc081025
Publication Year: 2023
DOI: https://doi.org/10.25950/ebecf626
This Test Driver computes the dislocation core energy of a cubic crystal at zero temperature and pressure for a specific set of dislocation core cutoff radii. First, it generates several periodic atomistic supercells containing a dislocation dipole. After obtaining the total energy of the system from conjugate gradient minimizations, non-singular, isotropic and anisotropic elasticity are applied to obtain the dislocation core energy for each of these supercells with different dipole distances. The supercell is increased in size until the disolcation core energy converges. Finally, after checking the independence of the results from the simulation cell geometry, the dislocation core energies are determined for each dislocation core radius.
| Test | Test Results | Link to Test Results page | Benchmark time
Usertime multiplied by the Whetstone Benchmark. This number can be used (approximately) to compare the performance of different models independently of the architecture on which the test was run.
Measured in Millions of Whetstone Instructions (MWI) |
|---|---|---|---|
| Dislocation core energy for fcc Pt computed at zero temperature for a set of dislocation core cutoff radii with burgers vector [0.5, 0.5, 0] along line direction [1, 1, 0] v000 | view | 12593375 |
Creators: Junhao Li and Ellad Tadmor
Contributor: tadmor
Publication Year: 2019
DOI: https://doi.org/10.25950/5853fb8f
Computes the cubic elastic constants for some common crystal types (fcc, bcc, sc, diamond) by calculating the hessian of the energy density with respect to strain. An estimate of the error associated with the numerical differentiation performed is reported.
| Test | Test Results | Link to Test Results page | Benchmark time
Usertime multiplied by the Whetstone Benchmark. This number can be used (approximately) to compare the performance of different models independently of the architecture on which the test was run.
Measured in Millions of Whetstone Instructions (MWI) |
|---|---|---|---|
| Elastic constants for bcc Au at zero temperature v006 | view | 6526 | |
| Elastic constants for bcc Pt at zero temperature v006 | view | 1983 | |
| Elastic constants for fcc Au at zero temperature v006 | view | 1440 | |
| Elastic constants for fcc Pt at zero temperature v006 | view | 4159 | |
| Elastic constants for sc Au at zero temperature v006 | view | 2047 | |
| Elastic constants for sc Pt at zero temperature v006 | view | 4255 |
Creators: Junhao Li
Contributor: jl2922
Publication Year: 2019
DOI: https://doi.org/10.25950/d794c746
Computes the elastic constants for hcp crystals by calculating the hessian of the energy density with respect to strain. An estimate of the error associated with the numerical differentiation performed is reported.
| Test | Test Results | Link to Test Results page | Benchmark time
Usertime multiplied by the Whetstone Benchmark. This number can be used (approximately) to compare the performance of different models independently of the architecture on which the test was run.
Measured in Millions of Whetstone Instructions (MWI) |
|---|---|---|---|
| Elastic constants for hcp Au at zero temperature v004 | view | 1433 | |
| Elastic constants for hcp Pt at zero temperature v004 | view | 1783 |
Creators:
Contributor: ilia
Publication Year: 2023
DOI: https://doi.org/10.25950/e8a7ed84
Computes the equilibrium crystal structure and energy for an arbitrary crystal at zero temperature and applied stress by performing symmetry-constrained relaxation. The crystal structure is specified using the AFLOW prototype designation. Multiple sets of free parameters corresponding to the crystal prototype may be specified as initial guesses for structure optimization. No guarantee is made regarding the stability of computed equilibria, nor that any are the ground state.
| Test | Test Results | Link to Test Results page | Benchmark time
Usertime multiplied by the Whetstone Benchmark. This number can be used (approximately) to compare the performance of different models independently of the architecture on which the test was run.
Measured in Millions of Whetstone Instructions (MWI) |
|---|---|---|---|
| Equilibrium crystal structure and energy for Au in AFLOW crystal prototype A_cF4_225_a v001 | view | 84884 |
Creators:
Contributor: ilia
Publication Year: 2024
DOI: https://doi.org/10.25950/2f2c4ad3
Computes the equilibrium crystal structure and energy for an arbitrary crystal at zero temperature and applied stress by performing symmetry-constrained relaxation. The crystal structure is specified using the AFLOW prototype designation. Multiple sets of free parameters corresponding to the crystal prototype may be specified as initial guesses for structure optimization. No guarantee is made regarding the stability of computed equilibria, nor that any are the ground state.
| Test | Test Results | Link to Test Results page | Benchmark time
Usertime multiplied by the Whetstone Benchmark. This number can be used (approximately) to compare the performance of different models independently of the architecture on which the test was run.
Measured in Millions of Whetstone Instructions (MWI) |
|---|---|---|---|
| Equilibrium crystal structure and energy for Pt in AFLOW crystal prototype A_cF4_225_a v002 | view | 65195 |
Creators:
Contributor: brunnels
Publication Year: 2022
DOI: https://doi.org/10.25950/2c59c9d6
Computes grain boundary energy for a range of tilt angles given a crystal structure, tilt axis, and material.
| Test | Test Results | Link to Test Results page | Benchmark time
Usertime multiplied by the Whetstone Benchmark. This number can be used (approximately) to compare the performance of different models independently of the architecture on which the test was run.
Measured in Millions of Whetstone Instructions (MWI) |
|---|---|---|---|
| Relaxed energy as a function of tilt angle for a 111 symmetric tilt grain boundary in fcc Au v000 | view | 8949308 | |
| Relaxed energy as a function of tilt angle for a 112 symmetric tilt grain boundary in fcc Au v000 | view | 35466381 |
Creators: Daniel S. Karls and Junhao Li
Contributor: karls
Publication Year: 2019
DOI: https://doi.org/10.25950/2765e3bf
Equilibrium lattice constant and cohesive energy of a cubic lattice at zero temperature and pressure.
| Test | Test Results | Link to Test Results page | Benchmark time
Usertime multiplied by the Whetstone Benchmark. This number can be used (approximately) to compare the performance of different models independently of the architecture on which the test was run.
Measured in Millions of Whetstone Instructions (MWI) |
|---|---|---|---|
| Equilibrium zero-temperature lattice constant for bcc Au v007 | view | 1887 | |
| Equilibrium zero-temperature lattice constant for bcc Pt v007 | view | 1951 | |
| Equilibrium zero-temperature lattice constant for diamond Au v007 | view | 2527 | |
| Equilibrium zero-temperature lattice constant for diamond Pt v007 | view | 2911 | |
| Equilibrium zero-temperature lattice constant for fcc Au v007 | view | 3263 | |
| Equilibrium zero-temperature lattice constant for fcc Pt v007 | view | 2559 | |
| Equilibrium zero-temperature lattice constant for sc Au v007 | view | 2047 | |
| Equilibrium zero-temperature lattice constant for sc Pt v007 | view | 2687 |
Creators: Daniel S. Karls and Junhao Li
Contributor: karls
Publication Year: 2019
DOI: https://doi.org/10.25950/c339ca32
Calculates lattice constant of hexagonal bulk structures at zero temperature and pressure by using simplex minimization to minimize the potential energy.
| Test | Test Results | Link to Test Results page | Benchmark time
Usertime multiplied by the Whetstone Benchmark. This number can be used (approximately) to compare the performance of different models independently of the architecture on which the test was run.
Measured in Millions of Whetstone Instructions (MWI) |
|---|---|---|---|
| Equilibrium lattice constants for hcp Au v005 | view | 15122 | |
| Equilibrium lattice constants for hcp Pt v005 | view | 15154 |
Creators: Mingjian Wen
Contributor: mjwen
Publication Year: 2019
DOI: https://doi.org/10.25950/fc69d82d
This Test Driver uses LAMMPS to compute the linear thermal expansion coefficient at a finite temperature under a given pressure for a cubic lattice (fcc, bcc, sc, diamond) of a single given species.
| Test | Test Results | Link to Test Results page | Benchmark time
Usertime multiplied by the Whetstone Benchmark. This number can be used (approximately) to compare the performance of different models independently of the architecture on which the test was run.
Measured in Millions of Whetstone Instructions (MWI) |
|---|---|---|---|
| Linear thermal expansion coefficient of fcc Au at 293.15 K under a pressure of 0 MPa v001 | view | 4401590 |
Creators:
Contributor: mjwen
Publication Year: 2024
DOI: https://doi.org/10.25950/9d9822ec
This Test Driver uses LAMMPS to compute the linear thermal expansion coefficient at a finite temperature under a given pressure for a cubic lattice (fcc, bcc, sc, diamond) of a single given species.
| Test | Test Results | Link to Test Results page | Benchmark time
Usertime multiplied by the Whetstone Benchmark. This number can be used (approximately) to compare the performance of different models independently of the architecture on which the test was run.
Measured in Millions of Whetstone Instructions (MWI) |
|---|---|---|---|
| Linear thermal expansion coefficient of fcc Pt at 293.15 K under a pressure of 0 MPa v002 | view | 635271 |
Creators: Matt Bierbaum
Contributor: mattbierbaum
Publication Year: 2019
DOI: https://doi.org/10.25950/64f4999b
Calculates the phonon dispersion relations for fcc lattices and records the results as curves.
| Test | Test Results | Link to Test Results page | Benchmark time
Usertime multiplied by the Whetstone Benchmark. This number can be used (approximately) to compare the performance of different models independently of the architecture on which the test was run.
Measured in Millions of Whetstone Instructions (MWI) |
|---|---|---|---|
| Phonon dispersion relations for fcc Au v004 | view | 51918 | |
| Phonon dispersion relations for fcc Pt v004 | view | 45104 |
Creators:
Contributor: SubrahmanyamPattamatta
Publication Year: 2019
DOI: https://doi.org/10.25950/b4cfaf9a
Intrinsic and extrinsic stacking fault energies, unstable stacking fault energy, unstable twinning energy, stacking fault energy as a function of fractional displacement, and gamma surface for a monoatomic FCC lattice at zero temperature and pressure.
| Test | Test Results | Link to Test Results page | Benchmark time
Usertime multiplied by the Whetstone Benchmark. This number can be used (approximately) to compare the performance of different models independently of the architecture on which the test was run.
Measured in Millions of Whetstone Instructions (MWI) |
|---|---|---|---|
| Stacking and twinning fault energies for fcc Au v002 | view | 8254154 | |
| Stacking and twinning fault energies for fcc Pt v002 | view | 4935103 |
Creators: Matt Bierbaum
Contributor: mattbierbaum
Publication Year: 2019
DOI: https://doi.org/10.25950/6c43a4e6
Calculates the surface energy of several high symmetry surfaces and produces a broken-bond model fit. In latex form, the fit equations are given by:
E_{FCC} (\vec{n}) = p_1 (4 \left( |x+y| + |x-y| + |x+z| + |x-z| + |z+y| +|z-y|\right)) + p_2 (8 \left( |x| + |y| + |z|\right)) + p_3 (2 ( |x+ 2y + z| + |x+2y-z| + |x-2y + z| + |x-2y-z| + |2x+y+z| + |2x+y-z| +|2x-y+z| +|2x-y-z| +|x+y+2z| +|x+y-2z| +|x-y+2z| +|x-y-2z| ) + c
E_{BCC} (\vec{n}) = p_1 (6 \left( | x+y+z| + |x+y-z| + |-x+y-z| + |x-y+z| \right)) + p_2 (8 \left( |x| + |y| + |z|\right)) + p_3 (4 \left( |x+y| + |x-y| + |x+z| + |x-z| + |z+y| +|z-y|\right)) +c.
In Python, these two fits take the following form:
def BrokenBondFCC(params, index):
import numpy
x, y, z = index
x = x / numpy.sqrt(x**2.+y**2.+z**2.)
y = y / numpy.sqrt(x**2.+y**2.+z**2.)
z = z / numpy.sqrt(x**2.+y**2.+z**2.)
return params[0]*4* (abs(x+y) + abs(x-y) + abs(x+z) + abs(x-z) + abs(z+y) + abs(z-y)) + params[1]*8*(abs(x) + abs(y) + abs(z)) + params[2]*(abs(x+2*y+z) + abs(x+2*y-z) +abs(x-2*y+z) +abs(x-2*y-z) + abs(2*x+y+z) +abs(2*x+y-z) +abs(2*x-y+z) +abs(2*x-y-z) + abs(x+y+2*z) +abs(x+y-2*z) +abs(x-y+2*z) +abs(x-y-2*z))+params[3]
def BrokenBondBCC(params, x, y, z):
import numpy
x, y, z = index
x = x / numpy.sqrt(x**2.+y**2.+z**2.)
y = y / numpy.sqrt(x**2.+y**2.+z**2.)
z = z / numpy.sqrt(x**2.+y**2.+z**2.)
return params[0]*6*(abs(x+y+z) + abs(x-y-z) + abs(x-y+z) + abs(x+y-z)) + params[1]*8*(abs(x) + abs(y) + abs(z)) + params[2]*4* (abs(x+y) + abs(x-y) + abs(x+z) + abs(x-z) + abs(z+y) + abs(z-y)) + params[3]
| Test | Test Results | Link to Test Results page | Benchmark time
Usertime multiplied by the Whetstone Benchmark. This number can be used (approximately) to compare the performance of different models independently of the architecture on which the test was run.
Measured in Millions of Whetstone Instructions (MWI) |
|---|---|---|---|
| Broken-bond fit of high-symmetry surface energies in fcc Au v004 | view | 30965 | |
| Broken-bond fit of high-symmetry surface energies in fcc Pt v004 | view | 25591 |
Creators:
Contributor: efuem
Publication Year: 2023
DOI: https://doi.org/10.25950/fca89cea
Computes the monovacancy formation energy and relaxation volume for cubic and hcp monoatomic crystals.
| Test | Test Results | Link to Test Results page | Benchmark time
Usertime multiplied by the Whetstone Benchmark. This number can be used (approximately) to compare the performance of different models independently of the architecture on which the test was run.
Measured in Millions of Whetstone Instructions (MWI) |
|---|---|---|---|
| Monovacancy formation energy and relaxation volume for fcc Au | view | 316715 | |
| Monovacancy formation energy and relaxation volume for fcc Pt | view | 383342 |
Creators:
Contributor: efuem
Publication Year: 2023
DOI: https://doi.org/10.25950/c27ba3cd
Computes the monovacancy formation and migration energies for cubic and hcp monoatomic crystals.
| Test | Test Results | Link to Test Results page | Benchmark time
Usertime multiplied by the Whetstone Benchmark. This number can be used (approximately) to compare the performance of different models independently of the architecture on which the test was run.
Measured in Millions of Whetstone Instructions (MWI) |
|---|---|---|---|
| Vacancy formation and migration energy for fcc Au | view | 2802880 | |
| Vacancy formation and migration energy for fcc Pt | view | 1545736 |
| Test | Error Categories | Link to Error page |
|---|---|---|
| Elastic constants for diamond Au at zero temperature v001 | other | view |
| Elastic constants for diamond Pt at zero temperature v001 | other | view |
GrainBoundaryCubicCrystalSymmetricTiltRelaxedEnergyVsAngle__TD_410381120771_003
LatticeConstantCubicEnergy__TD_475411767977_006
| Test | Error Categories | Link to Error page |
|---|---|---|
| Equilibrium zero-temperature lattice constant for bcc Pt | other | view |
| Equilibrium zero-temperature lattice constant for diamond Au | other | view |
LatticeConstantHexagonalEnergy__TD_942334626465_004
| Test | Error Categories | Link to Error page |
|---|---|---|
| Equilibrium lattice constants for hcp Au | other | view |
| Equilibrium lattice constants for hcp Pt | other | view |
| EAM_Dynamo_OBrienBarrPrice_2018_PtAu__MO_946831081299_000.txz | Tar+XZ | Linux and OS X archive |
| EAM_Dynamo_OBrienBarrPrice_2018_PtAu__MO_946831081299_000.zip | Zip | Windows archive |
This Model requires a Model Driver. Archives for the Model Driver EAM_Dynamo__MD_120291908751_005 appear below.
| EAM_Dynamo__MD_120291908751_005.txz | Tar+XZ | Linux and OS X archive |
| EAM_Dynamo__MD_120291908751_005.zip | Zip | Windows archive |
1. Inconsistency in parameters
Line 5 of an EAM file in setfl format lists Nrho, drho, Nr, dr, cutoff, where Nrho is the number of tabulated values for embedding function and Nr is the number of tabulated values for electron density function and pair energy function in the subsequent arrays, drho is the spacing in electron density for embedding energy and dr is the distance space for electron density function and pair energy function, and cutoff is the global cutoff radius for both electron density function and pair energy function. The maximum electron density for embedding energy, rhomax, is 50 [1]. These variables should meet the following relations:
and
However, the values in the parameter file (PtAu.eam.alloy), which are
5000 1.000000000000e-02 5000 1.150000000000e-03 5.750000000000,
do not satisfy these relations.
2. Discontinuity issue
The model does not pass the continuity test (vc-dimer-continuity-c1) because the electron density and pair energy functions change too abruptly toward the cutoff radius.
References
[1] O’Brien CJ, Barr CM, Price PM, Hattar K, Foiles SM. Grain boundary phase transformations in PtAu and relevance to thermal stabilization of bulk nanocrystalline metals, Journal of Materials Science, 53, 2911–2927, 2018.
Login to edit Wiki content
Wiki Contributors
| 2021-01-11T13:08:53.346116 | kwk4814 |