 EAM_IMD_SchopfBrommerFrigan_2012_AlMnPd__MO_878712978062_003
| Title
A single sentence description.
|
EAM potential (IMD tabulation) for the Al-Mn-Pd system developed by Schopf et al. (2012) v003 |
|---|---|
| Description
A short description of the Model describing its key features including for example: type of model (pair potential, 3-body potential, EAM, etc.), modeled species (Ac, Ag, ..., Zr), intended purpose, origin, and so on.
|
EAM potential for the Ξ phases of Al-Mn-Pd developed by Schopf et al. (2012) using the force-matching method. Different combinations of analytic functions were tested for the pair and transfer part. The best results are obtained if one allows for oscillations on two different length scales. These potentials stabilize structural models of the Ξ phases and describe their energy with high accuracy. Simulations at temperatures up to 1200 K show very good agreement with ab initio results with respect to stability and dynamics of the system. |
| Species
The supported atomic species.
| Al, Mn, Pd |
| Disclaimer
A statement of applicability provided by the contributor, informing users of the intended use of this KIM Item.
|
None |
| Contributor |
Daniel Schopf |
| Maintainer |
Daniel Schopf |
| Developer |
Benjamin Frigan Hans-Rainer Trebin Peter Brommer Daniel Schopf |
| Published on KIM | 2018 |
| How to Cite |
This Model originally published in [1] is archived in OpenKIM [2-5]. [1] Schopf D, Brommer P, Frigan B, Trebin H-R. Embedded atom method potentials for Al-Pd-Mn phases. Physical Review B. 2012;85(5):054201. doi:10.1103/PhysRevB.85.054201 — (Primary Source) A primary source is a reference directly related to the item documenting its development, as opposed to other sources that are provided as background information. [2] Frigan B, Trebin H-R, Brommer P, Schopf D. EAM potential (IMD tabulation) for the Al-Mn-Pd system developed by Schopf et al. (2012) v003. OpenKIM; 2018. doi:10.25950/769f29cf [3] Schopf D, Roth J. EAM implementation from the IMD code v003. OpenKIM; 2018. doi:10.25950/e28996e9 [4] Tadmor EB, Elliott RS, Sethna JP, Miller RE, Becker CA. The potential of atomistic simulations and the Knowledgebase of Interatomic Models. JOM. 2011;63(7):17. doi:10.1007/s11837-011-0102-6 [5] Elliott RS, Tadmor EB. Knowledgebase of Interatomic Models (KIM) Application Programming Interface (API). OpenKIM; 2011. doi:10.25950/ff8f563a Click here to download the above citation in BibTeX format. |
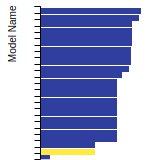
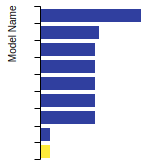
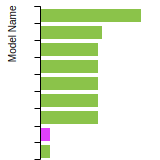
| Citations
This panel presents information regarding the papers that have cited the interatomic potential (IP) whose page you are on. The OpenKIM machine learning based Deep Citation framework is used to determine whether the citing article actually used the IP in computations (denoted by "USED") or only provides it as a background citation (denoted by "NOT USED"). For more details on Deep Citation and how to work with this panel, click the documentation link at the top of the panel. The word cloud to the right is generated from the abstracts of IP principle source(s) (given below in "How to Cite") and the citing articles that were determined to have used the IP in order to provide users with a quick sense of the types of physical phenomena to which this IP is applied. The bar chart shows the number of articles that cited the IP per year. Each bar is divided into green (articles that USED the IP) and blue (articles that did NOT USE the IP). Users are encouraged to correct Deep Citation errors in determination by clicking the speech icon next to a citing article and providing updated information. This will be integrated into the next Deep Citation learning cycle, which occurs on a regular basis. OpenKIM acknowledges the support of the Allen Institute for AI through the Semantic Scholar project for providing citation information and full text of articles when available, which are used to train the Deep Citation ML algorithm. |
This panel provides information on past usage of this interatomic potential (IP) powered by the OpenKIM Deep Citation framework. The word cloud indicates typical applications of the potential. The bar chart shows citations per year of this IP (bars are divided into articles that used the IP (green) and those that did not (blue)). The complete list of articles that cited this IP is provided below along with the Deep Citation determination on usage. See the Deep Citation documentation for more information. 
23 Citations (8 used)
Help us to determine which of the papers that cite this potential actually used it to perform calculations. If you know, click the .
USED (low confidence) T. Yang, X. Han, W. Li, X. Chen, and P. Liu, “Angular dependent potential for Al-Zr binary system to study the initial heterogeneous nucleation behavior of liquid Al on L12-Al3Zr,” Computational Materials Science. 2023. link Times cited: 0 USED (low confidence) H. Wang et al., “Zn content mediated fibrinogen adsorption on biodegradable Mg-Zn alloys surfaces,” Journal of Magnesium and Alloys. 2021. link Times cited: 8 USED (low confidence) H. Wang et al., “Effects of alloy elements on adsorption of fibrinogen on biodegradable magnesium alloys surfaces: The MD simulations and experimental studies,” Applied Surface Science. 2020. link Times cited: 8 USED (low confidence) H. N. Pishkenari, F. S. Yousefi, and A. Taghibakhshi, “Determination of surface properties and elastic constants of FCC metals: a comparison among different EAM potentials in thin film and bulk scale,” Materials Research Express. 2018. link Times cited: 22 Abstract: Three independent elastic constants C11, C12, and C44 were c… read more USED (low confidence) G.-U. Jeong, C. S. Park, H.-S. Do, S.-M. Park, and B.-J. Lee, “Second nearest-neighbor modified embedded-atom method interatomic potentials for the Pd-M (M = Al, Co, Cu, Fe, Mo, Ni, Ti) binary systems,” Calphad. 2018. link Times cited: 12 USED (low confidence) J.-S. Kim, D. Seol, J. Ji, H.-S. Jang, Y. Kim, and B.-J. Lee, “Second nearest-neighbor modified embedded-atom method interatomic potentials for the Pt-M (M = Al, Co, Cu, Mo, Ni, Ti, V) binary systems,” Calphad-computer Coupling of Phase Diagrams and Thermochemistry. 2017. link Times cited: 31 USED (low confidence) B. Dong, S.-xiong Zhou, J. Qin, S. Pan, and Z.-bang Li, “The influence of clusters in the melt of Fe80Si10B10 alloy on the subsequent glass-formation,” Progress in Natural Science: Materials International. 2013. link Times cited: 17 USED (low confidence) B. Dong et al., “Effects of solute–solute avoidance on metallic glass formation,” Journal of Non-crystalline Solids. 2012. link Times cited: 20 NOT USED (low confidence) Y. Lei et al., “An Embedded-Atom Method Potential for studying the properties of Fe-Pb solid-liquid interface,” Journal of Nuclear Materials. 2022. link Times cited: 1 NOT USED (low confidence) J. Chen et al., “Effects of Alloying Concentration on the Aqueous Corrosion and Passivation of Aluminum-Manganese-Molybdenum Concentrated Alloys,” Corrosion Science. 2022. link Times cited: 10 NOT USED (low confidence) Y. Lei, X. Sun, R. Zhou, and B. Zhang, “Embedded atom method potentials for Ce-Ni binary alloy,” Computational Materials Science. 2018. link Times cited: 4 NOT USED (low confidence) H. Gao, B. Dong, and S.-xiong Zhou, “Advances in Investigation of Fe-based Glass-forming Alloy Melts,” Journal of Iron and Steel Research International. 2016. link Times cited: 3 NOT USED (low confidence) S. Kalidindi, J. A. Gomberg, Z. Trautt, and C. Becker, “Application of data science tools to quantify and distinguish between structures and models in molecular dynamics datasets,” Nanotechnology. 2015. link Times cited: 39 Abstract: Structure quantification is key to successful mining and ext… read more NOT USED (low confidence) D. Schopf, H. Euchner, and H. Trebin, “Effective potentials for simulations of the thermal conductivity of type-I semiconductor clathrate systems,” Physical Review B. 2014. link Times cited: 13 NOT USED (low confidence) С. Волегов, Р. М. Герасимов, and Р. П. Давлятшин, “MODELS OF MOLECULAR DYNAMICS: A REVIEW OF EAM-POTENTIALS. PART 2. POTENTIALS FOR MULTI-COMPONENT SYSTEMS.” 2018. link Times cited: 1 Abstract: Получена: 18 мая 2018 г. Принята: 25 июня 2018 г. Опубликова… read more NOT USED (high confidence) B. Waters, D. S. Karls, I. Nikiforov, R. Elliott, E. Tadmor, and B. Runnels, “Automated determination of grain boundary energy and potential-dependence using the OpenKIM framework,” Computational Materials Science. 2022. link Times cited: 5 NOT USED (high confidence) Y. Lei, D. Li, R. Zhou, and B. Zhang, “Embedded atom method potentials for La-Al-Ni ternary alloy,” Journal of Applied Physics. 2019. link Times cited: 2 Abstract: Based on a series of the first-principles and experimental d… read more NOT USED (high confidence) S. Hocker, H. Lipp, E. Eisfeld, S. Schmauder, and J. Roth, “Precipitation strengthening in Cu-Ni-Si alloys modeled with ab initio based interatomic potentials.,” The Journal of chemical physics. 2018. link Times cited: 3 Abstract: Effective interaction potentials suitable for Cu/δ-Ni2Si and… read more NOT USED (high confidence) H. Mu, B. Xu, C. Ouyang, and X. Lei, “Highly optimized embedding atom method potential for Pt-Cu alloys,” Journal of Alloys and Compounds. 2017. link Times cited: 6 NOT USED (high confidence) D. Smirnova et al., “Atomistic modeling of the self-diffusion in γ-U and γ-U-Mo,” The Physics of Metals and Metallography. 2015. link Times cited: 31 NOT USED (high confidence) P. Brommer, A. Kiselev, D. Schopf, P. Beck, J. Roth, and H. Trebin, “Classical interaction potentials for diverse materials from ab initio data: a review of potfit,” Modelling and Simulation in Materials Science and Engineering. 2014. link Times cited: 76 Abstract: Force matching is an established technique to generate effec… read more NOT USED (high confidence) K. Choudhary et al., “Charge optimized many-body potential for aluminum,” Journal of Physics: Condensed Matter. 2014. link Times cited: 19 Abstract: An interatomic potential for Al is developed within the thir… read more NOT USED (definite) H. Chen, B. Dong, S.-xiong Zhou, X. Li, and J. Qin, “Structural, magnetic, and electronic properties of Fe82Si4B10P4 metallic glass,” Scientific Reports. 2018. link Times cited: 17 |
| Funding | Not available |
| Short KIM ID
The unique KIM identifier code.
| MO_878712978062_003 |
| Extended KIM ID
The long form of the KIM ID including a human readable prefix (100 characters max), two underscores, and the Short KIM ID. Extended KIM IDs can only contain alpha-numeric characters (letters and digits) and underscores and must begin with a letter.
| EAM_IMD_SchopfBrommerFrigan_2012_AlMnPd__MO_878712978062_003 |
| DOI |
10.25950/769f29cf https://doi.org/10.25950/769f29cf https://commons.datacite.org/doi.org/10.25950/769f29cf |
| KIM Item Type
Specifies whether this is a Portable Model (software implementation of an interatomic model); Portable Model with parameter file (parameter file to be read in by a Model Driver); Model Driver (software implementation of an interatomic model that reads in parameters).
| Portable Model using Model Driver EAM_IMD__MD_113599595631_003 |
| Driver | EAM_IMD__MD_113599595631_003 |
| KIM API Version | 2.0 |
| Potential Type | eam |
| Previous Version | EAM_IMD_SchopfBrommerFrigan_2012_AlMnPd__MO_878712978062_002 |
| Grade | Name | Category | Brief Description | Full Results | Aux File(s) |
|---|---|---|---|---|---|
| P | vc-species-supported-as-stated | mandatory | The model supports all species it claims to support; see full description. |
Results | Files |
| P | vc-periodicity-support | mandatory | Periodic boundary conditions are handled correctly; see full description. |
Results | Files |
| P | vc-permutation-symmetry | mandatory | Total energy and forces are unchanged when swapping atoms of the same species; see full description. |
Results | Files |
| B | vc-forces-numerical-derivative | consistency | Forces computed by the model agree with numerical derivatives of the energy; see full description. |
Results | Files |
| F | vc-dimer-continuity-c1 | informational | The energy versus separation relation of a pair of atoms is C1 continuous (i.e. the function and its first derivative are continuous); see full description. |
Results | Files |
| P | vc-objectivity | informational | Total energy is unchanged and forces transform correctly under rigid-body translation and rotation; see full description. |
Results | Files |
| P | vc-inversion-symmetry | informational | Total energy is unchanged and forces change sign when inverting a configuration through the origin; see full description. |
Results | Files |
| P | vc-memory-leak | informational | The model code does not have memory leaks (i.e. it releases all allocated memory at the end); see full description. |
Results | Files |
| P | vc-thread-safe | mandatory | The model returns the same energy and forces when computed in serial and when using parallel threads for a set of configurations. Note that this is not a guarantee of thread safety; see full description. |
Results | Files |
| N/A | vc-unit-conversion | mandatory | The model is able to correctly convert its energy and/or forces to different unit sets; see full description. |
Results | Files |
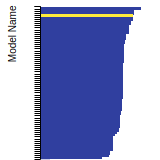
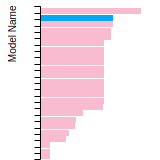
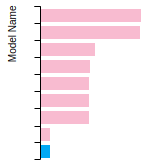
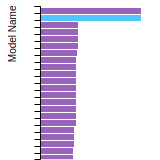
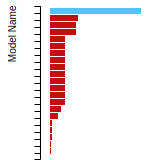
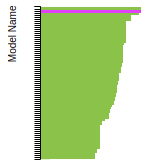
BCC Lattice Constant
This bar chart plot shows the mono-atomic body-centered cubic (bcc) lattice constant predicted by the current model (shown in the unique color) compared with the predictions for all other models in the OpenKIM Repository that support the species. The vertical bars show the average and standard deviation (one sigma) bounds for all model predictions. Graphs are generated for each species supported by the model.
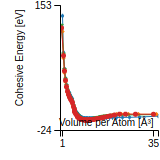
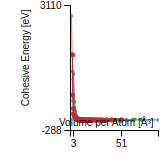
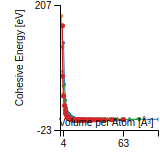
Cohesive Energy Graph
This graph shows the cohesive energy versus volume-per-atom for the current mode for four mono-atomic cubic phases (body-centered cubic (bcc), face-centered cubic (fcc), simple cubic (sc), and diamond). The curve with the lowest minimum is the ground state of the crystal if stable. (The crystal structure is enforced in these calculations, so the phase may not be stable.) Graphs are generated for each species supported by the model.
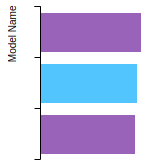
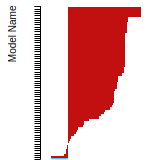
Diamond Lattice Constant
This bar chart plot shows the mono-atomic face-centered diamond lattice constant predicted by the current model (shown in the unique color) compared with the predictions for all other models in the OpenKIM Repository that support the species. The vertical bars show the average and standard deviation (one sigma) bounds for all model predictions. Graphs are generated for each species supported by the model.
Dislocation Core Energies
This graph shows the dislocation core energy of a cubic crystal at zero temperature and pressure for a specific set of dislocation core cutoff radii. After obtaining the total energy of the system from conjugate gradient minimizations, non-singular, isotropic and anisotropic elasticity are applied to obtain the dislocation core energy for each of these supercells with different dipole distances. Graphs are generated for each species supported by the model.
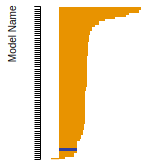
(No matching species)FCC Elastic Constants
This bar chart plot shows the mono-atomic face-centered cubic (fcc) elastic constants predicted by the current model (shown in blue) compared with the predictions for all other models in the OpenKIM Repository that support the species. The vertical bars show the average and standard deviation (one sigma) bounds for all model predictions. Graphs are generated for each species supported by the model.
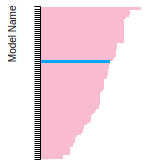
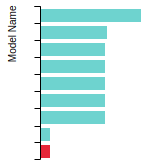
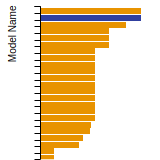
FCC Lattice Constant
This bar chart plot shows the mono-atomic face-centered cubic (fcc) lattice constant predicted by the current model (shown in red) compared with the predictions for all other models in the OpenKIM Repository that support the species. The vertical bars show the average and standard deviation (one sigma) bounds for all model predictions. Graphs are generated for each species supported by the model.
FCC Stacking Fault Energies
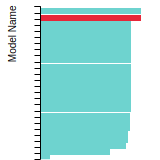
This bar chart plot shows the intrinsic and extrinsic stacking fault energies as well as the unstable stacking and unstable twinning energies for face-centered cubic (fcc) predicted by the current model (shown in blue) compared with the predictions for all other models in the OpenKIM Repository that support the species. The vertical bars show the average and standard deviation (one sigma) bounds for all model predictions. Graphs are generated for each species supported by the model.
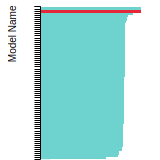
FCC Surface Energies
This bar chart plot shows the mono-atomic face-centered cubic (fcc) relaxed surface energies predicted by the current model (shown in blue) compared with the predictions for all other models in the OpenKIM Repository that support the species. The vertical bars show the average and standard deviation (one sigma) bounds for all model predictions. Graphs are generated for each species supported by the model.
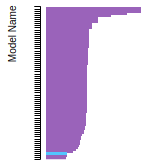
SC Lattice Constant
This bar chart plot shows the mono-atomic simple cubic (sc) lattice constant predicted by the current model (shown in the unique color) compared with the predictions for all other models in the OpenKIM Repository that support the species. The vertical bars show the average and standard deviation (one sigma) bounds for all model predictions. Graphs are generated for each species supported by the model.

Cubic Crystal Basic Properties Table
Species: AlSpecies: Mn
Species: Pd
Creators:
Contributor: karls
Publication Year: 2019
DOI: https://doi.org/10.25950/64cb38c5
This Test Driver uses LAMMPS to compute the cohesive energy of a given monoatomic cubic lattice (fcc, bcc, sc, or diamond) at a variety of lattice spacings. The lattice spacings range from a_min (=a_min_frac*a_0) to a_max (=a_max_frac*a_0) where a_0, a_min_frac, and a_max_frac are read from stdin (a_0 is typically approximately equal to the equilibrium lattice constant). The precise scaling and number of lattice spacings sampled between a_min and a_0 (a_0 and a_max) is specified by two additional parameters passed from stdin: N_lower and samplespacing_lower (N_upper and samplespacing_upper). Please see README.txt for further details.
Creators:
Contributor: ilia
Publication Year: 2024
DOI: https://doi.org/10.25950/888f9943
Computes the elastic constants for an arbitrary crystal. A robust computational protocol is used, attempting multiple methods and step sizes to achieve an acceptably low error in numerical differentiation and deviation from material symmetry. The crystal structure is specified using the AFLOW prototype designation as part of the Crystal Genome testing framework. In addition, the distance from the obtained elasticity tensor to the nearest isotropic tensor is computed.
Creators: Junhao Li and Ellad Tadmor
Contributor: tadmor
Publication Year: 2019
DOI: https://doi.org/10.25950/5853fb8f
Computes the cubic elastic constants for some common crystal types (fcc, bcc, sc, diamond) by calculating the hessian of the energy density with respect to strain. An estimate of the error associated with the numerical differentiation performed is reported.
Creators: Junhao Li
Contributor: jl2922
Publication Year: 2019
DOI: https://doi.org/10.25950/d794c746
Computes the elastic constants for hcp crystals by calculating the hessian of the energy density with respect to strain. An estimate of the error associated with the numerical differentiation performed is reported.
| Test | Test Results | Link to Test Results page | Benchmark time
Usertime multiplied by the Whetstone Benchmark. This number can be used (approximately) to compare the performance of different models independently of the architecture on which the test was run.
Measured in Millions of Whetstone Instructions (MWI) |
|---|---|---|---|
| Elastic constants for hcp Al at zero temperature v004 | view | 2101 | |
| Elastic constants for hcp Mn at zero temperature v004 | view | 1910 | |
| Elastic constants for hcp Pd at zero temperature v004 | view | 2101 |
Creators:
Contributor: ilia
Publication Year: 2024
DOI: https://doi.org/10.25950/2f2c4ad3
Computes the equilibrium crystal structure and energy for an arbitrary crystal at zero temperature and applied stress by performing symmetry-constrained relaxation. The crystal structure is specified using the AFLOW prototype designation. Multiple sets of free parameters corresponding to the crystal prototype may be specified as initial guesses for structure optimization. No guarantee is made regarding the stability of computed equilibria, nor that any are the ground state.
Creators:
Contributor: brunnels
Publication Year: 2022
DOI: https://doi.org/10.25950/2c59c9d6
Computes grain boundary energy for a range of tilt angles given a crystal structure, tilt axis, and material.
Creators: Daniel S. Karls and Junhao Li
Contributor: karls
Publication Year: 2019
DOI: https://doi.org/10.25950/2765e3bf
Equilibrium lattice constant and cohesive energy of a cubic lattice at zero temperature and pressure.
Creators: Daniel S. Karls and Junhao Li
Contributor: karls
Publication Year: 2019
DOI: https://doi.org/10.25950/c339ca32
Calculates lattice constant of hexagonal bulk structures at zero temperature and pressure by using simplex minimization to minimize the potential energy.
| Test | Test Results | Link to Test Results page | Benchmark time
Usertime multiplied by the Whetstone Benchmark. This number can be used (approximately) to compare the performance of different models independently of the architecture on which the test was run.
Measured in Millions of Whetstone Instructions (MWI) |
|---|---|---|---|
| Equilibrium lattice constants for hcp Al v005 | view | 35402 | |
| Equilibrium lattice constants for hcp Mn v005 | view | 39508 | |
| Equilibrium lattice constants for hcp Pd v005 | view | 34733 |
Creators:
Contributor: mjwen
Publication Year: 2024
DOI: https://doi.org/10.25950/9d9822ec
This Test Driver uses LAMMPS to compute the linear thermal expansion coefficient at a finite temperature under a given pressure for a cubic lattice (fcc, bcc, sc, diamond) of a single given species.
| Test | Test Results | Link to Test Results page | Benchmark time
Usertime multiplied by the Whetstone Benchmark. This number can be used (approximately) to compare the performance of different models independently of the architecture on which the test was run.
Measured in Millions of Whetstone Instructions (MWI) |
|---|---|---|---|
| Linear thermal expansion coefficient of fcc Al at 293.15 K under a pressure of 0 MPa v002 | view | 1095807 | |
| Linear thermal expansion coefficient of fcc Pd at 293.15 K under a pressure of 0 MPa v002 | view | 1409170 |
Creators: Matt Bierbaum
Contributor: mattbierbaum
Publication Year: 2019
DOI: https://doi.org/10.25950/64f4999b
Calculates the phonon dispersion relations for fcc lattices and records the results as curves.
| Test | Test Results | Link to Test Results page | Benchmark time
Usertime multiplied by the Whetstone Benchmark. This number can be used (approximately) to compare the performance of different models independently of the architecture on which the test was run.
Measured in Millions of Whetstone Instructions (MWI) |
|---|---|---|---|
| Phonon dispersion relations for fcc Al v004 | view | 50863 | |
| Phonon dispersion relations for fcc Pd v004 | view | 52110 |
Creators:
Contributor: SubrahmanyamPattamatta
Publication Year: 2019
DOI: https://doi.org/10.25950/b4cfaf9a
Intrinsic and extrinsic stacking fault energies, unstable stacking fault energy, unstable twinning energy, stacking fault energy as a function of fractional displacement, and gamma surface for a monoatomic FCC lattice at zero temperature and pressure.
| Test | Test Results | Link to Test Results page | Benchmark time
Usertime multiplied by the Whetstone Benchmark. This number can be used (approximately) to compare the performance of different models independently of the architecture on which the test was run.
Measured in Millions of Whetstone Instructions (MWI) |
|---|---|---|---|
| Stacking and twinning fault energies for fcc Al v002 | view | 11947444 | |
| Stacking and twinning fault energies for fcc Pd v002 | view | 12500725 |
Creators: Matt Bierbaum
Contributor: mattbierbaum
Publication Year: 2019
DOI: https://doi.org/10.25950/6c43a4e6
Calculates the surface energy of several high symmetry surfaces and produces a broken-bond model fit. In latex form, the fit equations are given by:
E_{FCC} (\vec{n}) = p_1 (4 \left( |x+y| + |x-y| + |x+z| + |x-z| + |z+y| +|z-y|\right)) + p_2 (8 \left( |x| + |y| + |z|\right)) + p_3 (2 ( |x+ 2y + z| + |x+2y-z| + |x-2y + z| + |x-2y-z| + |2x+y+z| + |2x+y-z| +|2x-y+z| +|2x-y-z| +|x+y+2z| +|x+y-2z| +|x-y+2z| +|x-y-2z| ) + c
E_{BCC} (\vec{n}) = p_1 (6 \left( | x+y+z| + |x+y-z| + |-x+y-z| + |x-y+z| \right)) + p_2 (8 \left( |x| + |y| + |z|\right)) + p_3 (4 \left( |x+y| + |x-y| + |x+z| + |x-z| + |z+y| +|z-y|\right)) +c.
In Python, these two fits take the following form:
def BrokenBondFCC(params, index):
import numpy
x, y, z = index
x = x / numpy.sqrt(x**2.+y**2.+z**2.)
y = y / numpy.sqrt(x**2.+y**2.+z**2.)
z = z / numpy.sqrt(x**2.+y**2.+z**2.)
return params[0]*4* (abs(x+y) + abs(x-y) + abs(x+z) + abs(x-z) + abs(z+y) + abs(z-y)) + params[1]*8*(abs(x) + abs(y) + abs(z)) + params[2]*(abs(x+2*y+z) + abs(x+2*y-z) +abs(x-2*y+z) +abs(x-2*y-z) + abs(2*x+y+z) +abs(2*x+y-z) +abs(2*x-y+z) +abs(2*x-y-z) + abs(x+y+2*z) +abs(x+y-2*z) +abs(x-y+2*z) +abs(x-y-2*z))+params[3]
def BrokenBondBCC(params, x, y, z):
import numpy
x, y, z = index
x = x / numpy.sqrt(x**2.+y**2.+z**2.)
y = y / numpy.sqrt(x**2.+y**2.+z**2.)
z = z / numpy.sqrt(x**2.+y**2.+z**2.)
return params[0]*6*(abs(x+y+z) + abs(x-y-z) + abs(x-y+z) + abs(x+y-z)) + params[1]*8*(abs(x) + abs(y) + abs(z)) + params[2]*4* (abs(x+y) + abs(x-y) + abs(x+z) + abs(x-z) + abs(z+y) + abs(z-y)) + params[3]
| Test | Test Results | Link to Test Results page | Benchmark time
Usertime multiplied by the Whetstone Benchmark. This number can be used (approximately) to compare the performance of different models independently of the architecture on which the test was run.
Measured in Millions of Whetstone Instructions (MWI) |
|---|---|---|---|
| Broken-bond fit of high-symmetry surface energies in fcc Al v004 | view | 29590 | |
| Broken-bond fit of high-symmetry surface energies in fcc Pd v004 | view | 33972 |
Creators:
Contributor: efuem
Publication Year: 2023
DOI: https://doi.org/10.25950/fca89cea
Computes the monovacancy formation energy and relaxation volume for cubic and hcp monoatomic crystals.
| Test | Test Results | Link to Test Results page | Benchmark time
Usertime multiplied by the Whetstone Benchmark. This number can be used (approximately) to compare the performance of different models independently of the architecture on which the test was run.
Measured in Millions of Whetstone Instructions (MWI) |
|---|---|---|---|
| Monovacancy formation energy and relaxation volume for fcc Al | view | 450484 | |
| Monovacancy formation energy and relaxation volume for fcc Pd | view | 651615 |
Creators:
Contributor: efuem
Publication Year: 2023
DOI: https://doi.org/10.25950/c27ba3cd
Computes the monovacancy formation and migration energies for cubic and hcp monoatomic crystals.
| Test | Test Results | Link to Test Results page | Benchmark time
Usertime multiplied by the Whetstone Benchmark. This number can be used (approximately) to compare the performance of different models independently of the architecture on which the test was run.
Measured in Millions of Whetstone Instructions (MWI) |
|---|---|---|---|
| Vacancy formation and migration energy for fcc Al | view | 5658398 | |
| Vacancy formation and migration energy for fcc Pd | view | 1615013 |
| Test | Error Categories | Link to Error page |
|---|---|---|
| Elastic constants for diamond Mn at zero temperature v001 | other | view |
EquilibriumCrystalStructure__TD_457028483760_002
| Test | Error Categories | Link to Error page |
|---|---|---|
| Equilibrium crystal structure and energy for AlMn in AFLOW crystal prototype AB_tP2_123_a_d v002 | other | view |
VacancyFormationEnergyRelaxationVolume__TD_647413317626_001
| Test | Error Categories | Link to Error page |
|---|---|---|
| Monovacancy formation energy and relaxation volume for bcc Mn | other | view |
VacancyFormationMigration__TD_554849987965_001
| Test | Error Categories | Link to Error page |
|---|---|---|
| Vacancy formation and migration energy for bcc Mn | other | view |
No Driver
| Verification Check | Error Categories | Link to Error page |
|---|---|---|
| MemoryLeak__VC_561022993723_004 | other | view |
| EAM_IMD_SchopfBrommerFrigan_2012_AlMnPd__MO_878712978062_003.txz | Tar+XZ | Linux and OS X archive |
| EAM_IMD_SchopfBrommerFrigan_2012_AlMnPd__MO_878712978062_003.zip | Zip | Windows archive |
This Model requires a Model Driver. Archives for the Model Driver EAM_IMD__MD_113599595631_003 appear below.
| EAM_IMD__MD_113599595631_003.txz | Tar+XZ | Linux and OS X archive |
| EAM_IMD__MD_113599595631_003.zip | Zip | Windows archive |