 Exp6_KongChakrabarty_1973_ArNe__MO_946046425752_002
| Title
A single sentence description.
|
Exp-6 pair potential for Ar-Ne with parameters due to Hogervorst and mixing rule due to Kong and Chakrabarty (1973) v002 |
|---|---|
| Description
A short description of the Model describing its key features including for example: type of model (pair potential, 3-body potential, EAM, etc.), modeled species (Ac, Ag, ..., Zr), intended purpose, origin, and so on.
|
The exp-6 pair potential has an exponential repulsive term and 1/6 power attractive term. Parameters due to W. Hogervorst for pure Ar and Ne are used. A mixing rule suggested by C. L. Kong and M. R. Chakrabarty is used to compute parameters for cross-interactions between Ar and Ne. |
| Species
The supported atomic species.
| Ar, Ne |
| Disclaimer
A statement of applicability provided by the contributor, informing users of the intended use of this KIM Item.
|
None |
| Contributor |
Ellad B. Tadmor |
| Maintainer |
Ellad B. Tadmor |
| Developer |
Wouter Hogervorst Chang Lyoul Kong Manoj R. Chakrabarty |
| Published on KIM | 2018 |
| How to Cite |
This Model originally published in [1-2] is archived in OpenKIM [3-5]. [1] Hogervorst W. Transport and equilibrium properties of simple gases and forces between like and unlike atoms. Physica. 1971;51(1):77–89. doi:10.1016/0031-8914(71)90138-8 [2] Kong CL, Chakrabarty MR. Combining rules for intermolecular potential parameters. III. Application to the exp 6 potential. The Journal of Physical Chemistry. 1973;77(22):2668–70. doi:10.1021/j100640a019 [3] Hogervorst W, Kong CL, Chakrabarty MR. Exp-6 pair potential for Ar-Ne with parameters due to Hogervorst and mixing rule due to Kong and Chakrabarty (1973) v002. OpenKIM; 2018. doi:10.25950/367a9eda [4] Tadmor EB, Elliott RS, Sethna JP, Miller RE, Becker CA. The potential of atomistic simulations and the Knowledgebase of Interatomic Models. JOM. 2011;63(7):17. doi:10.1007/s11837-011-0102-6 [5] Elliott RS, Tadmor EB. Knowledgebase of Interatomic Models (KIM) Application Programming Interface (API). OpenKIM; 2011. doi:10.25950/ff8f563a Click here to download the above citation in BibTeX format. |
| Funding | Not available |
| Short KIM ID
The unique KIM identifier code.
| MO_946046425752_002 |
| Extended KIM ID
The long form of the KIM ID including a human readable prefix (100 characters max), two underscores, and the Short KIM ID. Extended KIM IDs can only contain alpha-numeric characters (letters and digits) and underscores and must begin with a letter.
| Exp6_KongChakrabarty_1973_ArNe__MO_946046425752_002 |
| DOI |
10.25950/367a9eda https://doi.org/10.25950/367a9eda https://commons.datacite.org/doi.org/10.25950/367a9eda |
| KIM Item Type
Specifies whether this is a Portable Model (software implementation of an interatomic model); Portable Model with parameter file (parameter file to be read in by a Model Driver); Model Driver (software implementation of an interatomic model that reads in parameters).
| Portable Model |
| KIM API Version | 2.0 |
| Potential Type | exp6 |
| Programming Language(s)
The programming languages used in the code and the percentage of the code written in each one. "N/A" means "not applicable" and refers to model parameterizations which only include parameter tables and have no programming language.
| 100.00% Fortran |
| Previous Version | Exp6_KongChakrabarty_1973_ArNe__MO_946046425752_001 |
| Grade | Name | Category | Brief Description | Full Results | Aux File(s) |
|---|---|---|---|---|---|
| P | vc-periodicity-support | mandatory | Periodic boundary conditions are handled correctly; see full description. |
Results | Files |
| F | vc-dimer-continuity-c1 | informational | The energy versus separation relation of a pair of atoms is C1 continuous (i.e. the function and its first derivative are continuous); see full description. |
Results | Files |
| N/A | vc-memory-leak | informational | The model code does not have memory leaks (i.e. it releases all allocated memory at the end); see full description. |
Results | Files |
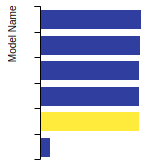
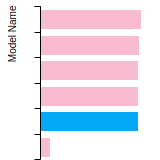
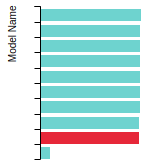
BCC Lattice Constant
This bar chart plot shows the mono-atomic body-centered cubic (bcc) lattice constant predicted by the current model (shown in the unique color) compared with the predictions for all other models in the OpenKIM Repository that support the species. The vertical bars show the average and standard deviation (one sigma) bounds for all model predictions. Graphs are generated for each species supported by the model.
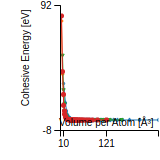
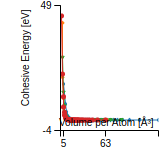
Cohesive Energy Graph
This graph shows the cohesive energy versus volume-per-atom for the current mode for four mono-atomic cubic phases (body-centered cubic (bcc), face-centered cubic (fcc), simple cubic (sc), and diamond). The curve with the lowest minimum is the ground state of the crystal if stable. (The crystal structure is enforced in these calculations, so the phase may not be stable.) Graphs are generated for each species supported by the model.
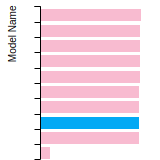
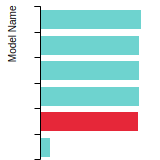
Diamond Lattice Constant
This bar chart plot shows the mono-atomic face-centered diamond lattice constant predicted by the current model (shown in the unique color) compared with the predictions for all other models in the OpenKIM Repository that support the species. The vertical bars show the average and standard deviation (one sigma) bounds for all model predictions. Graphs are generated for each species supported by the model.
Dislocation Core Energies
This graph shows the dislocation core energy of a cubic crystal at zero temperature and pressure for a specific set of dislocation core cutoff radii. After obtaining the total energy of the system from conjugate gradient minimizations, non-singular, isotropic and anisotropic elasticity are applied to obtain the dislocation core energy for each of these supercells with different dipole distances. Graphs are generated for each species supported by the model.
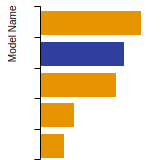
(No matching species)FCC Elastic Constants
This bar chart plot shows the mono-atomic face-centered cubic (fcc) elastic constants predicted by the current model (shown in blue) compared with the predictions for all other models in the OpenKIM Repository that support the species. The vertical bars show the average and standard deviation (one sigma) bounds for all model predictions. Graphs are generated for each species supported by the model.
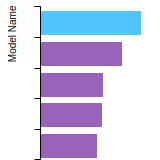
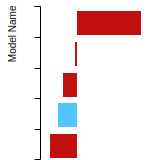
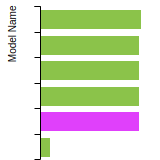
FCC Lattice Constant
This bar chart plot shows the mono-atomic face-centered cubic (fcc) lattice constant predicted by the current model (shown in red) compared with the predictions for all other models in the OpenKIM Repository that support the species. The vertical bars show the average and standard deviation (one sigma) bounds for all model predictions. Graphs are generated for each species supported by the model.
FCC Stacking Fault Energies
This bar chart plot shows the intrinsic and extrinsic stacking fault energies as well as the unstable stacking and unstable twinning energies for face-centered cubic (fcc) predicted by the current model (shown in blue) compared with the predictions for all other models in the OpenKIM Repository that support the species. The vertical bars show the average and standard deviation (one sigma) bounds for all model predictions. Graphs are generated for each species supported by the model.
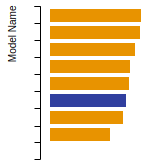
FCC Surface Energies
This bar chart plot shows the mono-atomic face-centered cubic (fcc) relaxed surface energies predicted by the current model (shown in blue) compared with the predictions for all other models in the OpenKIM Repository that support the species. The vertical bars show the average and standard deviation (one sigma) bounds for all model predictions. Graphs are generated for each species supported by the model.
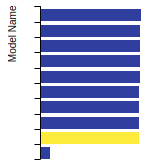
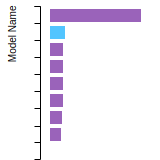
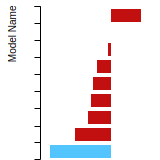
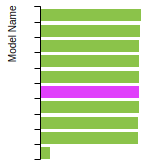
SC Lattice Constant
This bar chart plot shows the mono-atomic simple cubic (sc) lattice constant predicted by the current model (shown in the unique color) compared with the predictions for all other models in the OpenKIM Repository that support the species. The vertical bars show the average and standard deviation (one sigma) bounds for all model predictions. Graphs are generated for each species supported by the model.
Cubic Crystal Basic Properties Table
Species: ArSpecies: Ne
Creators:
Contributor: karls
Publication Year: 2019
DOI: https://doi.org/10.25950/64cb38c5
This Test Driver uses LAMMPS to compute the cohesive energy of a given monoatomic cubic lattice (fcc, bcc, sc, or diamond) at a variety of lattice spacings. The lattice spacings range from a_min (=a_min_frac*a_0) to a_max (=a_max_frac*a_0) where a_0, a_min_frac, and a_max_frac are read from stdin (a_0 is typically approximately equal to the equilibrium lattice constant). The precise scaling and number of lattice spacings sampled between a_min and a_0 (a_0 and a_max) is specified by two additional parameters passed from stdin: N_lower and samplespacing_lower (N_upper and samplespacing_upper). Please see README.txt for further details.
| Test | Test Results | Link to Test Results page | Benchmark time
Usertime multiplied by the Whetstone Benchmark. This number can be used (approximately) to compare the performance of different models independently of the architecture on which the test was run.
Measured in Millions of Whetstone Instructions (MWI) |
|---|---|---|---|
| Cohesive energy versus lattice constant curve for bcc Ar v004 | view | 2087 | |
| Cohesive energy versus lattice constant curve for bcc Ne v004 | view | 1770 | |
| Cohesive energy versus lattice constant curve for diamond Ar v004 | view | 1651 | |
| Cohesive energy versus lattice constant curve for diamond Ne v004 | view | 1820 | |
| Cohesive energy versus lattice constant curve for fcc Ar v004 | view | 1760 | |
| Cohesive energy versus lattice constant curve for fcc Ne v004 | view | 1910 | |
| Cohesive energy versus lattice constant curve for sc Ar v004 | view | 1631 | |
| Cohesive energy versus lattice constant curve for sc Ne v004 | view | 1841 |
Creators:
Contributor: ilia
Publication Year: 2024
DOI: https://doi.org/10.25950/2f2c4ad3
Computes the equilibrium crystal structure and energy for an arbitrary crystal at zero temperature and applied stress by performing symmetry-constrained relaxation. The crystal structure is specified using the AFLOW prototype designation. Multiple sets of free parameters corresponding to the crystal prototype may be specified as initial guesses for structure optimization. No guarantee is made regarding the stability of computed equilibria, nor that any are the ground state.
| Test | Test Results | Link to Test Results page | Benchmark time
Usertime multiplied by the Whetstone Benchmark. This number can be used (approximately) to compare the performance of different models independently of the architecture on which the test was run.
Measured in Millions of Whetstone Instructions (MWI) |
|---|---|---|---|
| Equilibrium crystal structure and energy for Ar in AFLOW crystal prototype A_cF4_225_a v002 | view | 54806 | |
| Equilibrium crystal structure and energy for Ne in AFLOW crystal prototype A_cF4_225_a v002 | view | 87312 | |
| Equilibrium crystal structure and energy for Ar in AFLOW crystal prototype A_hP2_194_c v002 | view | 66258 |
| Exp6_KongChakrabarty_1973_ArNe__MO_946046425752_002.txz | Tar+XZ | Linux and OS X archive |
| Exp6_KongChakrabarty_1973_ArNe__MO_946046425752_002.zip | Zip | Windows archive |