Interatomic potential for Carbon (C), Iron (Fe), Manganese (Mn), Silicon (Si). Use this Potential
Citing article:
Current potential: MEAM_LAMMPS_AslamBaskesDickel_2019_FeMnSiC__MO_427873955970_002
Deep Citation determination:
Does the citing paper use the current potential to generate results displayed in the paper?
Provide us with identifying information so that we know you are not a bot (you will not be added to a mailing list):
Title
A single sentence description.
MEAM Potential for the Fe-Mn-Si-C system developed by Aslam et al. (2019) v002
Description
A short description of the Model describing its key features including for example: type of model (pair potential, 3-body potential, EAM, etc.), modeled species (Ac, Ag, ..., Zr), intended purpose, origin, and so on.
The MEAM potential for the Fe, Mn, Si, and C system is developed by employing a hierarchical multiscale modeling paradigm to simulate low-alloy steels. Experimental information alongside first-principles calculations based on Density Functional Theory served as calibration data to develop and upscale the potential. The cohesive energy, lattice parameters, elastic constants, and vacancy and interstitial formation energies are used as target data for calibrating the single element potentials. The heat of formation and elastic constants of binary compounds and substitutional and interstitial formation energies serve as binary potential calibration data, while substitutional and interstitial pair binding energies aid in developing the ternary potential. Molecular dynamics simulations employing this model predict the thermal expansion coefficient, heat capacity, self-diffusion coefficients, and stacking fault energy for steel alloys comparable to those reported in the literature.
NOTE: The parameters submitted with the journal article as supplementary material have a small error. The paramter files included with the KIM model are correct.
Species
The supported atomic species.
C, Fe, Mn, Si
Disclaimer
A statement of applicability provided by the contributor, informing users of the intended use of this KIM Item.
This Model originally published in [1] is archived in OpenKIM [2-5].
[1] Aslam I, Baskes MI, Dickel DE, Adibi S, Li B, Rhee H, et al. Thermodynamic and kinetic behavior of low-alloy steels: An atomic level study using an Fe-Mn-Si-C modified embedded atom method (MEAM) potential. Materialia. 2019;8:100473. doi:10.1016/j.mtla.2019.100473 — (Primary Source) A primary source is a reference directly related to the item documenting its development, as opposed to other sources that are provided as background information.
[2] Aslam I, Baskes MI, Dickel DE, Adibi S, Li B, Rhee H, et al. MEAM Potential for the Fe-Mn-Si-C system developed by Aslam et al. (2019) v002. OpenKIM; 2023. doi:10.25950/5bec2aa2
[3] Afshar Y, Hütter S, Rudd RE, Stukowski A, Tipton WW, Trinkle DR, et al. The modified embedded atom method (MEAM) potential v002. OpenKIM; 2023. doi:10.25950/ee5eba52
[4] Tadmor EB, Elliott RS, Sethna JP, Miller RE, Becker CA. The potential of atomistic simulations and the Knowledgebase of Interatomic Models. JOM. 2011;63(7):17. doi:10.1007/s11837-011-0102-6
This panel presents information regarding the papers that have cited the interatomic potential (IP) whose page you are on.
The OpenKIM machine learning based Deep Citation framework is used to determine whether the citing article actually used the IP in computations (denoted by "USED") or only provides it as a background citation (denoted by "NOT USED"). For more details on Deep Citation and how to work with this panel, click the documentation link at the top of the panel.
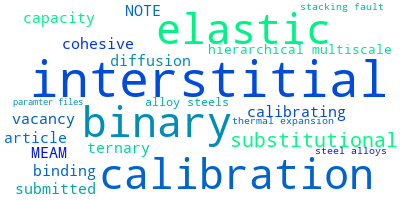
The word cloud to the right is generated from the abstracts of IP principle source(s) (given below in "How to Cite") and the citing articles that were determined to have used the IP in order to provide users with a quick sense of the types of physical phenomena to which this IP is applied.
The bar chart shows the number of articles that cited the IP per year. Each bar is divided into green (articles that USED the IP) and blue (articles that did NOT USE the IP).
Users are encouraged to correct Deep Citation errors in determination by clicking the speech icon next to a citing article and providing updated information. This will be integrated into the next Deep Citation learning cycle, which occurs on a regular basis.
This panel provides information on past usage of this interatomic potential (IP) powered by the OpenKIM Deep Citation framework. The word cloud indicates typical applications of the potential. The bar chart shows citations per year of this IP (bars are divided into articles that used the IP (green) and those that did not (blue)). The complete list of articles that cited this IP is provided below along with the Deep Citation determination on usage. See the Deep Citation documentation for more information.
12 Citations (10 used)
Help us to determine which of the papers that cite this potential actually used it to perform calculations. If you know, click the .
USED (high confidence) B. Waters, D. S. Karls, I. Nikiforov, R. Elliott, E. Tadmor, and B. Runnels, “Automated determination of grain boundary energy and potential-dependence using the OpenKIM framework,” Computational Materials Science. 2022. link Times cited: 5
USED (low confidence) L. Wen, L. Ai, L.-kuo Hong, Y. Zhou, G. Zhu, and C.-jiao Sun, “Diffusion Behavior of Carbon and Silicon in the Process of Preparing Silicon Steel Using Solid-State Decarburization,” Processes. 2023. link Times cited: 0
Abstract: In this study, we investigated the relationship between the … read more
Abstract: In this study, we investigated the relationship between the decarburization effect of the solid-state decarburization method for preparing silicon steel and the atomic diffusion behavior in the matrix, focusing on 1 mm thick Fe-0.18 wt% C-Si (1.5, 3.5 wt%) alloy strips as the research object. Solid-state decarburization experiments were carried out in an Ar-H2O-H2 atmosphere, and the self-diffusion behavior of C and Si in Fe-C-Si alloy system was simulated by molecular dynamics. The results show that the molecular dynamics simulation results are consistent with the decarburization experimental results. When the temperature is lower than 800 °C, the atoms maintain a compact bcc structure, so the migration rate of carbon is low. When the temperature rises, the atoms move violently, resulting in the destruction of the crystal structure. Because the atomic arrangement tends towards a disordered structure, the migration rate of C is high and the diffusion coefficient increases. The experimental results showed that the decarburization rate was accelerated. At the same temperature, the diffusion activation energy Q = 48.7 kJ·mol−1 of carbon in an Fe-3.5 wt% Si-C alloy matrix can be calculated. The diffusion activation energy of carbon Q = 47.3 kJ·mol−1 was calculated using a molecular dynamics simulation. When the content of Si is 3.5 wt% and 1.5 wt%, the diffusion series of Si can be expressed as D3.5Si, Si = 8.54 × 10⁻¹⁰ exp(−33,089.7/RT) m2/s and D1.5Si, Si = 2.06 × 10⁻⁹ exp(−46,641.5/RT) m2/s, respectively. When the Si content is 3.5 wt%, the diffusion coefficient of Si is larger. After diffusion to the near surface, it combines with the remaining O to form a continuous strip of SiO2. When the Si content is 1.5 wt%, the diffusion coefficient of Si is small. The remaining O diffuses in the matrix and will oxidize when encountering Si; it cannot aggregate in a highly-dispersed distribution. The lattice transition from face centered cubic lattice austenite to body centered cubic lattice ferrite occurred in the matrix of the thin strip. The diffusion coefficient of C in ferrite is much larger than that in austenite. Therefore, the decarburization rate suddenly increases before decarburization stagnation. With the increase in Si content, the diffusion activation energy of C decreases, which promotes the decarburization effect. read less
USED (low confidence) F. U. Mikombe et al., “Hot working processing and microstructure characterisation of as-cast high manganese TWIP steel,” Advances in Materials and Processing Technologies. 2023. link Times cited: 0
USED (low confidence) Y. Tang and D. Y. Li, “Influences of C, Si and Mn on the wear resistance of coiled tubing steel,” Wear. 2023. link Times cited: 0
USED (low confidence) Z. Ding, H. Hou, W. Liu, J. Kan, Y. Sun, and F. Liu, “Quantitative determination of the generalized stability of Fe-based binary alloys,” Materialia. 2023. link Times cited: 3
USED (low confidence) M. Krinitcyn, N. Toropkov, A. Pervikov, and M. Lerner, “Structure and mechanical properties of Fe-10Cu alloy obtained by material extrusion-based additive manufacturing method with bimodal powder,” Powder Technology. 2022. link Times cited: 1
USED (low confidence) J. Lloyd et al., “Manipulating shock waves with metallurgy,” Acta Materialia. 2022. link Times cited: 5
USED (low confidence) G. Poletaev and V. Kovalenko, “Development of Potentials for Description of Interatomic Interactions in Hadfield Steel for Molecular Dynamic Simulation,” Himičeskaâ fizika i mezoskopiâ. 2021. link Times cited: 0
Abstract: Summary. Hadfield steel, due to its excellent work hardening… read more
Abstract: Summary. Hadfield steel, due to its excellent work hardening ability read less
USED (low confidence) N. Dhariwal, A. S. M. Miraz, W. Meng, B. Ramachandran, and C. Wick, “Impact of metal/ceramic interactions on interfacial shear strength: Study of Cr/TiN using a new modified embedded-atom potential,” Materials & Design. 2021. link Times cited: 4
USED (low confidence) S. Paul, M. Muralles, D. Schwen, M. Short, and K. Momeni, “A Modified Embedded-Atom Potential for Fe-Cr-Si Alloys,” The Journal of Physical Chemistry C. 2021. link Times cited: 5
NOT USED (high confidence) C.-C. Huang et al., “Tailoring grain sizes of the biodegradable iron-based alloys by pre-additive manufacturing microalloying,” Scientific Reports. 2021. link Times cited: 6
NOT USED (high confidence) Q. Ren, T. Liu, S. Baik, Z. Mao, B. Krakauer, and D. Seidman, “The effects of alloying elements on the peritectic range of Fe–C–Mn–Si steels,” Journal of Materials Science. 2021. link Times cited: 4
The long form of the KIM ID including a human readable prefix (100 characters max), two underscores, and the Short KIM ID. Extended KIM IDs can only contain alpha-numeric characters (letters and digits) and underscores and must begin with a letter.
Specifies whether this is a Portable Model (software implementation of an interatomic model); Portable Model with parameter file (parameter file to be read in by a Model Driver); Model Driver (software implementation of an interatomic model that reads in parameters).
The letter grade B was assigned because the normalized error in the computation was 1.09399e-07 compared with a machine precision of 2.22045e-16. The letter grade was based on 'score=log10(error/eps)', with ranges A=[0, 7.5], B=(7.5, 10.0], C=(10.0, 12.5], D=(12.5, 15.0), F>15.0. 'A' is the best grade, and 'F' indicates failure.
vc-forces-numerical-derivative
consistency
Forces computed by the model agree with numerical derivatives of the energy; see full description.
The model is C^-1 continuous. This means that the model has discontinuous energy.
vc-dimer-continuity-c1
informational
The energy versus separation relation of a pair of atoms is C1 continuous (i.e. the function and its first derivative are continuous); see full description.
Model energy and forces are invariant with respect to rigid-body motion (translation and rotation) for all configurations the model was able to compute.
vc-objectivity
informational
Total energy is unchanged and forces transform correctly under rigid-body translation and rotation; see full description.
All threads give identical results for tested case. Model appears to be thread-safe.
vc-thread-safe
mandatory
The model returns the same energy and forces when computed in serial and when using parallel threads for a set of configurations. Note that this is not a guarantee of thread safety; see full description.
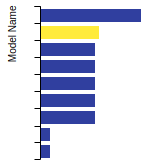
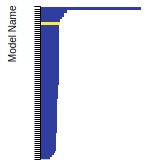
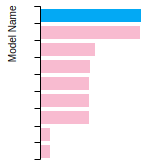
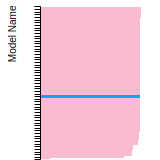
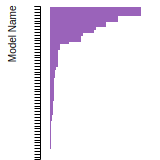
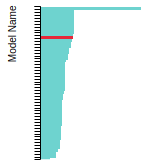
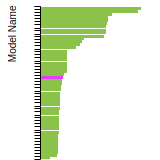
This bar chart plot shows the mono-atomic body-centered cubic (bcc) lattice constant predicted by the current model (shown in the unique color) compared with the predictions for all other models in the OpenKIM Repository that support the species. The vertical bars show the average and standard deviation (one sigma) bounds for all model predictions. Graphs are generated for each species supported by the model.
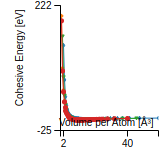
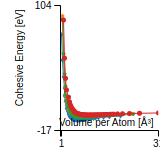
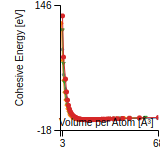
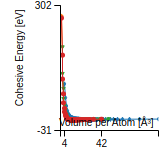
This graph shows the cohesive energy versus volume-per-atom for the current mode for four mono-atomic cubic phases (body-centered cubic (bcc), face-centered cubic (fcc), simple cubic (sc), and diamond). The curve with the lowest minimum is the ground state of the crystal if stable. (The crystal structure is enforced in these calculations, so the phase may not be stable.) Graphs are generated for each species supported by the model.
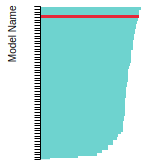
This bar chart plot shows the mono-atomic face-centered diamond lattice constant predicted by the current model (shown in the unique color) compared with the predictions for all other models in the OpenKIM Repository that support the species. The vertical bars show the average and standard deviation (one sigma) bounds for all model predictions. Graphs are generated for each species supported by the model.
This graph shows the dislocation core energy of a cubic crystal at zero temperature and pressure for a specific set of dislocation core cutoff radii. After obtaining the total energy of the system from conjugate gradient minimizations, non-singular, isotropic and anisotropic elasticity are applied to obtain the dislocation core energy for each of these supercells with different dipole distances. Graphs are generated for each species supported by the model.
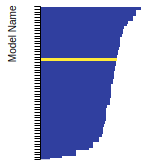
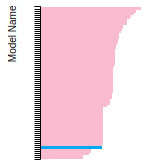
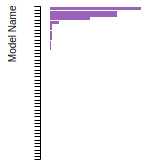
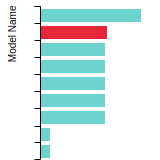
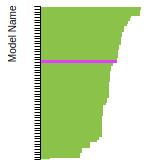
This bar chart plot shows the mono-atomic face-centered cubic (fcc) elastic constants predicted by the current model (shown in blue) compared with the predictions for all other models in the OpenKIM Repository that support the species. The vertical bars show the average and standard deviation (one sigma) bounds for all model predictions. Graphs are generated for each species supported by the model.
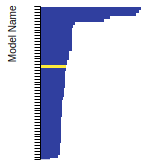
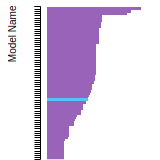
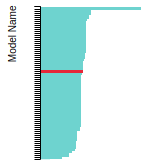
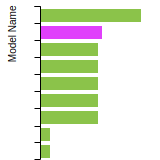
This bar chart plot shows the mono-atomic face-centered cubic (fcc) lattice constant predicted by the current model (shown in red) compared with the predictions for all other models in the OpenKIM Repository that support the species. The vertical bars show the average and standard deviation (one sigma) bounds for all model predictions. Graphs are generated for each species supported by the model.
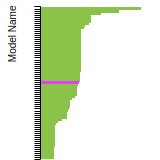
This bar chart plot shows the intrinsic and extrinsic stacking fault energies as well as the unstable stacking and unstable twinning energies for face-centered cubic (fcc) predicted by the current model (shown in blue) compared with the predictions for all other models in the OpenKIM Repository that support the species. The vertical bars show the average and standard deviation (one sigma) bounds for all model predictions. Graphs are generated for each species supported by the model.
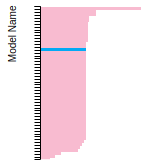
This bar chart plot shows the mono-atomic face-centered cubic (fcc) relaxed surface energies predicted by the current model (shown in blue) compared with the predictions for all other models in the OpenKIM Repository that support the species. The vertical bars show the average and standard deviation (one sigma) bounds for all model predictions. Graphs are generated for each species supported by the model.
This bar chart plot shows the mono-atomic simple cubic (sc) lattice constant predicted by the current model (shown in the unique color) compared with the predictions for all other models in the OpenKIM Repository that support the species. The vertical bars show the average and standard deviation (one sigma) bounds for all model predictions. Graphs are generated for each species supported by the model.
Given an xyz file corresponding to a finite cluster of atoms, this Test Driver computes the total potential energy and atomic forces on the configuration. The positions are then relaxed using conjugate gradient minimization and the final positions and forces are recorded. These results are primarily of interest for training machine-learning algorithms.
Test
Test Results
Link to Test Results page
Benchmark time
Usertime multiplied by the Whetstone Benchmark. This number can be used (approximately) to compare the performance of different models independently of the architecture on which the test was run.
Measured in Millions of Whetstone Instructions (MWI)
This Test Driver uses LAMMPS to compute the cohesive energy of a given monoatomic cubic lattice (fcc, bcc, sc, or diamond) at a variety of lattice spacings. The lattice spacings range from a_min (=a_min_frac*a_0) to a_max (=a_max_frac*a_0) where a_0, a_min_frac, and a_max_frac are read from stdin (a_0 is typically approximately equal to the equilibrium lattice constant). The precise scaling and number of lattice spacings sampled between a_min and a_0 (a_0 and a_max) is specified by two additional parameters passed from stdin: N_lower and samplespacing_lower (N_upper and samplespacing_upper). Please see README.txt for further details.
Test
Test Results
Link to Test Results page
Benchmark time
Usertime multiplied by the Whetstone Benchmark. This number can be used (approximately) to compare the performance of different models independently of the architecture on which the test was run.
Measured in Millions of Whetstone Instructions (MWI)
Computes the elastic constants for an arbitrary crystal. A robust computational protocol is used, attempting multiple methods and step sizes to achieve an acceptably low error in numerical differentiation and deviation from material symmetry. The crystal structure is specified using the AFLOW prototype designation as part of the Crystal Genome testing framework. In addition, the distance from the obtained elasticity tensor to the nearest isotropic tensor is computed.
Test
Test Results
Link to Test Results page
Benchmark time
Usertime multiplied by the Whetstone Benchmark. This number can be used (approximately) to compare the performance of different models independently of the architecture on which the test was run.
Measured in Millions of Whetstone Instructions (MWI)
Computes the cubic elastic constants for some common crystal types (fcc, bcc, sc, diamond) by calculating the hessian of the energy density with respect to strain. An estimate of the error associated with the numerical differentiation performed is reported.
Test
Test Results
Link to Test Results page
Benchmark time
Usertime multiplied by the Whetstone Benchmark. This number can be used (approximately) to compare the performance of different models independently of the architecture on which the test was run.
Measured in Millions of Whetstone Instructions (MWI)
Computes the equilibrium crystal structure and energy for an arbitrary crystal at zero temperature and applied stress by performing symmetry-constrained relaxation. The crystal structure is specified using the AFLOW prototype designation. Multiple sets of free parameters corresponding to the crystal prototype may be specified as initial guesses for structure optimization. No guarantee is made regarding the stability of computed equilibria, nor that any are the ground state.
Test
Test Results
Link to Test Results page
Benchmark time
Usertime multiplied by the Whetstone Benchmark. This number can be used (approximately) to compare the performance of different models independently of the architecture on which the test was run.
Measured in Millions of Whetstone Instructions (MWI)
Computes grain boundary energy for a range of tilt angles given a crystal structure, tilt axis, and material.
Test
Test Results
Link to Test Results page
Benchmark time
Usertime multiplied by the Whetstone Benchmark. This number can be used (approximately) to compare the performance of different models independently of the architecture on which the test was run.
Measured in Millions of Whetstone Instructions (MWI)
Given atomic species and structure type (graphene-like, 2H, or 1T) of a 2D hexagonal monolayer crystal, as well as an initial guess at the lattice spacing, this Test Driver calculates the equilibrium lattice spacing and cohesive energy using Polak-Ribiere conjugate gradient minimization in LAMMPS
Test
Test Results
Link to Test Results page
Benchmark time
Usertime multiplied by the Whetstone Benchmark. This number can be used (approximately) to compare the performance of different models independently of the architecture on which the test was run.
Measured in Millions of Whetstone Instructions (MWI)
Equilibrium lattice constant and cohesive energy of a cubic lattice at zero temperature and pressure.
Test
Test Results
Link to Test Results page
Benchmark time
Usertime multiplied by the Whetstone Benchmark. This number can be used (approximately) to compare the performance of different models independently of the architecture on which the test was run.
Measured in Millions of Whetstone Instructions (MWI)
Calculates lattice constant of hexagonal bulk structures at zero temperature and pressure by using simplex minimization to minimize the potential energy.
Test
Test Results
Link to Test Results page
Benchmark time
Usertime multiplied by the Whetstone Benchmark. This number can be used (approximately) to compare the performance of different models independently of the architecture on which the test was run.
Measured in Millions of Whetstone Instructions (MWI)
This Test Driver uses LAMMPS to compute the linear thermal expansion coefficient at a finite temperature under a given pressure for a cubic lattice (fcc, bcc, sc, diamond) of a single given species.
Test
Test Results
Link to Test Results page
Benchmark time
Usertime multiplied by the Whetstone Benchmark. This number can be used (approximately) to compare the performance of different models independently of the architecture on which the test was run.
Measured in Millions of Whetstone Instructions (MWI)
Usertime multiplied by the Whetstone Benchmark. This number can be used (approximately) to compare the performance of different models independently of the architecture on which the test was run.
Measured in Millions of Whetstone Instructions (MWI)
Given an extended xyz file corresponding to a non-orthogonal periodic box of atoms, use LAMMPS to compute the total potential energy and atomic forces.
Test
Test Results
Link to Test Results page
Benchmark time
Usertime multiplied by the Whetstone Benchmark. This number can be used (approximately) to compare the performance of different models independently of the architecture on which the test was run.
Measured in Millions of Whetstone Instructions (MWI)
Computes the monovacancy formation energy and relaxation volume for cubic and hcp monoatomic crystals.
Test
Test Results
Link to Test Results page
Benchmark time
Usertime multiplied by the Whetstone Benchmark. This number can be used (approximately) to compare the performance of different models independently of the architecture on which the test was run.
Measured in Millions of Whetstone Instructions (MWI)
Computes the monovacancy formation and migration energies for cubic and hcp monoatomic crystals.
Test
Test Results
Link to Test Results page
Benchmark time
Usertime multiplied by the Whetstone Benchmark. This number can be used (approximately) to compare the performance of different models independently of the architecture on which the test was run.
Measured in Millions of Whetstone Instructions (MWI)
 MEAM_LAMMPS_AslamBaskesDickel_2019_FeMnSiC__MO_427873955970_002