 MEAM_LAMMPS_ChoiJoSohn_2018_CoNiCrFeMn__MO_115454747503_000
Use this Potential
| Title
A single sentence description.
|
MEAM Potential for the Co-Ni-Cr-Fe-Mn system developed by Choi et al., (2018) v000 |
|---|---|
| Description
A short description of the Model describing its key features including for example: type of model (pair potential, 3-body potential, EAM, etc.), modeled species (Ac, Ag, ..., Zr), intended purpose, origin, and so on.
|
This potential can clarify the physical metallurgical reasons for the materials phenomena (sluggish diffusion and micro-twining at cryogenic temperatures) and shows the effect of individual elements on solid solution hardening for the equiatomic CoCrFeMnNi HEA. A significant number of stable vacant lattice sites with high migration energy barriers exists and is thought to cause the sluggish diffusion. And also, this potential predict that the hexagonal close-packed (hcp) structure is more stable than the face-centered cubic (fcc) structure at 0 K, that paper proposes as the fundamental reason for the micro-twinning at cryogenic temperatures. |
| Species
The supported atomic species.
| Co, Cr, Fe, Mn, Ni |
| Disclaimer
A statement of applicability provided by the contributor, informing users of the intended use of this KIM Item.
|
None |
| Content Origin | http://cmse.postech.ac.kr/home_2nnmeam |
| Contributor |
Hyeon-Seok Do |
| Maintainer |
Hyeon-Seok Do |
| Developer |
Won-Mi Choi Yong Hee Jo S.S. Sohn Sunghak Lee Byeong-Joo Lee |
| Published on KIM | 2021 |
| How to Cite | Click here to download this citation in BibTeX format. |
| Funding | Not available |
| Short KIM ID
The unique KIM identifier code.
| MO_115454747503_000 |
| Extended KIM ID
The long form of the KIM ID including a human readable prefix (100 characters max), two underscores, and the Short KIM ID. Extended KIM IDs can only contain alpha-numeric characters (letters and digits) and underscores and must begin with a letter.
| MEAM_LAMMPS_ChoiJoSohn_2018_CoNiCrFeMn__MO_115454747503_000 |
| DOI |
10.25950/a4635882 https://doi.org/10.25950/a4635882 https://commons.datacite.org/doi.org/10.25950/a4635882 |
| KIM Item Type
Specifies whether this is a Portable Model (software implementation of an interatomic model); Portable Model with parameter file (parameter file to be read in by a Model Driver); Model Driver (software implementation of an interatomic model that reads in parameters).
| Portable Model using Model Driver MEAM_LAMMPS__MD_249792265679_000 |
| Driver | MEAM_LAMMPS__MD_249792265679_000 |
| KIM API Version | 2.2 |
| Potential Type | meam |
| Grade | Name | Category | Brief Description | Full Results | Aux File(s) |
|---|---|---|---|---|---|
| P | vc-species-supported-as-stated | mandatory | The model supports all species it claims to support; see full description. |
Results | Files |
| P | vc-periodicity-support | mandatory | Periodic boundary conditions are handled correctly; see full description. |
Results | Files |
| P | vc-permutation-symmetry | mandatory | Total energy and forces are unchanged when swapping atoms of the same species; see full description. |
Results | Files |
| B | vc-forces-numerical-derivative | consistency | Forces computed by the model agree with numerical derivatives of the energy; see full description. |
Results | Files |
| F | vc-dimer-continuity-c1 | informational | The energy versus separation relation of a pair of atoms is C1 continuous (i.e. the function and its first derivative are continuous); see full description. |
Results | Files |
| P | vc-objectivity | informational | Total energy is unchanged and forces transform correctly under rigid-body translation and rotation; see full description. |
Results | Files |
| P | vc-inversion-symmetry | informational | Total energy is unchanged and forces change sign when inverting a configuration through the origin; see full description. |
Results | Files |
| P | vc-memory-leak | informational | The model code does not have memory leaks (i.e. it releases all allocated memory at the end); see full description. |
Results | Files |
| P | vc-thread-safe | mandatory | The model returns the same energy and forces when computed in serial and when using parallel threads for a set of configurations. Note that this is not a guarantee of thread safety; see full description. |
Results | Files |
| P | vc-unit-conversion | mandatory | The model is able to correctly convert its energy and/or forces to different unit sets; see full description. |
Results | Files |
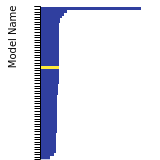
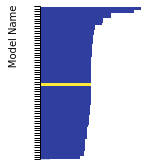
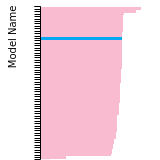
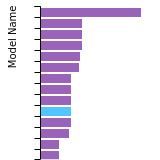
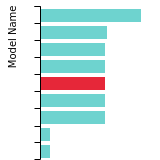
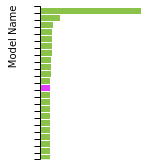
BCC Lattice Constant
This bar chart plot shows the mono-atomic body-centered cubic (bcc) lattice constant predicted by the current model (shown in the unique color) compared with the predictions for all other models in the OpenKIM Repository that support the species. The vertical bars show the average and standard deviation (one sigma) bounds for all model predictions. Graphs are generated for each species supported by the model.
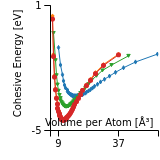
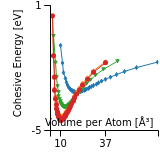
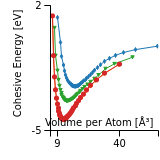
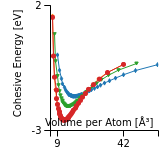
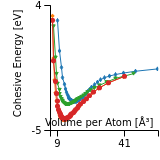
Cohesive Energy Graph
This graph shows the cohesive energy versus volume-per-atom for the current mode for four mono-atomic cubic phases (body-centered cubic (bcc), face-centered cubic (fcc), simple cubic (sc), and diamond). The curve with the lowest minimum is the ground state of the crystal if stable. (The crystal structure is enforced in these calculations, so the phase may not be stable.) Graphs are generated for each species supported by the model.
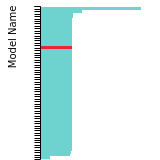
Diamond Lattice Constant
This bar chart plot shows the mono-atomic face-centered diamond lattice constant predicted by the current model (shown in the unique color) compared with the predictions for all other models in the OpenKIM Repository that support the species. The vertical bars show the average and standard deviation (one sigma) bounds for all model predictions. Graphs are generated for each species supported by the model.
Dislocation Core Energies
This graph shows the dislocation core energy of a cubic crystal at zero temperature and pressure for a specific set of dislocation core cutoff radii. After obtaining the total energy of the system from conjugate gradient minimizations, non-singular, isotropic and anisotropic elasticity are applied to obtain the dislocation core energy for each of these supercells with different dipole distances. Graphs are generated for each species supported by the model.
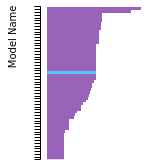
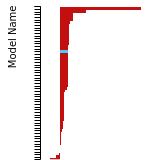
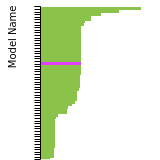
(No matching species)FCC Elastic Constants
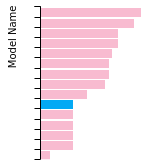
This bar chart plot shows the mono-atomic face-centered cubic (fcc) elastic constants predicted by the current model (shown in blue) compared with the predictions for all other models in the OpenKIM Repository that support the species. The vertical bars show the average and standard deviation (one sigma) bounds for all model predictions. Graphs are generated for each species supported by the model.
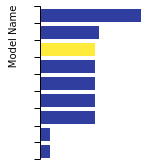
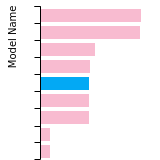
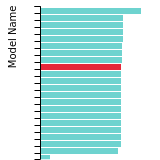
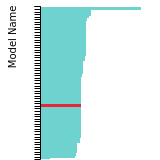
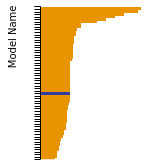
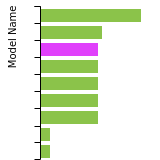
FCC Lattice Constant
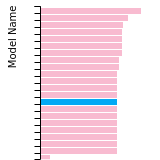
This bar chart plot shows the mono-atomic face-centered cubic (fcc) lattice constant predicted by the current model (shown in red) compared with the predictions for all other models in the OpenKIM Repository that support the species. The vertical bars show the average and standard deviation (one sigma) bounds for all model predictions. Graphs are generated for each species supported by the model.

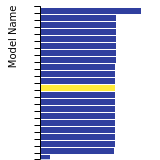
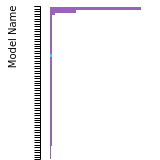
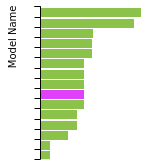
FCC Stacking Fault Energies
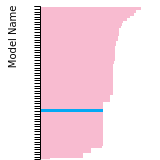
This bar chart plot shows the intrinsic and extrinsic stacking fault energies as well as the unstable stacking and unstable twinning energies for face-centered cubic (fcc) predicted by the current model (shown in blue) compared with the predictions for all other models in the OpenKIM Repository that support the species. The vertical bars show the average and standard deviation (one sigma) bounds for all model predictions. Graphs are generated for each species supported by the model.
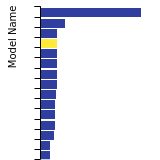
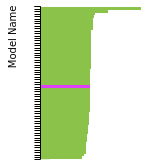
FCC Surface Energies
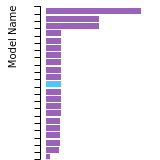
This bar chart plot shows the mono-atomic face-centered cubic (fcc) relaxed surface energies predicted by the current model (shown in blue) compared with the predictions for all other models in the OpenKIM Repository that support the species. The vertical bars show the average and standard deviation (one sigma) bounds for all model predictions. Graphs are generated for each species supported by the model.
SC Lattice Constant
This bar chart plot shows the mono-atomic simple cubic (sc) lattice constant predicted by the current model (shown in the unique color) compared with the predictions for all other models in the OpenKIM Repository that support the species. The vertical bars show the average and standard deviation (one sigma) bounds for all model predictions. Graphs are generated for each species supported by the model.
Cubic Crystal Basic Properties Table
Species: CoSpecies: Cr
Species: Fe
Species: Mn
Species: Ni
Creators:
Contributor: karls
Publication Year: 2019
DOI: https://doi.org/10.25950/64cb38c5
This Test Driver uses LAMMPS to compute the cohesive energy of a given monoatomic cubic lattice (fcc, bcc, sc, or diamond) at a variety of lattice spacings. The lattice spacings range from a_min (=a_min_frac*a_0) to a_max (=a_max_frac*a_0) where a_0, a_min_frac, and a_max_frac are read from stdin (a_0 is typically approximately equal to the equilibrium lattice constant). The precise scaling and number of lattice spacings sampled between a_min and a_0 (a_0 and a_max) is specified by two additional parameters passed from stdin: N_lower and samplespacing_lower (N_upper and samplespacing_upper). Please see README.txt for further details.
Creators: Junhao Li and Ellad Tadmor
Contributor: tadmor
Publication Year: 2019
DOI: https://doi.org/10.25950/5853fb8f
Computes the cubic elastic constants for some common crystal types (fcc, bcc, sc, diamond) by calculating the hessian of the energy density with respect to strain. An estimate of the error associated with the numerical differentiation performed is reported.
Creators: Brandon Runnels
Contributor: brunnels
Publication Year: 2019
DOI: https://doi.org/10.25950/4723cee7
Computes grain boundary energy for a range of tilt angles given a crystal structure, tilt axis, and material.
Creators: Daniel S. Karls and Junhao Li
Contributor: karls
Publication Year: 2019
DOI: https://doi.org/10.25950/2765e3bf
Equilibrium lattice constant and cohesive energy of a cubic lattice at zero temperature and pressure.
Creators: Daniel S. Karls and Junhao Li
Contributor: karls
Publication Year: 2019
DOI: https://doi.org/10.25950/c339ca32
Calculates lattice constant of hexagonal bulk structures at zero temperature and pressure by using simplex minimization to minimize the potential energy.
| Test | Test Results | Link to Test Results page | Benchmark time
Usertime multiplied by the Whetstone Benchmark. This number can be used (approximately) to compare the performance of different models independently of the architecture on which the test was run.
Measured in Millions of Whetstone Instructions (MWI) |
|---|---|---|---|
| Equilibrium lattice constants for hcp Co v005 | view | 30736 | |
| Equilibrium lattice constants for hcp Cr v005 | view | 30957 | |
| Equilibrium lattice constants for hcp Fe v005 | view | 31968 | |
| Equilibrium lattice constants for hcp Mn v005 | view | 31084 | |
| Equilibrium lattice constants for hcp Ni v005 | view | 30515 |
Creators: Mingjian Wen
Contributor: mjwen
Publication Year: 2019
DOI: https://doi.org/10.25950/fc69d82d
This Test Driver uses LAMMPS to compute the linear thermal expansion coefficient at a finite temperature under a given pressure for a cubic lattice (fcc, bcc, sc, diamond) of a single given species.
| Test | Test Results | Link to Test Results page | Benchmark time
Usertime multiplied by the Whetstone Benchmark. This number can be used (approximately) to compare the performance of different models independently of the architecture on which the test was run.
Measured in Millions of Whetstone Instructions (MWI) |
|---|---|---|---|
| Linear thermal expansion coefficient of bcc Cr at 293.15 K under a pressure of 0 MPa v001 | view | 17862190 | |
| Linear thermal expansion coefficient of bcc Fe at 293.15 K under a pressure of 0 MPa v001 | view | 75492593 | |
| Linear thermal expansion coefficient of fcc Ni at 293.15 K under a pressure of 0 MPa v001 | view | 61962266 |
Creators: Matt Bierbaum
Contributor: mattbierbaum
Publication Year: 2019
DOI: https://doi.org/10.25950/64f4999b
Calculates the phonon dispersion relations for fcc lattices and records the results as curves.
| Test | Test Results | Link to Test Results page | Benchmark time
Usertime multiplied by the Whetstone Benchmark. This number can be used (approximately) to compare the performance of different models independently of the architecture on which the test was run.
Measured in Millions of Whetstone Instructions (MWI) |
|---|---|---|---|
| Phonon dispersion relations for fcc Ni v004 | view | 64663 |
Creators:
Contributor: SubrahmanyamPattamatta
Publication Year: 2019
DOI: https://doi.org/10.25950/b4cfaf9a
Intrinsic and extrinsic stacking fault energies, unstable stacking fault energy, unstable twinning energy, stacking fault energy as a function of fractional displacement, and gamma surface for a monoatomic FCC lattice at zero temperature and pressure.
| Test | Test Results | Link to Test Results page | Benchmark time
Usertime multiplied by the Whetstone Benchmark. This number can be used (approximately) to compare the performance of different models independently of the architecture on which the test was run.
Measured in Millions of Whetstone Instructions (MWI) |
|---|---|---|---|
| Stacking and twinning fault energies for fcc Ni v002 | view | 27621516 |
Creators: Matt Bierbaum
Contributor: mattbierbaum
Publication Year: 2019
DOI: https://doi.org/10.25950/6c43a4e6
Calculates the surface energy of several high symmetry surfaces and produces a broken-bond model fit. In latex form, the fit equations are given by:
E_{FCC} (\vec{n}) = p_1 (4 \left( |x+y| + |x-y| + |x+z| + |x-z| + |z+y| +|z-y|\right)) + p_2 (8 \left( |x| + |y| + |z|\right)) + p_3 (2 ( |x+ 2y + z| + |x+2y-z| + |x-2y + z| + |x-2y-z| + |2x+y+z| + |2x+y-z| +|2x-y+z| +|2x-y-z| +|x+y+2z| +|x+y-2z| +|x-y+2z| +|x-y-2z| ) + c
E_{BCC} (\vec{n}) = p_1 (6 \left( | x+y+z| + |x+y-z| + |-x+y-z| + |x-y+z| \right)) + p_2 (8 \left( |x| + |y| + |z|\right)) + p_3 (4 \left( |x+y| + |x-y| + |x+z| + |x-z| + |z+y| +|z-y|\right)) +c.
In Python, these two fits take the following form:
def BrokenBondFCC(params, index):
import numpy
x, y, z = index
x = x / numpy.sqrt(x**2.+y**2.+z**2.)
y = y / numpy.sqrt(x**2.+y**2.+z**2.)
z = z / numpy.sqrt(x**2.+y**2.+z**2.)
return params[0]*4* (abs(x+y) + abs(x-y) + abs(x+z) + abs(x-z) + abs(z+y) + abs(z-y)) + params[1]*8*(abs(x) + abs(y) + abs(z)) + params[2]*(abs(x+2*y+z) + abs(x+2*y-z) +abs(x-2*y+z) +abs(x-2*y-z) + abs(2*x+y+z) +abs(2*x+y-z) +abs(2*x-y+z) +abs(2*x-y-z) + abs(x+y+2*z) +abs(x+y-2*z) +abs(x-y+2*z) +abs(x-y-2*z))+params[3]
def BrokenBondBCC(params, x, y, z):
import numpy
x, y, z = index
x = x / numpy.sqrt(x**2.+y**2.+z**2.)
y = y / numpy.sqrt(x**2.+y**2.+z**2.)
z = z / numpy.sqrt(x**2.+y**2.+z**2.)
return params[0]*6*(abs(x+y+z) + abs(x-y-z) + abs(x-y+z) + abs(x+y-z)) + params[1]*8*(abs(x) + abs(y) + abs(z)) + params[2]*4* (abs(x+y) + abs(x-y) + abs(x+z) + abs(x-z) + abs(z+y) + abs(z-y)) + params[3]
| Test | Test Results | Link to Test Results page | Benchmark time
Usertime multiplied by the Whetstone Benchmark. This number can be used (approximately) to compare the performance of different models independently of the architecture on which the test was run.
Measured in Millions of Whetstone Instructions (MWI) |
|---|---|---|---|
| Broken-bond fit of high-symmetry surface energies in bcc Cr v004 | view | 30420 | |
| Broken-bond fit of high-symmetry surface energies in bcc Fe v004 | view | 45046 | |
| Broken-bond fit of high-symmetry surface energies in fcc Ni v004 | view | 67537 |
| Test | Error Categories | Link to Error page |
|---|---|---|
| Elastic constants for bcc Mn at zero temperature v006 | other | view |
| Elastic constants for diamond Fe at zero temperature v001 | other | view |
| Elastic constants for diamond Mn at zero temperature v001 | other | view |
| Elastic constants for fcc Mn at zero temperature v006 | other | view |
| Elastic constants for sc Mn at zero temperature v006 | other | view |
ElasticConstantsHexagonal__TD_612503193866_004
| Test | Error Categories | Link to Error page |
|---|---|---|
| Elastic constants for hcp Co at zero temperature v004 | other | view |
| Elastic constants for hcp Cr at zero temperature v004 | other | view |
| Elastic constants for hcp Fe at zero temperature v004 | other | view |
| Elastic constants for hcp Mn at zero temperature v004 | other | view |
| Elastic constants for hcp Ni at zero temperature v004 | other | view |
| MEAM_LAMMPS_ChoiJoSohn_2018_CoNiCrFeMn__MO_115454747503_000.txz | Tar+XZ | Linux and OS X archive |
| MEAM_LAMMPS_ChoiJoSohn_2018_CoNiCrFeMn__MO_115454747503_000.zip | Zip | Windows archive |
This Model requires a Model Driver. Archives for the Model Driver MEAM_LAMMPS__MD_249792265679_000 appear below.
| MEAM_LAMMPS__MD_249792265679_000.txz | Tar+XZ | Linux and OS X archive |
| MEAM_LAMMPS__MD_249792265679_000.zip | Zip | Windows archive |