Current potential: MEAM_LAMMPS_HuangDongLiu_2018_Si__MO_050147023220_002
Deep Citation determination:
Does the citing paper use the current potential to generate results displayed in the paper?
Provide us with identifying information so that we know you are not a bot (you will not be added to a mailing list):
Title
A single sentence description.
MEAM potential for Si developed by Huang et al. (2018) v002
Description
A short description of the Model describing its key features including for example: type of model (pair potential, 3-body potential, EAM, etc.), modeled species (Ac, Ag, ..., Zr), intended purpose, origin, and so on.
An improved modified embedded-atom method (MEAM) potential for Si was optimized. The melting point, the solid-liquid phase transformation enthalpy, the pair correlation function, the structure factor, and the bond angle distribution function of liquid Si calculated by the present potential could fit the DFT or experimental values well. The potential could be used to study the solid-liquid transformation behaviors and the liquid structure of Si. It could also be used to develop a MEAM potential for the binary Al-Si alloy.
Species
The supported atomic species.
Si
Disclaimer
A statement of applicability provided by the contributor, informing users of the intended use of this KIM Item.
None
Content Origin
Files are provided by Xiusong Huang (Tsinghua University) on Feb 8, 2021, and posted with his permission.
This Model originally published in [1] is archived in OpenKIM [2-5].
[1] Huang X, Dong X, Liu L, Li P. Modified embedded-atom method, Silicon, Interatomic potential, Melting point, Liquid structure. Computational Materials Science. 2018;153:251–7. doi:10.1016/j.commatsci.2018.07.001 — (Primary Source) A primary source is a reference directly related to the item documenting its development, as opposed to other sources that are provided as background information.
[2] Huang X, Dong X, Liu L, Li P. MEAM potential for Si developed by Huang et al. (2018) v002. OpenKIM; 2023. doi:10.25950/bbd72645
[3] Afshar Y, Hütter S, Rudd RE, Stukowski A, Tipton WW, Trinkle DR, et al. The modified embedded atom method (MEAM) potential v002. OpenKIM; 2023. doi:10.25950/ee5eba52
[4] Tadmor EB, Elliott RS, Sethna JP, Miller RE, Becker CA. The potential of atomistic simulations and the Knowledgebase of Interatomic Models. JOM. 2011;63(7):17. doi:10.1007/s11837-011-0102-6
This panel presents information regarding the papers that have cited the interatomic potential (IP) whose page you are on.
The OpenKIM machine learning based Deep Citation framework is used to determine whether the citing article actually used the IP in computations (denoted by "USED") or only provides it as a background citation (denoted by "NOT USED"). For more details on Deep Citation and how to work with this panel, click the documentation link at the top of the panel.
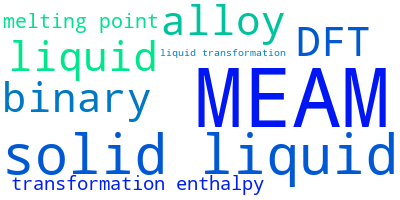
The word cloud to the right is generated from the abstracts of IP principle source(s) (given below in "How to Cite") and the citing articles that were determined to have used the IP in order to provide users with a quick sense of the types of physical phenomena to which this IP is applied.
The bar chart shows the number of articles that cited the IP per year. Each bar is divided into green (articles that USED the IP) and blue (articles that did NOT USE the IP).
Users are encouraged to correct Deep Citation errors in determination by clicking the speech icon next to a citing article and providing updated information. This will be integrated into the next Deep Citation learning cycle, which occurs on a regular basis.
This panel provides information on past usage of this interatomic potential (IP) powered by the OpenKIM Deep Citation framework. The word cloud indicates typical applications of the potential. The bar chart shows citations per year of this IP (bars are divided into articles that used the IP (green) and those that did not (blue)). The complete list of articles that cited this IP is provided below along with the Deep Citation determination on usage. See the Deep Citation documentation for more information.
5 Citations (2 used)
Help us to determine which of the papers that cite this potential actually used it to perform calculations. If you know, click the .
USED (low confidence) B. G. Choobar, H. Modarress, R. Halladj, and S. Amjad-Iranagh, “Electrodeposition of lithium metal on lithium anode surface, a simulation study by: Kinetic Monte Carlo-embedded atom method,” Computational Materials Science. 2021. link Times cited: 14
USED (low confidence) X.-song Huang, X. Dong, L. Liu, and P. Li, “Liquid structure of Al-Si alloy: A molecular dynamics simulation,” Journal of Non-Crystalline Solids. 2019. link Times cited: 10
NOT USED (low confidence) J. Cui et al., “Atomic Insights of Self‐Healing in Silicon Nanowires,” Advanced Functional Materials. 2022. link Times cited: 2
Abstract: The self‐healing capability is highly desirable in semicondu… read more
Abstract: The self‐healing capability is highly desirable in semiconductors to develop advanced devices with improved stability and longevity. In this study, the automatic self‐healing in silicon nanowires is reported, which are one of the most important building blocks for high‐performance semiconductor nanodevices. A recovery of fracture strength (10.1%) on fractured silicon nanowires is achieved, which is demonstrated by in situ transmission electron microscopy tensile tests. The self‐healing mechanism and factors governing the self‐healing efficiency are revealed by a combination of atomic‐resolution characterizations and atomistic simulations. Spontaneous rebonding, atomic rearrangement, and van der Waals attraction are responsible for the self‐healing in silicon nanowires. Additionally, the self‐healing efficiency is affected by the fracture surface roughness, the nanowire size, the nanowire orientation, and the passivation of dangling bonds on fracture surfaces. These new findings shed light on the self‐healing mechanism of silicon nanowires and provide new insights into developing high‐lifetime and high‐security semiconductor devices. read less
NOT USED (low confidence) X.-song Huang et al., “Atomistic simulation of chemical short-range order in HfNbTaZr high entropy alloy based on a newly-developed interatomic potential,” Materials & Design. 2021. link Times cited: 55
NOT USED (high confidence) S. Kavousi, B. R. Novak, M. Baskes, M. A. Zaeem, and D. Moldovan, “Modified embedded-atom method potential for high-temperature crystal-melt properties of Ti–Ni alloys and its application to phase field simulation of solidification,” Modelling and Simulation in Materials Science and Engineering. 2019. link Times cited: 21
Abstract: We developed new interatomic potentials, based on the second… read more
Abstract: We developed new interatomic potentials, based on the second nearest-neighbor modified embedded-atom method (2NN-MEAM) formalism, for Ti, Ni, and the binary Ti–Ni system. These potentials were fit to melting points, latent heats, the binary phase diagrams for the Ti rich and Ni rich regions, and the liquid phase enthalpy of mixing for binary alloys, therefore they are particularly suited for calculations of crystal-melt (CM) interface thermodynamic and transport properties. The accuracy of the potentials for pure Ti and pure Ni were tested against both 0 K and high temperature properties by comparing various properties obtained from experiments or density functional theory calculations including structural properties, elastic constants, point-defect properties, surface energies, temperatures and enthalpies of phase transformations, and diffusivity and viscosity in the liquid phase. The fitted binary potential for Ti–Ni was also tested against various non-fitted properties at 0 K and high temperatures including lattice parameters, formation energies of different intermetallic compounds, and the temperature dependence of liquid density at various concentrations. The CM interfacial free energies obtained from simulations, based on the newly developed Ti–Ni potential, show that the bcc alloys tend to have smaller anisotropy compared with fcc alloys which is consistent with the finding from the previous studies comparing single component bcc and fcc materials. Moreover, the interfacial free energy and its anisotropy for Ti-2 atom% Ni were also used to parameterize a 2D phase field (PF) model utilized in solidification simulations. The PF simulation predictions of microstructure development during solidification are in good agreement with a geometric model for dendrite primary arm spacing. read less
The long form of the KIM ID including a human readable prefix (100 characters max), two underscores, and the Short KIM ID. Extended KIM IDs can only contain alpha-numeric characters (letters and digits) and underscores and must begin with a letter.
Specifies whether this is a Portable Model (software implementation of an interatomic model); Portable Model with parameter file (parameter file to be read in by a Model Driver); Model Driver (software implementation of an interatomic model that reads in parameters).
The letter grade A was assigned because the normalized error in the computation was 7.18208e-10 compared with a machine precision of 2.22045e-16. The letter grade was based on 'score=log10(error/eps)', with ranges A=[0, 7.5], B=(7.5, 10.0], C=(10.0, 12.5], D=(12.5, 15.0), F>15.0. 'A' is the best grade, and 'F' indicates failure.
vc-forces-numerical-derivative
consistency
Forces computed by the model agree with numerical derivatives of the energy; see full description.
The model is C^0 continuous. This means that the model has continuous energy, but a discontinuous first derivative.
vc-dimer-continuity-c1
informational
The energy versus separation relation of a pair of atoms is C1 continuous (i.e. the function and its first derivative are continuous); see full description.
Model energy and forces are invariant with respect to rigid-body motion (translation and rotation) for all configurations the model was able to compute.
vc-objectivity
informational
Total energy is unchanged and forces transform correctly under rigid-body translation and rotation; see full description.
All threads give identical results for tested case. Model appears to be thread-safe.
vc-thread-safe
mandatory
The model returns the same energy and forces when computed in serial and when using parallel threads for a set of configurations. Note that this is not a guarantee of thread safety; see full description.
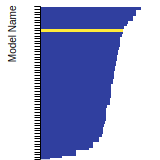
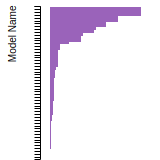
This bar chart plot shows the mono-atomic body-centered cubic (bcc) lattice constant predicted by the current model (shown in the unique color) compared with the predictions for all other models in the OpenKIM Repository that support the species. The vertical bars show the average and standard deviation (one sigma) bounds for all model predictions. Graphs are generated for each species supported by the model.
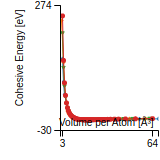
This graph shows the cohesive energy versus volume-per-atom for the current mode for four mono-atomic cubic phases (body-centered cubic (bcc), face-centered cubic (fcc), simple cubic (sc), and diamond). The curve with the lowest minimum is the ground state of the crystal if stable. (The crystal structure is enforced in these calculations, so the phase may not be stable.) Graphs are generated for each species supported by the model.
This bar chart plot shows the mono-atomic face-centered diamond lattice constant predicted by the current model (shown in the unique color) compared with the predictions for all other models in the OpenKIM Repository that support the species. The vertical bars show the average and standard deviation (one sigma) bounds for all model predictions. Graphs are generated for each species supported by the model.
This graph shows the dislocation core energy of a cubic crystal at zero temperature and pressure for a specific set of dislocation core cutoff radii. After obtaining the total energy of the system from conjugate gradient minimizations, non-singular, isotropic and anisotropic elasticity are applied to obtain the dislocation core energy for each of these supercells with different dipole distances. Graphs are generated for each species supported by the model.
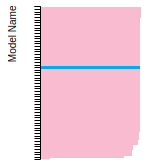
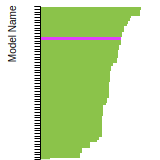
This bar chart plot shows the mono-atomic face-centered cubic (fcc) elastic constants predicted by the current model (shown in blue) compared with the predictions for all other models in the OpenKIM Repository that support the species. The vertical bars show the average and standard deviation (one sigma) bounds for all model predictions. Graphs are generated for each species supported by the model.
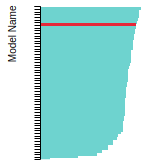
This bar chart plot shows the mono-atomic face-centered cubic (fcc) lattice constant predicted by the current model (shown in red) compared with the predictions for all other models in the OpenKIM Repository that support the species. The vertical bars show the average and standard deviation (one sigma) bounds for all model predictions. Graphs are generated for each species supported by the model.
This bar chart plot shows the intrinsic and extrinsic stacking fault energies as well as the unstable stacking and unstable twinning energies for face-centered cubic (fcc) predicted by the current model (shown in blue) compared with the predictions for all other models in the OpenKIM Repository that support the species. The vertical bars show the average and standard deviation (one sigma) bounds for all model predictions. Graphs are generated for each species supported by the model.
This bar chart plot shows the mono-atomic face-centered cubic (fcc) relaxed surface energies predicted by the current model (shown in blue) compared with the predictions for all other models in the OpenKIM Repository that support the species. The vertical bars show the average and standard deviation (one sigma) bounds for all model predictions. Graphs are generated for each species supported by the model.
This bar chart plot shows the mono-atomic simple cubic (sc) lattice constant predicted by the current model (shown in the unique color) compared with the predictions for all other models in the OpenKIM Repository that support the species. The vertical bars show the average and standard deviation (one sigma) bounds for all model predictions. Graphs are generated for each species supported by the model.
Given an xyz file corresponding to a finite cluster of atoms, this Test Driver computes the total potential energy and atomic forces on the configuration. The positions are then relaxed using conjugate gradient minimization and the final positions and forces are recorded. These results are primarily of interest for training machine-learning algorithms.
Test
Test Results
Link to Test Results page
Benchmark time
Usertime multiplied by the Whetstone Benchmark. This number can be used (approximately) to compare the performance of different models independently of the architecture on which the test was run.
Measured in Millions of Whetstone Instructions (MWI)
This Test Driver uses LAMMPS to compute the cohesive energy of a given monoatomic cubic lattice (fcc, bcc, sc, or diamond) at a variety of lattice spacings. The lattice spacings range from a_min (=a_min_frac*a_0) to a_max (=a_max_frac*a_0) where a_0, a_min_frac, and a_max_frac are read from stdin (a_0 is typically approximately equal to the equilibrium lattice constant). The precise scaling and number of lattice spacings sampled between a_min and a_0 (a_0 and a_max) is specified by two additional parameters passed from stdin: N_lower and samplespacing_lower (N_upper and samplespacing_upper). Please see README.txt for further details.
Test
Test Results
Link to Test Results page
Benchmark time
Usertime multiplied by the Whetstone Benchmark. This number can be used (approximately) to compare the performance of different models independently of the architecture on which the test was run.
Measured in Millions of Whetstone Instructions (MWI)
Computes the cubic elastic constants for some common crystal types (fcc, bcc, sc, diamond) by calculating the hessian of the energy density with respect to strain. An estimate of the error associated with the numerical differentiation performed is reported.
Test
Test Results
Link to Test Results page
Benchmark time
Usertime multiplied by the Whetstone Benchmark. This number can be used (approximately) to compare the performance of different models independently of the architecture on which the test was run.
Measured in Millions of Whetstone Instructions (MWI)
Computes the equilibrium crystal structure and energy for an arbitrary crystal at zero temperature and applied stress by performing symmetry-constrained relaxation. The crystal structure is specified using the AFLOW prototype designation. Multiple sets of free parameters corresponding to the crystal prototype may be specified as initial guesses for structure optimization. No guarantee is made regarding the stability of computed equilibria, nor that any are the ground state.
Test
Test Results
Link to Test Results page
Benchmark time
Usertime multiplied by the Whetstone Benchmark. This number can be used (approximately) to compare the performance of different models independently of the architecture on which the test was run.
Measured in Millions of Whetstone Instructions (MWI)
Equilibrium lattice constant and cohesive energy of a cubic lattice at zero temperature and pressure.
Test
Test Results
Link to Test Results page
Benchmark time
Usertime multiplied by the Whetstone Benchmark. This number can be used (approximately) to compare the performance of different models independently of the architecture on which the test was run.
Measured in Millions of Whetstone Instructions (MWI)
Calculates lattice constant of hexagonal bulk structures at zero temperature and pressure by using simplex minimization to minimize the potential energy.
Test
Test Results
Link to Test Results page
Benchmark time
Usertime multiplied by the Whetstone Benchmark. This number can be used (approximately) to compare the performance of different models independently of the architecture on which the test was run.
Measured in Millions of Whetstone Instructions (MWI)
This Test Driver uses LAMMPS to compute the linear thermal expansion coefficient at a finite temperature under a given pressure for a cubic lattice (fcc, bcc, sc, diamond) of a single given species.
Test
Test Results
Link to Test Results page
Benchmark time
Usertime multiplied by the Whetstone Benchmark. This number can be used (approximately) to compare the performance of different models independently of the architecture on which the test was run.
Measured in Millions of Whetstone Instructions (MWI)
Given an extended xyz file corresponding to a non-orthogonal periodic box of atoms, use LAMMPS to compute the total potential energy and atomic forces.
Test
Test Results
Link to Test Results page
Benchmark time
Usertime multiplied by the Whetstone Benchmark. This number can be used (approximately) to compare the performance of different models independently of the architecture on which the test was run.
Measured in Millions of Whetstone Instructions (MWI)
Computes the monovacancy formation energy and relaxation volume for cubic and hcp monoatomic crystals.
Test
Test Results
Link to Test Results page
Benchmark time
Usertime multiplied by the Whetstone Benchmark. This number can be used (approximately) to compare the performance of different models independently of the architecture on which the test was run.
Measured in Millions of Whetstone Instructions (MWI)
Computes the monovacancy formation and migration energies for cubic and hcp monoatomic crystals.
Test
Test Results
Link to Test Results page
Benchmark time
Usertime multiplied by the Whetstone Benchmark. This number can be used (approximately) to compare the performance of different models independently of the architecture on which the test was run.
Measured in Millions of Whetstone Instructions (MWI)
 MEAM_LAMMPS_HuangDongLiu_2018_Si__MO_050147023220_002