 MEAM_LAMMPS_HuangLiuDuan_2021_HfNbTaTiZr__MO_893505888031_002
Use this Potential
| Title
A single sentence description.
|
MEAM potential for HfNbTaTiZr alloy developed by Huang et al. (2021) v002 |
|---|---|
| Description
A short description of the Model describing its key features including for example: type of model (pair potential, 3-body potential, EAM, etc.), modeled species (Ac, Ag, ..., Zr), intended purpose, origin, and so on.
|
A modified embedded-atom method (MEAM) interatomic potential with good accuracy for studying chemical short-range order (CSRO) in the HfNbTaTiZr alloy system was developed. The potential accuracy was further validated on the formation enthalpies, lattice constants, and melting points for the solid solutions. |
| Species
The supported atomic species.
| Hf, Nb, Ta, Ti, Zr |
| Disclaimer
A statement of applicability provided by the contributor, informing users of the intended use of this KIM Item.
|
None |
| Content Origin | Files are provided by Xiusong Huang (Tsinghua University) on Feb 12, 2021, and posted with his permission. |
| Contributor |
Yaser Afshar |
| Maintainer |
Yaser Afshar |
| Developer |
Xiusong Huang Lehua Liu Xianbao Duan Wei-Bing Liao Jianjun Huang Huibin Sun Chunyan Yu |
| Published on KIM | 2023 |
| How to Cite |
This Model originally published in [1] is archived in OpenKIM [2-5]. [1] Huang X, Liu L, Duan X, Liao W, Huang J, Sun H, et al. Atomistic simulation of chemical short-range order in HfNbTaZr high entropy alloy based on a newly-developed interatomic potential. Materials & Design. 2021;202:109560. doi:10.1016/j.matdes.2021.109560 — (Primary Source) A primary source is a reference directly related to the item documenting its development, as opposed to other sources that are provided as background information. [2] Huang X, Liu L, Duan X, Liao W-B, Huang J, Sun H, et al. MEAM potential for HfNbTaTiZr alloy developed by Huang et al. (2021) v002. OpenKIM; 2023. doi:10.25950/6f4deef5 [3] Afshar Y, Hütter S, Rudd RE, Stukowski A, Tipton WW, Trinkle DR, et al. The modified embedded atom method (MEAM) potential v002. OpenKIM; 2023. doi:10.25950/ee5eba52 [4] Tadmor EB, Elliott RS, Sethna JP, Miller RE, Becker CA. The potential of atomistic simulations and the Knowledgebase of Interatomic Models. JOM. 2011;63(7):17. doi:10.1007/s11837-011-0102-6 [5] Elliott RS, Tadmor EB. Knowledgebase of Interatomic Models (KIM) Application Programming Interface (API). OpenKIM; 2011. doi:10.25950/ff8f563a Click here to download the above citation in BibTeX format. |
| Citations
This panel presents information regarding the papers that have cited the interatomic potential (IP) whose page you are on. The OpenKIM machine learning based Deep Citation framework is used to determine whether the citing article actually used the IP in computations (denoted by "USED") or only provides it as a background citation (denoted by "NOT USED"). For more details on Deep Citation and how to work with this panel, click the documentation link at the top of the panel. The word cloud to the right is generated from the abstracts of IP principle source(s) (given below in "How to Cite") and the citing articles that were determined to have used the IP in order to provide users with a quick sense of the types of physical phenomena to which this IP is applied. The bar chart shows the number of articles that cited the IP per year. Each bar is divided into green (articles that USED the IP) and blue (articles that did NOT USE the IP). Users are encouraged to correct Deep Citation errors in determination by clicking the speech icon next to a citing article and providing updated information. This will be integrated into the next Deep Citation learning cycle, which occurs on a regular basis. OpenKIM acknowledges the support of the Allen Institute for AI through the Semantic Scholar project for providing citation information and full text of articles when available, which are used to train the Deep Citation ML algorithm. |
This panel provides information on past usage of this interatomic potential (IP) powered by the OpenKIM Deep Citation framework. The word cloud indicates typical applications of the potential. The bar chart shows citations per year of this IP (bars are divided into articles that used the IP (green) and those that did not (blue)). The complete list of articles that cited this IP is provided below along with the Deep Citation determination on usage. See the Deep Citation documentation for more information. 
49 Citations (28 used)
Help us to determine which of the papers that cite this potential actually used it to perform calculations. If you know, click the .
USED (low confidence) X. Jin, S. Chen, C. Lemkan, and T. Li, “Role of local atomic short-range order distribution in alloys: Why it matters in Si-Ge-Sn alloys,” Physical Review Materials. 2023. link Times cited: 0 USED (low confidence) S.-P. Ju, C.-H. Yang, and H.-Y. Chen, “Unveiling Mechanisms of Self-Healing in CoCrFeMnNi/HfNbTaTiZr Dual-Phase High-Entropy Alloys: A Molecular Dynamics Simulation Study,” Materials Today Communications. 2023. link Times cited: 0 USED (low confidence) X. Duan et al., “Atomistic simulation of local chemical order in NbTiZrMoV high entropy alloy based on a newly-developed interatomic potential,” Computational Materials Science. 2023. link Times cited: 0 USED (low confidence) S. Ataollahi and M. Mahtabi, “An interatomic potential for ternary NiTiHf shape memory alloys based on modified embedded atom method,” Computational Materials Science. 2023. link Times cited: 2 USED (low confidence) Y.-C. Wu and J. Shao, “FCC-BCC Phase Transformation Induced Simultaneous Enhancement of Tensile Strength and Ductility at High Strain Rate in High-Entropy Alloy,” International Journal of Plasticity. 2023. link Times cited: 2 USED (low confidence) A. Chen, Y. Pan, J. Dai, W. Fu, and X. Song, “Theoretical study on the element distribution characteristics and the effects of oxygen in TiZrHfNb high entropy alloys,” Materials Today Communications. 2023. link Times cited: 1 USED (low confidence) M. Zhu, J. Wang, P. Jiang, F. Yuan, and X. Wu, “Formation of chemical short-range orders of two kinds and the co-existence with medium-range orders in an equiatomic VFeCoNi alloy,” Intermetallics. 2023. link Times cited: 1 USED (low confidence) D. Gu et al., “Designing (TiZrHf)100-xCux high entropy alloys with abnormal as-cast divorced eutectoid microstructure and balanced mechanical properties,” Materials Science and Engineering: A. 2023. link Times cited: 0 USED (low confidence) T. Li, H. Zong, F. Zhao, X. Ding, T. Lookman, and J. Sun, “Effects of atomic size mismatch on glass transition decoupling in high-entropy metallic glasses,” Acta Materialia. 2023. link Times cited: 0 USED (low confidence) C. Tsai, C.-H. Tung, C.-C. Chen, and S.-Y. Chang, “Chemical Complexity-Changed Deformation Behavior of NiTi-Based B2 Low- to High-Entropy Intermetallic Compounds: Atomistic Simulations,” Journal of Alloys and Compounds. 2023. link Times cited: 0 USED (low confidence) Z. Liang, Y. Wu, Y. Miao, W. Pan, and Y.-zhong Zhang, “Composition Design and Tensile Properties of Additive Manufactured Low Density Hf-Nb-Ta-Ti-Zr High Entropy Alloys Based on Atomic Simulations,” Materials. 2023. link Times cited: 1 Abstract: High-entropy alloy (HEA) is a new type of multi-principal al… read more USED (low confidence) Z. Sun et al., “An experimental and computational design low-modulus (HfNbTa)1-xTix multiprinciple elemental alloys with super formability for biomedical applications,” Materials Science and Engineering: A. 2023. link Times cited: 1 USED (low confidence) C. Yang et al., “Low modulus Ti-rich biocompatible TiNbZrTaHf concentrated alloys with exceptional plasticity,” Materials Research Letters. 2023. link Times cited: 3 Abstract: This study investigates the evolutions of microstructure and… read more USED (low confidence) J. Li, Y.-F. Wu, Z. Bai, W. Yu, and S. Shen, “Nanostructure-property relation of Σ5 grain boundary in HfNbZrTi high-entropy alloy under shear,” Journal of Materials Science. 2023. link Times cited: 2 USED (low confidence) A. Nazarahari, A. Fromm, H. Ozdemir, C. Klose, H. Maier, and D. Canadinc, “Determination of thermal conductivity of eutectic Al–Cu compounds utilizing experiments, molecular dynamics simulations and machine learning,” Modelling and Simulation in Materials Science and Engineering. 2023. link Times cited: 0 Abstract: In this study, the thermal conductivity ( κ ) of Al–Cu eutec… read more USED (low confidence) F. Tan, L. Li, J. Li, B. Liu, P. Liaw, and Q. Fang, “Multiscale modelling of irradiation damage behavior in high entropy alloys,” Advanced Powder Materials. 2023. link Times cited: 3 USED (low confidence) S. Xu, W. Jian, and I. Beyerlein, “Ideal simple shear strengths of two HfNbTaTi-based quinary refractory multi-principal element alloys,” APL Materials. 2022. link Times cited: 4 Abstract: Atomistic simulations are employed to investigate chemical s… read more USED (low confidence) A. Huang, S. Fensin, and M. Meyers, “Strain-Rate Effects and Dynamic Behavior of High Entropy Alloys,” Journal of Materials Research and Technology. 2022. link Times cited: 10 USED (low confidence) R. Fereidonnejad, A. O. Moghaddam, and M. Moaddeli, “Modified embedded-atom method interatomic potentials for Al-Ti, Al-Ta, Al-Zr, Al-Nb and Al-Hf binary intermetallic systems,” Computational Materials Science. 2022. link Times cited: 4 USED (low confidence) A. Manzoor and Y. Zhang, “Influence of Defect Thermodynamics on Self-Diffusion in Complex Concentrated Alloys with Chemical Ordering,” JOM. 2022. link Times cited: 2 USED (low confidence) R. Salloom, M. Baskes, and S. G. Srinivasan, “Atomic level simulations of the phase stability and stacking fault energy of FeCoCrMnSi high entropy alloy,” Modelling and Simulation in Materials Science and Engineering. 2022. link Times cited: 4 Abstract: High entropy alloys (HEAs) have many promising properties be… read more USED (low confidence) N. Zhang, K. Gan, and Z. Li, “Atomistic insights on the deformation mechanisms of Cox(CrNi)100-x multicomponent alloys: The effect of Co content,” Computational Materials Science. 2022. link Times cited: 5 USED (low confidence) S. Guo et al., “Research on optimizing strength and ductility of HfNbTaZr dual-phase high-entropy alloy by tuning chemical short-range order,” International Journal of Refractory Metals and Hard Materials. 2022. link Times cited: 2 USED (low confidence) M. Charpagne, J. Stinville, F. Wang, N. Philips, and T. Pollock, “Orientation dependent plastic localization in the refractory high entropy alloy HfNbTaTiZr at room temperature,” Materials Science and Engineering: A. 2022. link Times cited: 3 USED (low confidence) J. Startt, A. Kustas, J. Pegues, P. Yang, and R. Dingreville, “Compositional effects on the mechanical and thermal properties of MoNbTaTi refractory complex concentrated alloys,” Materials & Design. 2022. link Times cited: 7 USED (low confidence) H. Xiang and W. Guo, “A newly developed interatomic potential of Nb−Al−Ti ternary systems for high-temperature applications,” Acta Mechanica Sinica. 2022. link Times cited: 5 USED (low confidence) H. Xiang and W. Guo, “A newly developed interatomic potential of Nb−Al−Ti ternary systems for high-temperature applications,” Acta Mechanica Sinica. 2022. link Times cited: 0 USED (low confidence) S. Chen, Z. Aitken, V. Sorkin, Z. Yu, Z. Wu, and Y.-W. Zhang, “Modified Embedded‐Atom Method Potentials for the Plasticity and Fracture Behaviors of Unary HCP Metals,” Advanced Theory and Simulations. 2021. link Times cited: 3 Abstract: Modified embedded‐atom method (MEAM) potentials have been wi… read more NOT USED (low confidence) U. S. Anamu et al., “Fundamental design strategies for advancing the development of high entropy alloys for thermo-mechanical application: A critical review,” Journal of Materials Research and Technology. 2023. link Times cited: 0 NOT USED (low confidence) D. Jiang, L. Xie, and L. Wang, “Current Application Status of Multi-Scale Simulation and Machine Learning in Research on High-Entropy Alloys,” Journal of Materials Research and Technology. 2023. link Times cited: 1 NOT USED (low confidence) Q. Guo et al., “Hardening-softening of Al0.3CoCrFeNi high-entropy alloy under nanoindentation,” Materials & Design. 2023. link Times cited: 19 NOT USED (low confidence) Z. Li, D. Dong, and C. Dong, “Intuitive graphical presentation of cluster-plus-glue-atom model to obtain composition formulas of industrial alloys,” Materials Today Communications. 2023. link Times cited: 0 NOT USED (low confidence) A. Ferrari, F. Körmann, M. Asta, and J. Neugebauer, “Simulating short-range order in compositionally complex materials,” Nature Computational Science. 2023. link Times cited: 4 NOT USED (low confidence) Y.-hong Niu, D. Zhao, B. Zhu, S. Wang, Z. Wang, and H. Zhao, “Investigations on the role of chemical short-range order in the tensile deformation of FCC Co30Fe16.67Ni36.67Ti16.67 high-entropy alloys via Monte Carlo and molecular dynamics hybrid simulations,” Computational Materials Science. 2022. link Times cited: 4 NOT USED (low confidence) X. Wu, “Chemical short-range orders in high-/medium-entropy alloys,” Journal of Materials Science & Technology. 2022. link Times cited: 4 NOT USED (low confidence) Z. Zhang, L. Chen, J. Guo, X. Duan, B. Shan, and X. Duan, “Strategy to consider element distribution when constructing training datasets for developing machine learning potentials of alloys based on a Monte-Carlo-like method,” Physical Review B. 2022. link Times cited: 1 NOT USED (low confidence) B. Yao, Z. R. Liu, and R. F. Zhang, “EAPOTc: An integrated empirical interatomic potential optimization platform for compound solids,” Computational Materials Science. 2022. link Times cited: 1 NOT USED (low confidence) D.-Q. Doan, T. Fang, and T. Chen, “Structural transformation and strain localization at twin boundaries in Al0.4CoCrFeNi high-entropy alloy,” Applied Surface Science. 2022. link Times cited: 13 NOT USED (low confidence) V. Soni, S. K. Sanyal, K. R. Rao, and S. K. Sinha, “A review on phase prediction in high entropy alloys,” Proceedings of the Institution of Mechanical Engineers, Part C: Journal of Mechanical Engineering Science. 2021. link Times cited: 7 Abstract: The formation of single phase solid solution in High Entropy… read more NOT USED (low confidence) F. Wang et al., “Atomic-scale simulations in multi-component alloys and compounds: A review on advances in interatomic potential,” Journal of Materials Science & Technology. 2023. link Times cited: 5 NOT USED (low confidence) X. Liu et al., “A statistics-based study and machine-learning of stacking fault energies in HEAs,” Journal of Alloys and Compounds. 2023. link Times cited: 0 NOT USED (high confidence) G. Anand, S. Ghosh, and M. Eisenbach, “Order Parameter Engineering for Random Systems,” High Entropy Alloys & Materials. 2022. link Times cited: 1 NOT USED (high confidence) M. Zamani, H. Mirzadeh, M. Malekan, S. Cao, and J. Yeh, “Grain Growth in High-Entropy Alloys (HEAs): A Review,” High Entropy Alloys & Materials. 2022. link Times cited: 10 NOT USED (high confidence) L. T. W. Fey and I. Beyerlein, “Random Generation of Lattice Structures with Short-Range Order,” Integrating Materials and Manufacturing Innovation. 2022. link Times cited: 4 NOT USED (high confidence) F. Aquistapace et al., “Atomistic Simulations of Ductile Failure in a b.c.c. High-Entropy Alloy,” High Entropy Alloys & Materials. 2022. link Times cited: 4 NOT USED (high confidence) S. Ju, C.-C. Li, and H.-T. Shih, “How atoms of polycrystalline Nb20.6Mo21.7Ta15.6W21.1V21.0 refractory high-entropy alloys rearrange during the melting process,” Scientific Reports. 2022. link Times cited: 4 NOT USED (high confidence) J. S. Andrade, I. N. Bastos, and L. C. R. Aliaga, “Determinação das características estruturais e mecânicas da liga de alta entropia Hf-Nb-Ta-Zr,” VETOR - Revista de Ciências Exatas e Engenharias. 2021. link Times cited: 0 Abstract: Neste artigo, os comportamentos estrutural e mecânico da lig… read more NOT USED (high confidence) X.-song Huang, L. Liu, W. Liao, J.-J. Huang, H. Sun, and C.-Y. Yu, “Characterization of Nucleation Behavior in Temperature-Induced BCC-to-HCP Phase Transformation for High Entropy Alloy,” Acta Metallurgica Sinica (English Letters). 2021. link Times cited: 6 NOT USED (high confidence) S. Yamanaka, K. Ikeda, and S. Miura, “The effect of titanium and silicon addition on phase equilibrium and mechanical properties of CoCrFeMnNi-based high entropy alloy,” Journal of Materials Research. 2021. link Times cited: 9 Abstract: The effects of Ti and Si addition on the phase equilibrium a… read more |
| Funding | Not available |
| Short KIM ID
The unique KIM identifier code.
| MO_893505888031_002 |
| Extended KIM ID
The long form of the KIM ID including a human readable prefix (100 characters max), two underscores, and the Short KIM ID. Extended KIM IDs can only contain alpha-numeric characters (letters and digits) and underscores and must begin with a letter.
| MEAM_LAMMPS_HuangLiuDuan_2021_HfNbTaTiZr__MO_893505888031_002 |
| DOI |
10.25950/6f4deef5 https://doi.org/10.25950/6f4deef5 https://commons.datacite.org/doi.org/10.25950/6f4deef5 |
| KIM Item Type
Specifies whether this is a Portable Model (software implementation of an interatomic model); Portable Model with parameter file (parameter file to be read in by a Model Driver); Model Driver (software implementation of an interatomic model that reads in parameters).
| Portable Model using Model Driver MEAM_LAMMPS__MD_249792265679_002 |
| Driver | MEAM_LAMMPS__MD_249792265679_002 |
| KIM API Version | 2.2 |
| Potential Type | meam |
| Previous Version | MEAM_LAMMPS_HuangLiuDuan_2021_HfNbTaTiZr__MO_893505888031_001 |
| Grade | Name | Category | Brief Description | Full Results | Aux File(s) |
|---|---|---|---|---|---|
| P | vc-species-supported-as-stated | mandatory | The model supports all species it claims to support; see full description. |
Results | Files |
| P | vc-periodicity-support | mandatory | Periodic boundary conditions are handled correctly; see full description. |
Results | Files |
| P | vc-permutation-symmetry | mandatory | Total energy and forces are unchanged when swapping atoms of the same species; see full description. |
Results | Files |
| B | vc-forces-numerical-derivative | consistency | Forces computed by the model agree with numerical derivatives of the energy; see full description. |
Results | Files |
| F | vc-dimer-continuity-c1 | informational | The energy versus separation relation of a pair of atoms is C1 continuous (i.e. the function and its first derivative are continuous); see full description. |
Results | Files |
| P | vc-objectivity | informational | Total energy is unchanged and forces transform correctly under rigid-body translation and rotation; see full description. |
Results | Files |
| P | vc-inversion-symmetry | informational | Total energy is unchanged and forces change sign when inverting a configuration through the origin; see full description. |
Results | Files |
| P | vc-memory-leak | informational | The model code does not have memory leaks (i.e. it releases all allocated memory at the end); see full description. |
Results | Files |
| P | vc-thread-safe | mandatory | The model returns the same energy and forces when computed in serial and when using parallel threads for a set of configurations. Note that this is not a guarantee of thread safety; see full description. |
Results | Files |
| P | vc-unit-conversion | mandatory | The model is able to correctly convert its energy and/or forces to different unit sets; see full description. |
Results | Files |
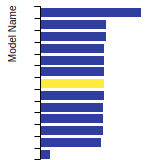
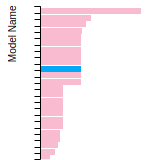
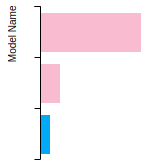
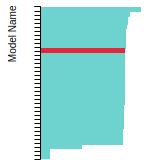
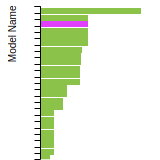
BCC Lattice Constant
This bar chart plot shows the mono-atomic body-centered cubic (bcc) lattice constant predicted by the current model (shown in the unique color) compared with the predictions for all other models in the OpenKIM Repository that support the species. The vertical bars show the average and standard deviation (one sigma) bounds for all model predictions. Graphs are generated for each species supported by the model.


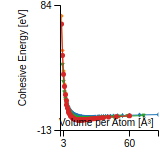
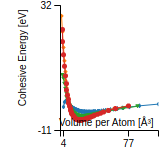
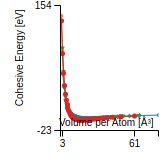
Cohesive Energy Graph
This graph shows the cohesive energy versus volume-per-atom for the current mode for four mono-atomic cubic phases (body-centered cubic (bcc), face-centered cubic (fcc), simple cubic (sc), and diamond). The curve with the lowest minimum is the ground state of the crystal if stable. (The crystal structure is enforced in these calculations, so the phase may not be stable.) Graphs are generated for each species supported by the model.


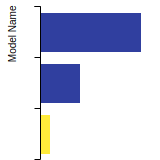
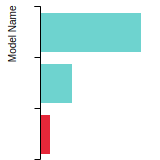
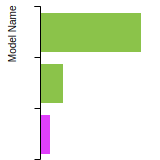
Diamond Lattice Constant
This bar chart plot shows the mono-atomic face-centered diamond lattice constant predicted by the current model (shown in the unique color) compared with the predictions for all other models in the OpenKIM Repository that support the species. The vertical bars show the average and standard deviation (one sigma) bounds for all model predictions. Graphs are generated for each species supported by the model.


Dislocation Core Energies
This graph shows the dislocation core energy of a cubic crystal at zero temperature and pressure for a specific set of dislocation core cutoff radii. After obtaining the total energy of the system from conjugate gradient minimizations, non-singular, isotropic and anisotropic elasticity are applied to obtain the dislocation core energy for each of these supercells with different dipole distances. Graphs are generated for each species supported by the model.
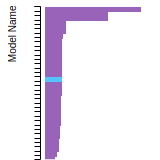
(No matching species)FCC Elastic Constants
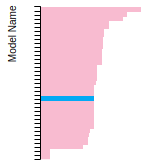
This bar chart plot shows the mono-atomic face-centered cubic (fcc) elastic constants predicted by the current model (shown in blue) compared with the predictions for all other models in the OpenKIM Repository that support the species. The vertical bars show the average and standard deviation (one sigma) bounds for all model predictions. Graphs are generated for each species supported by the model.

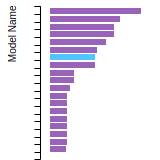

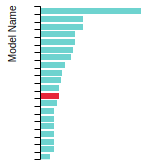
FCC Lattice Constant
This bar chart plot shows the mono-atomic face-centered cubic (fcc) lattice constant predicted by the current model (shown in red) compared with the predictions for all other models in the OpenKIM Repository that support the species. The vertical bars show the average and standard deviation (one sigma) bounds for all model predictions. Graphs are generated for each species supported by the model.

FCC Stacking Fault Energies
This bar chart plot shows the intrinsic and extrinsic stacking fault energies as well as the unstable stacking and unstable twinning energies for face-centered cubic (fcc) predicted by the current model (shown in blue) compared with the predictions for all other models in the OpenKIM Repository that support the species. The vertical bars show the average and standard deviation (one sigma) bounds for all model predictions. Graphs are generated for each species supported by the model.
(No matching species)FCC Surface Energies
This bar chart plot shows the mono-atomic face-centered cubic (fcc) relaxed surface energies predicted by the current model (shown in blue) compared with the predictions for all other models in the OpenKIM Repository that support the species. The vertical bars show the average and standard deviation (one sigma) bounds for all model predictions. Graphs are generated for each species supported by the model.
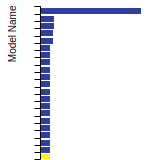
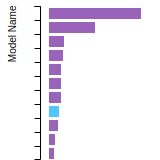
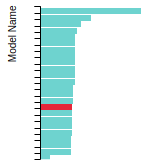
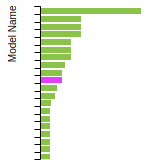
(No matching species)SC Lattice Constant
This bar chart plot shows the mono-atomic simple cubic (sc) lattice constant predicted by the current model (shown in the unique color) compared with the predictions for all other models in the OpenKIM Repository that support the species. The vertical bars show the average and standard deviation (one sigma) bounds for all model predictions. Graphs are generated for each species supported by the model.


Cubic Crystal Basic Properties Table
Species: HfSpecies: Nb
Species: Ta
Species: Ti
Species: Zr
Creators:
Contributor: karls
Publication Year: 2019
DOI: https://doi.org/10.25950/64cb38c5
This Test Driver uses LAMMPS to compute the cohesive energy of a given monoatomic cubic lattice (fcc, bcc, sc, or diamond) at a variety of lattice spacings. The lattice spacings range from a_min (=a_min_frac*a_0) to a_max (=a_max_frac*a_0) where a_0, a_min_frac, and a_max_frac are read from stdin (a_0 is typically approximately equal to the equilibrium lattice constant). The precise scaling and number of lattice spacings sampled between a_min and a_0 (a_0 and a_max) is specified by two additional parameters passed from stdin: N_lower and samplespacing_lower (N_upper and samplespacing_upper). Please see README.txt for further details.
Creators: Junhao Li and Ellad Tadmor
Contributor: tadmor
Publication Year: 2019
DOI: https://doi.org/10.25950/5853fb8f
Computes the cubic elastic constants for some common crystal types (fcc, bcc, sc, diamond) by calculating the hessian of the energy density with respect to strain. An estimate of the error associated with the numerical differentiation performed is reported.
Creators:
Contributor: ilia
Publication Year: 2025
DOI: https://doi.org/10.25950/866c7cfa
Computes the equilibrium crystal structure and energy for an arbitrary crystal at zero temperature and applied stress by performing symmetry-constrained relaxation. The crystal structure is specified using the AFLOW prototype designation. Multiple sets of free parameters corresponding to the crystal prototype may be specified as initial guesses for structure optimization. No guarantee is made regarding the stability of computed equilibria, nor that any are the ground state.
Creators: Daniel S. Karls and Junhao Li
Contributor: karls
Publication Year: 2019
DOI: https://doi.org/10.25950/2765e3bf
Equilibrium lattice constant and cohesive energy of a cubic lattice at zero temperature and pressure.
Creators: Daniel S. Karls and Junhao Li
Contributor: karls
Publication Year: 2019
DOI: https://doi.org/10.25950/c339ca32
Calculates lattice constant of hexagonal bulk structures at zero temperature and pressure by using simplex minimization to minimize the potential energy.
| Test | Test Results | Link to Test Results page | Benchmark time
Usertime multiplied by the Whetstone Benchmark. This number can be used (approximately) to compare the performance of different models independently of the architecture on which the test was run.
Measured in Millions of Whetstone Instructions (MWI) |
|---|---|---|---|
| Equilibrium lattice constants for hcp Hf v005 | view | 748337 | |
| Equilibrium lattice constants for hcp Nb v005 | view | 990122 | |
| Equilibrium lattice constants for hcp Ta v005 | view | 845519 | |
| Equilibrium lattice constants for hcp Ti v005 | view | 1063595 | |
| Equilibrium lattice constants for hcp Zr v005 | view | 1013754 |
Creators:
Contributor: mjwen
Publication Year: 2024
DOI: https://doi.org/10.25950/9d9822ec
This Test Driver uses LAMMPS to compute the linear thermal expansion coefficient at a finite temperature under a given pressure for a cubic lattice (fcc, bcc, sc, diamond) of a single given species.
| Test | Test Results | Link to Test Results page | Benchmark time
Usertime multiplied by the Whetstone Benchmark. This number can be used (approximately) to compare the performance of different models independently of the architecture on which the test was run.
Measured in Millions of Whetstone Instructions (MWI) |
|---|---|---|---|
| Linear thermal expansion coefficient of bcc Ta at 293.15 K under a pressure of 0 MPa v002 | view | 8987296 |
Creators: Matt Bierbaum
Contributor: mattbierbaum
Publication Year: 2019
DOI: https://doi.org/10.25950/6c43a4e6
Calculates the surface energy of several high symmetry surfaces and produces a broken-bond model fit. In latex form, the fit equations are given by:
E_{FCC} (\vec{n}) = p_1 (4 \left( |x+y| + |x-y| + |x+z| + |x-z| + |z+y| +|z-y|\right)) + p_2 (8 \left( |x| + |y| + |z|\right)) + p_3 (2 ( |x+ 2y + z| + |x+2y-z| + |x-2y + z| + |x-2y-z| + |2x+y+z| + |2x+y-z| +|2x-y+z| +|2x-y-z| +|x+y+2z| +|x+y-2z| +|x-y+2z| +|x-y-2z| ) + c
E_{BCC} (\vec{n}) = p_1 (6 \left( | x+y+z| + |x+y-z| + |-x+y-z| + |x-y+z| \right)) + p_2 (8 \left( |x| + |y| + |z|\right)) + p_3 (4 \left( |x+y| + |x-y| + |x+z| + |x-z| + |z+y| +|z-y|\right)) +c.
In Python, these two fits take the following form:
def BrokenBondFCC(params, index):
import numpy
x, y, z = index
x = x / numpy.sqrt(x**2.+y**2.+z**2.)
y = y / numpy.sqrt(x**2.+y**2.+z**2.)
z = z / numpy.sqrt(x**2.+y**2.+z**2.)
return params[0]*4* (abs(x+y) + abs(x-y) + abs(x+z) + abs(x-z) + abs(z+y) + abs(z-y)) + params[1]*8*(abs(x) + abs(y) + abs(z)) + params[2]*(abs(x+2*y+z) + abs(x+2*y-z) +abs(x-2*y+z) +abs(x-2*y-z) + abs(2*x+y+z) +abs(2*x+y-z) +abs(2*x-y+z) +abs(2*x-y-z) + abs(x+y+2*z) +abs(x+y-2*z) +abs(x-y+2*z) +abs(x-y-2*z))+params[3]
def BrokenBondBCC(params, x, y, z):
import numpy
x, y, z = index
x = x / numpy.sqrt(x**2.+y**2.+z**2.)
y = y / numpy.sqrt(x**2.+y**2.+z**2.)
z = z / numpy.sqrt(x**2.+y**2.+z**2.)
return params[0]*6*(abs(x+y+z) + abs(x-y-z) + abs(x-y+z) + abs(x+y-z)) + params[1]*8*(abs(x) + abs(y) + abs(z)) + params[2]*4* (abs(x+y) + abs(x-y) + abs(x+z) + abs(x-z) + abs(z+y) + abs(z-y)) + params[3]
| Test | Test Results | Link to Test Results page | Benchmark time
Usertime multiplied by the Whetstone Benchmark. This number can be used (approximately) to compare the performance of different models independently of the architecture on which the test was run.
Measured in Millions of Whetstone Instructions (MWI) |
|---|---|---|---|
| Broken-bond fit of high-symmetry surface energies in bcc Nb v004 | view | 136360 | |
| Broken-bond fit of high-symmetry surface energies in bcc Ta v004 | view | 118288 |
Creators:
Contributor: efuem
Publication Year: 2023
DOI: https://doi.org/10.25950/fca89cea
Computes the monovacancy formation energy and relaxation volume for cubic and hcp monoatomic crystals.
| Test | Test Results | Link to Test Results page | Benchmark time
Usertime multiplied by the Whetstone Benchmark. This number can be used (approximately) to compare the performance of different models independently of the architecture on which the test was run.
Measured in Millions of Whetstone Instructions (MWI) |
|---|---|---|---|
| Monovacancy formation energy and relaxation volume for bcc Nb | view | 773531 | |
| Monovacancy formation energy and relaxation volume for hcp Hf | view | 457772 | |
| Monovacancy formation energy and relaxation volume for hcp Ti | view | 467711 | |
| Monovacancy formation energy and relaxation volume for hcp Zr | view | 406680 |
Creators:
Contributor: efuem
Publication Year: 2023
DOI: https://doi.org/10.25950/c27ba3cd
Computes the monovacancy formation and migration energies for cubic and hcp monoatomic crystals.
| Test | Test Results | Link to Test Results page | Benchmark time
Usertime multiplied by the Whetstone Benchmark. This number can be used (approximately) to compare the performance of different models independently of the architecture on which the test was run.
Measured in Millions of Whetstone Instructions (MWI) |
|---|---|---|---|
| Vacancy formation and migration energy for bcc Nb | view | 3844978 | |
| Vacancy formation and migration energy for hcp Hf | view | 1742744 | |
| Vacancy formation and migration energy for hcp Ti | view | 4293400 | |
| Vacancy formation and migration energy for hcp Zr | view | 3387721 |
| Test | Error Categories | Link to Error page |
|---|---|---|
| Elastic constants for diamond Hf at zero temperature v001 | other | view |
| Elastic constants for diamond Ta at zero temperature v001 | other | view |
| Elastic constants for diamond Ti at zero temperature v001 | other | view |
| Elastic constants for diamond Zr at zero temperature v001 | other | view |
ElasticConstantsHexagonal__TD_612503193866_004
| Test | Error Categories | Link to Error page |
|---|---|---|
| Elastic constants for hcp Hf at zero temperature v004 | other | view |
| Elastic constants for hcp Nb at zero temperature v004 | other | view |
| Elastic constants for hcp Ta at zero temperature v004 | other | view |
| Elastic constants for hcp Ti at zero temperature v004 | other | view |
| Elastic constants for hcp Zr at zero temperature v004 | other | view |
EquilibriumCrystalStructure__TD_457028483760_000
| Test | Error Categories | Link to Error page |
|---|---|---|
| Equilibrium crystal structure and energy for Ti in AFLOW crystal prototype A_cF4_225_a v000 | other | view |
| Equilibrium crystal structure and energy for Zr in AFLOW crystal prototype A_hP2_194_c v000 | other | view |
EquilibriumCrystalStructure__TD_457028483760_003
| Test | Error Categories | Link to Error page |
|---|---|---|
| Equilibrium crystal structure and energy for Ta in AFLOW crystal prototype A_tP22_81_g5h v003 | other | view |
| Equilibrium crystal structure and energy for Ta in AFLOW crystal prototype A_tP30_113_c3e2f v003 | other | view |
SurfaceEnergyCubicCrystalBrokenBondFit__TD_955413365818_004
| Test | Error Categories | Link to Error page |
|---|---|---|
| Broken-bond fit of high-symmetry surface energies in bcc Nb v004 | other | view |
| Broken-bond fit of high-symmetry surface energies in bcc Ta v004 | other | view |
| MEAM_LAMMPS_HuangLiuDuan_2021_HfNbTaTiZr__MO_893505888031_002.txz | Tar+XZ | Linux and OS X archive |
| MEAM_LAMMPS_HuangLiuDuan_2021_HfNbTaTiZr__MO_893505888031_002.zip | Zip | Windows archive |
This Model requires a Model Driver. Archives for the Model Driver MEAM_LAMMPS__MD_249792265679_002 appear below.
| MEAM_LAMMPS__MD_249792265679_002.txz | Tar+XZ | Linux and OS X archive |
| MEAM_LAMMPS__MD_249792265679_002.zip | Zip | Windows archive |