 MEAM_LAMMPS_KangSaLee_2009_ZrAgCu__MO_813575892799_002
| Title
A single sentence description.
|
MEAM Potential for the Zr-Ag-Cu system developed by Kang et al. (2009) v002 |
|---|---|
| Description
A short description of the Model describing its key features including for example: type of model (pair potential, 3-body potential, EAM, etc.), modeled species (Ac, Ag, ..., Zr), intended purpose, origin, and so on.
|
In order to investigate the phase separation behavior in Cu–Zr–Ag bulk metallic glasses (BMGs) on an atomic level, a modified embedded-atom interatomic method potential for the Cu–Zr–Ag system has been newly developed. A clear tendency of phase separation of Ag-rich phases could be observed in the supercooled liquid, in reasonable agreement with experimental information. The potential can be used for atomistic investigations of the effects of alloying element Ag on a wide range of amorphous properties of Cu–Zr BMG. |
| Species
The supported atomic species.
| Ag, Cu, Zr |
| Disclaimer
A statement of applicability provided by the contributor, informing users of the intended use of this KIM Item.
|
None |
| Content Origin | http://cmse.postech.ac.kr/home_2nnmeam |
| Contributor |
Jaemin Wang |
| Maintainer |
Jaemin Wang |
| Developer |
Kyung-Han Kang Inyoung Sa Jae-Chul Lee E. Fleury Byeong-Joo Lee |
| Published on KIM | 2023 |
| How to Cite |
This Model originally published in [1] is archived in OpenKIM [2-5]. [1] Kang K-H, Sa I, Lee J-C, Fleury E, Lee B-J. Atomistic modeling of the Cu–Zr–Ag bulk metallic glass system. Scripta Materialia. 2009;61(8):801–4. doi:10.1016/j.scriptamat.2009.07.002 — (Primary Source) A primary source is a reference directly related to the item documenting its development, as opposed to other sources that are provided as background information. [2] Kang K-H, Sa I, Lee J-C, Fleury E, Lee B-J. MEAM Potential for the Zr-Ag-Cu system developed by Kang et al. (2009) v002. OpenKIM; 2023. doi:10.25950/b43c8959 [3] Afshar Y, Hütter S, Rudd RE, Stukowski A, Tipton WW, Trinkle DR, et al. The modified embedded atom method (MEAM) potential v002. OpenKIM; 2023. doi:10.25950/ee5eba52 [4] Tadmor EB, Elliott RS, Sethna JP, Miller RE, Becker CA. The potential of atomistic simulations and the Knowledgebase of Interatomic Models. JOM. 2011;63(7):17. doi:10.1007/s11837-011-0102-6 [5] Elliott RS, Tadmor EB. Knowledgebase of Interatomic Models (KIM) Application Programming Interface (API). OpenKIM; 2011. doi:10.25950/ff8f563a Click here to download the above citation in BibTeX format. |
| Citations
This panel presents information regarding the papers that have cited the interatomic potential (IP) whose page you are on. The OpenKIM machine learning based Deep Citation framework is used to determine whether the citing article actually used the IP in computations (denoted by "USED") or only provides it as a background citation (denoted by "NOT USED"). For more details on Deep Citation and how to work with this panel, click the documentation link at the top of the panel. The word cloud to the right is generated from the abstracts of IP principle source(s) (given below in "How to Cite") and the citing articles that were determined to have used the IP in order to provide users with a quick sense of the types of physical phenomena to which this IP is applied. The bar chart shows the number of articles that cited the IP per year. Each bar is divided into green (articles that USED the IP) and blue (articles that did NOT USE the IP). Users are encouraged to correct Deep Citation errors in determination by clicking the speech icon next to a citing article and providing updated information. This will be integrated into the next Deep Citation learning cycle, which occurs on a regular basis. OpenKIM acknowledges the support of the Allen Institute for AI through the Semantic Scholar project for providing citation information and full text of articles when available, which are used to train the Deep Citation ML algorithm. |
This panel provides information on past usage of this interatomic potential (IP) powered by the OpenKIM Deep Citation framework. The word cloud indicates typical applications of the potential. The bar chart shows citations per year of this IP (bars are divided into articles that used the IP (green) and those that did not (blue)). The complete list of articles that cited this IP is provided below along with the Deep Citation determination on usage. See the Deep Citation documentation for more information. 
25 Citations (16 used)
Help us to determine which of the papers that cite this potential actually used it to perform calculations. If you know, click the .
USED (high confidence) B. Waters, D. S. Karls, I. Nikiforov, R. Elliott, E. Tadmor, and B. Runnels, “Automated determination of grain boundary energy and potential-dependence using the OpenKIM framework,” Computational Materials Science. 2022. link Times cited: 5 USED (low confidence) S.-M. Lee, G. Han, K. P. Marimuthu, and H. Lee, “Mechanical property evaluation of thin film metallic glasses via molecular dynamics and finite element analyses,” Journal of Non-Crystalline Solids. 2024. link Times cited: 0 USED (low confidence) H. Mei et al., “Development of Machine Learning and Empirical Interatomic Potentials for the Binary Zr-Sn System,” Journal of Nuclear Materials. 2023. link Times cited: 0 USED (low confidence) Y. Tian, F. Chen, Z. Cui, and X. Tian, “Effects of atomic size misfit on dislocation mobility in FCC dense solid solution: Atomic simulations and phenomenological modeling,” International Journal of Plasticity. 2022. link Times cited: 4 USED (low confidence) A. Clément and T. Auger, “An EAM potential for α-brass copper–zinc alloys: application to plasticity and fracture,” Modelling and Simulation in Materials Science and Engineering. 2022. link Times cited: 1 Abstract: An embedded atom method potential has been developed for cop… read more USED (low confidence) R. Singh, C. Hano, F. Tavanti, and B. Sharma, “Biogenic Synthesis and Characterization of Antioxidant and Antimicrobial Silver Nanoparticles Using Flower Extract of Couroupita guianensis Aubl.,” Materials. 2021. link Times cited: 6 Abstract: Couroupita guianensis Aubl. is an important medicinal tree. … read more USED (low confidence) L. E. Atouani, E. E. koraychy, K. Sbiaai, M. Mazroui, and A. Hasnaoui, “Cluster adsorption and migration energetics on hcp Ti (0001) surfaces via atomistic simulations,” Thin Solid Films. 2019. link Times cited: 8 USED (low confidence) Y. Cheng et al., “Dynamic and structural heterogeneity in undercooled miscible and immiscible metallic liquid,” Journal of Alloys and Compounds. 2019. link Times cited: 4 USED (low confidence) Y. Wang, C. Peng, X. Li, Y. Cheng, L. Jia, and L. Wang, “Dynamical mechanical analysis of metallic glass with and without miscibility gap,” Materials Science and Engineering: A. 2018. link Times cited: 2 USED (low confidence) H. Hao and D. Lau, “Atomistic modeling of metallic thin films by modified embedded atom method,” Applied Surface Science. 2017. link Times cited: 24 USED (low confidence) I. Cora, P. Pekker, I. Dódony, and D. Janovszky, “Single crystal structure determination and refinement of AgZrCu4 and Ag-containing Cu10Zr7 by precession electron diffraction and tomography techniques,” Journal of Alloys and Compounds. 2016. link Times cited: 8 USED (low confidence) B. Jelinek et al., “Modified embedded atom method potential for Al, Si, Mg, Cu, and Fe alloys,” Physical Review B. 2011. link Times cited: 218 Abstract: A set of modified embedded-atom method (MEAM) potentials for… read more USED (low confidence) Y. Cheng and E. Ma, “Atomic-level structure and structure–property relationship in metallic glasses,” Progress in Materials Science. 2011. link Times cited: 1296 USED (low confidence) B.-J. Lee, W. Ko, H.-K. Kim, and E.-H. Kim, “The modified embedded-atom method interatomic potentials and recent progress in atomistic simulations,” Calphad-computer Coupling of Phase Diagrams and Thermochemistry. 2010. link Times cited: 137 USED (low confidence) J. Park, J. Kim, and E. Park, “Structural behaviors of single and multiple amorphous alloys deformed by forced cold rolling,” Intermetallics. 2010. link Times cited: 10 USED (low confidence) Y.-S. Lou et al., “An anomalous structure disordering in Zr–Cu–Ag supercooled glass-forming liquids,” Intermetallics. 2023. link Times cited: 0 NOT USED (high confidence) O. G. Nicholls, D. Frost, V. Tuli, J. Smutná, M. Wenman, and P. Burr, “Transferability of Zr-Zr interatomic potentials,” Journal of Nuclear Materials. 2022. link Times cited: 6 NOT USED (high confidence) C. Yang et al., “Overcoming immiscibility toward bimetallic catalyst library,” Science Advances. 2020. link Times cited: 81 Abstract: A general nonequilibrium synthesis strategy is reported to a… read more NOT USED (high confidence) G. Almyras, D. Sangiovanni, and K. Sarakinos, “Semi-Empirical Force-Field Model for the Ti1−xAlxN (0 ≤ x ≤ 1) System,” Materials. 2019. link Times cited: 21 Abstract: We present a modified embedded atom method (MEAM) semi-empir… read more NOT USED (high confidence) C. Royall and S. R. Williams, “The role of local structure in dynamical arrest,” Physics Reports. 2014. link Times cited: 328 NOT USED (high confidence) D. Janovszky, A. Sycheva, K. Tomolya, J. Geiger, J. Sólyom, and A. Roósz, “Solidification processes in Cu–Zr–Ag amorphisable alloy system,” Journal of Alloys and Compounds. 2014. link Times cited: 7 NOT USED (high confidence) H. Gao, A. Otero-de-la-Roza, S. Aouadi, E. Johnson, and A. Martini, “An empirical model for silver tantalate,” Modelling and Simulation in Materials Science and Engineering. 2013. link Times cited: 13 Abstract: A set of parameters for the modified embedded atom method (M… read more NOT USED (high confidence) J. Chun and B. Lee, “Atomistic calculations of mechanical properties of Ni-Ti-C metallic glass systems,” Journal of Mechanical Science and Technology. 2013. link Times cited: 3 NOT USED (high confidence) J. Chun and B. Lee, “Atomistic calculations of mechanical properties of Ni-Ti-C metallic glass systems,” Journal of Mechanical Science and Technology. 2013. link Times cited: 0 NOT USED (high confidence) J. Harvey, A. Gheribi, and P. Chartrand, “On the determination of the glass forming ability of AlxZr1−x alloys using molecular dynamics, Monte Carlo simulations, and classical thermodynamics,” Journal of Applied Physics. 2012. link Times cited: 9 Abstract: In this work, the glass forming ability of Al-Zr alloys is q… read more |
| Funding | Not available |
| Short KIM ID
The unique KIM identifier code.
| MO_813575892799_002 |
| Extended KIM ID
The long form of the KIM ID including a human readable prefix (100 characters max), two underscores, and the Short KIM ID. Extended KIM IDs can only contain alpha-numeric characters (letters and digits) and underscores and must begin with a letter.
| MEAM_LAMMPS_KangSaLee_2009_ZrAgCu__MO_813575892799_002 |
| DOI |
10.25950/b43c8959 https://doi.org/10.25950/b43c8959 https://commons.datacite.org/doi.org/10.25950/b43c8959 |
| KIM Item Type
Specifies whether this is a Portable Model (software implementation of an interatomic model); Portable Model with parameter file (parameter file to be read in by a Model Driver); Model Driver (software implementation of an interatomic model that reads in parameters).
| Portable Model using Model Driver MEAM_LAMMPS__MD_249792265679_002 |
| Driver | MEAM_LAMMPS__MD_249792265679_002 |
| KIM API Version | 2.2 |
| Potential Type | meam |
| Previous Version | MEAM_LAMMPS_KangSaLee_2009_ZrAgCu__MO_813575892799_001 |
| Grade | Name | Category | Brief Description | Full Results | Aux File(s) |
|---|---|---|---|---|---|
| P | vc-species-supported-as-stated | mandatory | The model supports all species it claims to support; see full description. |
Results | Files |
| P | vc-periodicity-support | mandatory | Periodic boundary conditions are handled correctly; see full description. |
Results | Files |
| P | vc-permutation-symmetry | mandatory | Total energy and forces are unchanged when swapping atoms of the same species; see full description. |
Results | Files |
| A | vc-forces-numerical-derivative | consistency | Forces computed by the model agree with numerical derivatives of the energy; see full description. |
Results | Files |
| F | vc-dimer-continuity-c1 | informational | The energy versus separation relation of a pair of atoms is C1 continuous (i.e. the function and its first derivative are continuous); see full description. |
Results | Files |
| P | vc-objectivity | informational | Total energy is unchanged and forces transform correctly under rigid-body translation and rotation; see full description. |
Results | Files |
| P | vc-inversion-symmetry | informational | Total energy is unchanged and forces change sign when inverting a configuration through the origin; see full description. |
Results | Files |
| P | vc-memory-leak | informational | The model code does not have memory leaks (i.e. it releases all allocated memory at the end); see full description. |
Results | Files |
| P | vc-thread-safe | mandatory | The model returns the same energy and forces when computed in serial and when using parallel threads for a set of configurations. Note that this is not a guarantee of thread safety; see full description. |
Results | Files |
| P | vc-unit-conversion | mandatory | The model is able to correctly convert its energy and/or forces to different unit sets; see full description. |
Results | Files |
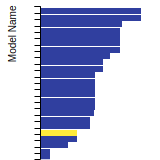
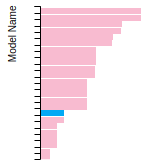
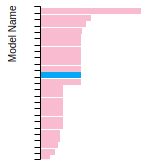
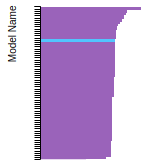
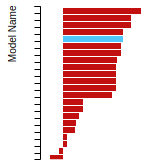
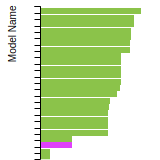
BCC Lattice Constant
This bar chart plot shows the mono-atomic body-centered cubic (bcc) lattice constant predicted by the current model (shown in the unique color) compared with the predictions for all other models in the OpenKIM Repository that support the species. The vertical bars show the average and standard deviation (one sigma) bounds for all model predictions. Graphs are generated for each species supported by the model.
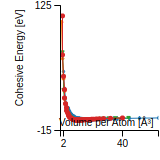
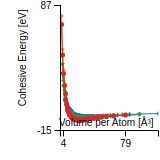
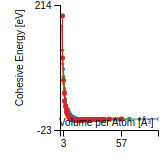
Cohesive Energy Graph
This graph shows the cohesive energy versus volume-per-atom for the current mode for four mono-atomic cubic phases (body-centered cubic (bcc), face-centered cubic (fcc), simple cubic (sc), and diamond). The curve with the lowest minimum is the ground state of the crystal if stable. (The crystal structure is enforced in these calculations, so the phase may not be stable.) Graphs are generated for each species supported by the model.
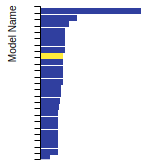
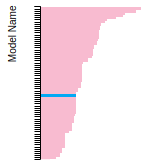
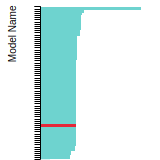
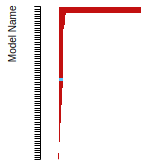
Diamond Lattice Constant
This bar chart plot shows the mono-atomic face-centered diamond lattice constant predicted by the current model (shown in the unique color) compared with the predictions for all other models in the OpenKIM Repository that support the species. The vertical bars show the average and standard deviation (one sigma) bounds for all model predictions. Graphs are generated for each species supported by the model.
Dislocation Core Energies
This graph shows the dislocation core energy of a cubic crystal at zero temperature and pressure for a specific set of dislocation core cutoff radii. After obtaining the total energy of the system from conjugate gradient minimizations, non-singular, isotropic and anisotropic elasticity are applied to obtain the dislocation core energy for each of these supercells with different dipole distances. Graphs are generated for each species supported by the model.
(No matching species)FCC Elastic Constants
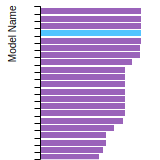
This bar chart plot shows the mono-atomic face-centered cubic (fcc) elastic constants predicted by the current model (shown in blue) compared with the predictions for all other models in the OpenKIM Repository that support the species. The vertical bars show the average and standard deviation (one sigma) bounds for all model predictions. Graphs are generated for each species supported by the model.
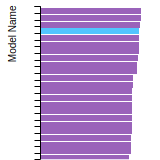
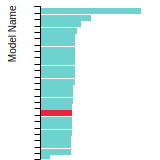
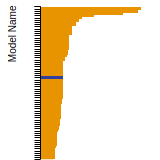
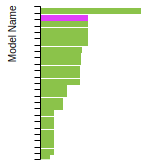
FCC Lattice Constant
This bar chart plot shows the mono-atomic face-centered cubic (fcc) lattice constant predicted by the current model (shown in red) compared with the predictions for all other models in the OpenKIM Repository that support the species. The vertical bars show the average and standard deviation (one sigma) bounds for all model predictions. Graphs are generated for each species supported by the model.
FCC Stacking Fault Energies
This bar chart plot shows the intrinsic and extrinsic stacking fault energies as well as the unstable stacking and unstable twinning energies for face-centered cubic (fcc) predicted by the current model (shown in blue) compared with the predictions for all other models in the OpenKIM Repository that support the species. The vertical bars show the average and standard deviation (one sigma) bounds for all model predictions. Graphs are generated for each species supported by the model.
FCC Surface Energies
This bar chart plot shows the mono-atomic face-centered cubic (fcc) relaxed surface energies predicted by the current model (shown in blue) compared with the predictions for all other models in the OpenKIM Repository that support the species. The vertical bars show the average and standard deviation (one sigma) bounds for all model predictions. Graphs are generated for each species supported by the model.
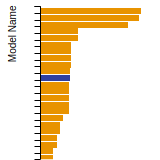
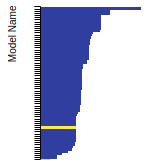
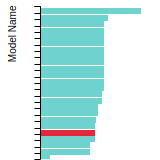
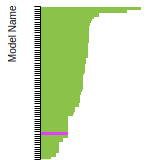
SC Lattice Constant
This bar chart plot shows the mono-atomic simple cubic (sc) lattice constant predicted by the current model (shown in the unique color) compared with the predictions for all other models in the OpenKIM Repository that support the species. The vertical bars show the average and standard deviation (one sigma) bounds for all model predictions. Graphs are generated for each species supported by the model.
Cubic Crystal Basic Properties Table
Species: AgSpecies: Cu
Species: Zr
Creators:
Contributor: karls
Publication Year: 2019
DOI: https://doi.org/10.25950/64cb38c5
This Test Driver uses LAMMPS to compute the cohesive energy of a given monoatomic cubic lattice (fcc, bcc, sc, or diamond) at a variety of lattice spacings. The lattice spacings range from a_min (=a_min_frac*a_0) to a_max (=a_max_frac*a_0) where a_0, a_min_frac, and a_max_frac are read from stdin (a_0 is typically approximately equal to the equilibrium lattice constant). The precise scaling and number of lattice spacings sampled between a_min and a_0 (a_0 and a_max) is specified by two additional parameters passed from stdin: N_lower and samplespacing_lower (N_upper and samplespacing_upper). Please see README.txt for further details.
Creators:
Contributor: ilia
Publication Year: 2024
DOI: https://doi.org/10.25950/888f9943
Computes the elastic constants for an arbitrary crystal. A robust computational protocol is used, attempting multiple methods and step sizes to achieve an acceptably low error in numerical differentiation and deviation from material symmetry. The crystal structure is specified using the AFLOW prototype designation as part of the Crystal Genome testing framework. In addition, the distance from the obtained elasticity tensor to the nearest isotropic tensor is computed.
| Test | Test Results | Link to Test Results page | Benchmark time
Usertime multiplied by the Whetstone Benchmark. This number can be used (approximately) to compare the performance of different models independently of the architecture on which the test was run.
Measured in Millions of Whetstone Instructions (MWI) |
|---|---|---|---|
| Elastic constants for CuZr in AFLOW crystal prototype A10B7_oC68_64_f2g_adef at zero temperature and pressure v000 | view | 308843 |
Creators: Junhao Li and Ellad Tadmor
Contributor: tadmor
Publication Year: 2019
DOI: https://doi.org/10.25950/5853fb8f
Computes the cubic elastic constants for some common crystal types (fcc, bcc, sc, diamond) by calculating the hessian of the energy density with respect to strain. An estimate of the error associated with the numerical differentiation performed is reported.
Creators:
Contributor: ilia
Publication Year: 2023
DOI: https://doi.org/10.25950/e8a7ed84
Computes the equilibrium crystal structure and energy for an arbitrary crystal at zero temperature and applied stress by performing symmetry-constrained relaxation. The crystal structure is specified using the AFLOW prototype designation. Multiple sets of free parameters corresponding to the crystal prototype may be specified as initial guesses for structure optimization. No guarantee is made regarding the stability of computed equilibria, nor that any are the ground state.
| Test | Test Results | Link to Test Results page | Benchmark time
Usertime multiplied by the Whetstone Benchmark. This number can be used (approximately) to compare the performance of different models independently of the architecture on which the test was run.
Measured in Millions of Whetstone Instructions (MWI) |
|---|---|---|---|
| Equilibrium crystal structure and energy for Ag in AFLOW crystal prototype A_cF4_225_a v001 | view | 84075 | |
| Equilibrium crystal structure and energy for Cu in AFLOW crystal prototype A_cF4_225_a v001 | view | 79289 | |
| Equilibrium crystal structure and energy for Cu in AFLOW crystal prototype A_cI2_229_a v001 | view | 63829 | |
| Equilibrium crystal structure and energy for Ag in AFLOW crystal prototype A_hP2_194_c v001 | view | 68467 | |
| Equilibrium crystal structure and energy for Ag in AFLOW crystal prototype A_hP4_194_ac v001 | view | 74504 |
Creators:
Contributor: ilia
Publication Year: 2024
DOI: https://doi.org/10.25950/2f2c4ad3
Computes the equilibrium crystal structure and energy for an arbitrary crystal at zero temperature and applied stress by performing symmetry-constrained relaxation. The crystal structure is specified using the AFLOW prototype designation. Multiple sets of free parameters corresponding to the crystal prototype may be specified as initial guesses for structure optimization. No guarantee is made regarding the stability of computed equilibria, nor that any are the ground state.
Creators:
Contributor: brunnels
Publication Year: 2022
DOI: https://doi.org/10.25950/2c59c9d6
Computes grain boundary energy for a range of tilt angles given a crystal structure, tilt axis, and material.
Creators: Daniel S. Karls and Junhao Li
Contributor: karls
Publication Year: 2019
DOI: https://doi.org/10.25950/2765e3bf
Equilibrium lattice constant and cohesive energy of a cubic lattice at zero temperature and pressure.
Creators: Daniel S. Karls and Junhao Li
Contributor: karls
Publication Year: 2019
DOI: https://doi.org/10.25950/c339ca32
Calculates lattice constant of hexagonal bulk structures at zero temperature and pressure by using simplex minimization to minimize the potential energy.
| Test | Test Results | Link to Test Results page | Benchmark time
Usertime multiplied by the Whetstone Benchmark. This number can be used (approximately) to compare the performance of different models independently of the architecture on which the test was run.
Measured in Millions of Whetstone Instructions (MWI) |
|---|---|---|---|
| Equilibrium lattice constants for hcp Ag v005 | view | 115216 | |
| Equilibrium lattice constants for hcp Cu v005 | view | 103437 | |
| Equilibrium lattice constants for hcp Zr v005 | view | 100713 |
Creators: Mingjian Wen
Contributor: mjwen
Publication Year: 2019
DOI: https://doi.org/10.25950/fc69d82d
This Test Driver uses LAMMPS to compute the linear thermal expansion coefficient at a finite temperature under a given pressure for a cubic lattice (fcc, bcc, sc, diamond) of a single given species.
| Test | Test Results | Link to Test Results page | Benchmark time
Usertime multiplied by the Whetstone Benchmark. This number can be used (approximately) to compare the performance of different models independently of the architecture on which the test was run.
Measured in Millions of Whetstone Instructions (MWI) |
|---|---|---|---|
| Linear thermal expansion coefficient of fcc Ag at 293.15 K under a pressure of 0 MPa v001 | view | 129701358 | |
| Linear thermal expansion coefficient of fcc Cu at 293.15 K under a pressure of 0 MPa v001 | view | 69571882 |
Creators: Matt Bierbaum
Contributor: mattbierbaum
Publication Year: 2019
DOI: https://doi.org/10.25950/64f4999b
Calculates the phonon dispersion relations for fcc lattices and records the results as curves.
| Test | Test Results | Link to Test Results page | Benchmark time
Usertime multiplied by the Whetstone Benchmark. This number can be used (approximately) to compare the performance of different models independently of the architecture on which the test was run.
Measured in Millions of Whetstone Instructions (MWI) |
|---|---|---|---|
| Phonon dispersion relations for fcc Ag v004 | view | 87677 | |
| Phonon dispersion relations for fcc Cu v004 | view | 125744 |
Creators:
Contributor: SubrahmanyamPattamatta
Publication Year: 2019
DOI: https://doi.org/10.25950/b4cfaf9a
Intrinsic and extrinsic stacking fault energies, unstable stacking fault energy, unstable twinning energy, stacking fault energy as a function of fractional displacement, and gamma surface for a monoatomic FCC lattice at zero temperature and pressure.
| Test | Test Results | Link to Test Results page | Benchmark time
Usertime multiplied by the Whetstone Benchmark. This number can be used (approximately) to compare the performance of different models independently of the architecture on which the test was run.
Measured in Millions of Whetstone Instructions (MWI) |
|---|---|---|---|
| Stacking and twinning fault energies for fcc Ag v002 | view | 32885173 | |
| Stacking and twinning fault energies for fcc Cu v002 | view | 32754923 |
Creators: Matt Bierbaum
Contributor: mattbierbaum
Publication Year: 2019
DOI: https://doi.org/10.25950/6c43a4e6
Calculates the surface energy of several high symmetry surfaces and produces a broken-bond model fit. In latex form, the fit equations are given by:
E_{FCC} (\vec{n}) = p_1 (4 \left( |x+y| + |x-y| + |x+z| + |x-z| + |z+y| +|z-y|\right)) + p_2 (8 \left( |x| + |y| + |z|\right)) + p_3 (2 ( |x+ 2y + z| + |x+2y-z| + |x-2y + z| + |x-2y-z| + |2x+y+z| + |2x+y-z| +|2x-y+z| +|2x-y-z| +|x+y+2z| +|x+y-2z| +|x-y+2z| +|x-y-2z| ) + c
E_{BCC} (\vec{n}) = p_1 (6 \left( | x+y+z| + |x+y-z| + |-x+y-z| + |x-y+z| \right)) + p_2 (8 \left( |x| + |y| + |z|\right)) + p_3 (4 \left( |x+y| + |x-y| + |x+z| + |x-z| + |z+y| +|z-y|\right)) +c.
In Python, these two fits take the following form:
def BrokenBondFCC(params, index):
import numpy
x, y, z = index
x = x / numpy.sqrt(x**2.+y**2.+z**2.)
y = y / numpy.sqrt(x**2.+y**2.+z**2.)
z = z / numpy.sqrt(x**2.+y**2.+z**2.)
return params[0]*4* (abs(x+y) + abs(x-y) + abs(x+z) + abs(x-z) + abs(z+y) + abs(z-y)) + params[1]*8*(abs(x) + abs(y) + abs(z)) + params[2]*(abs(x+2*y+z) + abs(x+2*y-z) +abs(x-2*y+z) +abs(x-2*y-z) + abs(2*x+y+z) +abs(2*x+y-z) +abs(2*x-y+z) +abs(2*x-y-z) + abs(x+y+2*z) +abs(x+y-2*z) +abs(x-y+2*z) +abs(x-y-2*z))+params[3]
def BrokenBondBCC(params, x, y, z):
import numpy
x, y, z = index
x = x / numpy.sqrt(x**2.+y**2.+z**2.)
y = y / numpy.sqrt(x**2.+y**2.+z**2.)
z = z / numpy.sqrt(x**2.+y**2.+z**2.)
return params[0]*6*(abs(x+y+z) + abs(x-y-z) + abs(x-y+z) + abs(x+y-z)) + params[1]*8*(abs(x) + abs(y) + abs(z)) + params[2]*4* (abs(x+y) + abs(x-y) + abs(x+z) + abs(x-z) + abs(z+y) + abs(z-y)) + params[3]
| Test | Test Results | Link to Test Results page | Benchmark time
Usertime multiplied by the Whetstone Benchmark. This number can be used (approximately) to compare the performance of different models independently of the architecture on which the test was run.
Measured in Millions of Whetstone Instructions (MWI) |
|---|---|---|---|
| Broken-bond fit of high-symmetry surface energies in fcc Ag v004 | view | 113434 | |
| Broken-bond fit of high-symmetry surface energies in fcc Cu v004 | view | 134341 |
Creators:
Contributor: efuem
Publication Year: 2023
DOI: https://doi.org/10.25950/fca89cea
Computes the monovacancy formation energy and relaxation volume for cubic and hcp monoatomic crystals.
| Test | Test Results | Link to Test Results page | Benchmark time
Usertime multiplied by the Whetstone Benchmark. This number can be used (approximately) to compare the performance of different models independently of the architecture on which the test was run.
Measured in Millions of Whetstone Instructions (MWI) |
|---|---|---|---|
| Monovacancy formation energy and relaxation volume for fcc Ag | view | 441355 | |
| Monovacancy formation energy and relaxation volume for fcc Cu | view | 556056 | |
| Monovacancy formation energy and relaxation volume for hcp Zr | view | 399686 |
Creators:
Contributor: efuem
Publication Year: 2023
DOI: https://doi.org/10.25950/c27ba3cd
Computes the monovacancy formation and migration energies for cubic and hcp monoatomic crystals.
| Test | Test Results | Link to Test Results page | Benchmark time
Usertime multiplied by the Whetstone Benchmark. This number can be used (approximately) to compare the performance of different models independently of the architecture on which the test was run.
Measured in Millions of Whetstone Instructions (MWI) |
|---|---|---|---|
| Vacancy formation and migration energy for fcc Ag | view | 4006501 | |
| Vacancy formation and migration energy for fcc Cu | view | 1866059 | |
| Vacancy formation and migration energy for hcp Zr | view | 4615858 |
| Test | Error Categories | Link to Error page |
|---|---|---|
| Elastic constants for diamond Zr at zero temperature v001 | other | view |
ElasticConstantsHexagonal__TD_612503193866_004
| Test | Error Categories | Link to Error page |
|---|---|---|
| Elastic constants for hcp Ag at zero temperature v004 | other | view |
| Elastic constants for hcp Cu at zero temperature v004 | other | view |
| Elastic constants for hcp Zr at zero temperature v004 | other | view |
EquilibriumCrystalStructure__TD_457028483760_002
| Test | Error Categories | Link to Error page |
|---|---|---|
| Equilibrium crystal structure and energy for CuZr in AFLOW crystal prototype AB_mP4_11_e_e v002 | other | view |
GrainBoundaryCubicCrystalSymmetricTiltRelaxedEnergyVsAngle__TD_410381120771_003
| Test | Error Categories | Link to Error page |
|---|---|---|
| Relaxed energy as a function of tilt angle for a 112 symmetric tilt grain boundary in fcc Cu v001 | other | view |
PhononDispersionCurve__TD_530195868545_004
| Test | Error Categories | Link to Error page |
|---|---|---|
| Phonon dispersion relations for fcc Ag v004 | other | view |
| Phonon dispersion relations for fcc Cu v004 | other | view |
SurfaceEnergyCubicCrystalBrokenBondFit__TD_955413365818_004
| Test | Error Categories | Link to Error page |
|---|---|---|
| Broken-bond fit of high-symmetry surface energies in fcc Ag v004 | other | view |
| Broken-bond fit of high-symmetry surface energies in fcc Cu v004 | other | view |
| MEAM_LAMMPS_KangSaLee_2009_ZrAgCu__MO_813575892799_002.txz | Tar+XZ | Linux and OS X archive |
| MEAM_LAMMPS_KangSaLee_2009_ZrAgCu__MO_813575892799_002.zip | Zip | Windows archive |
This Model requires a Model Driver. Archives for the Model Driver MEAM_LAMMPS__MD_249792265679_002 appear below.
| MEAM_LAMMPS__MD_249792265679_002.txz | Tar+XZ | Linux and OS X archive |
| MEAM_LAMMPS__MD_249792265679_002.zip | Zip | Windows archive |