 MEAM_LAMMPS_KavousiNovakBaskes_2019_NiTi__MO_050461957184_002
| Title
A single sentence description.
|
MEAM potential for Ni-Ti alloys developed by Kavousi et al, (2019) v002 |
|---|---|
| Description
A short description of the Model describing its key features including for example: type of model (pair potential, 3-body potential, EAM, etc.), modeled species (Ac, Ag, ..., Zr), intended purpose, origin, and so on.
|
New interatomic potentials for the Ti, Ni, and the binary Ti-Ni system developed based on the second nearest-neighbor modified embedded-atom method (2NN-MEAM) formalism. These potentials were fit to melting points, latent heats, the binary phase diagrams for the Ti-rich and Ni-rich regions, and the liquid phase enthalpy of mixing for binary alloys. Therefore they are particularly suited for calculations of crystal-melt (CM) interface thermodynamic and transport properties. The accuracy of the potentials for pure Ti and pure Ni were tested against both 0 K and high-temperature properties by comparing various properties obtained from experiments or density functional theory calculations, including structural properties, elastic constants, point-defect properties, surface energies, temperatures, and enthalpies of phase transformations, and diffusivity and viscosity in the liquid phase. Ti-Ni's fitted binary potential was also tested against various non-fitted properties at 0 K and high temperatures, including lattice parameters, formation energies of different intermetallic compounds, and the temperature dependence of liquid density at various concentrations. |
| Species
The supported atomic species.
| Ni, Ti |
| Disclaimer
A statement of applicability provided by the contributor, informing users of the intended use of this KIM Item.
|
None |
| Content Origin | NIST IPRP (https://www.ctcms.nist.gov/potentials/system/Ni-Ti/#Ni-Ti) |
| Contributor |
Yaser Afshar |
| Maintainer |
Yaser Afshar |
| Developer |
Sepideh Kavousi Brian R. Novak Michael I. Baskes Mohsen Asle Zaeem Dorel Moldovan |
| Published on KIM | 2023 |
| How to Cite |
This Model originally published in [1] is archived in OpenKIM [2-5]. [1] Kavousi S, Novak BR, Baskes MI, Asle Zaeem M, Moldovan D. Modified embedded-atom method potential for high-temperature crystal-melt properties of Ti–Ni alloys and its application to phase field simulation of solidification. Modelling and Simulation in Materials Science and Engineering. 2019Dec;28(1):015006. doi:10.1088/1361-651x/ab580c — (Primary Source) A primary source is a reference directly related to the item documenting its development, as opposed to other sources that are provided as background information. [2] Kavousi S, Novak BR, Baskes MI, Zaeem MA, Moldovan D. MEAM potential for Ni-Ti alloys developed by Kavousi et al, (2019) v002. OpenKIM; 2023. doi:10.25950/a46c3ac7 [3] Afshar Y, Hütter S, Rudd RE, Stukowski A, Tipton WW, Trinkle DR, et al. The modified embedded atom method (MEAM) potential v002. OpenKIM; 2023. doi:10.25950/ee5eba52 [4] Tadmor EB, Elliott RS, Sethna JP, Miller RE, Becker CA. The potential of atomistic simulations and the Knowledgebase of Interatomic Models. JOM. 2011;63(7):17. doi:10.1007/s11837-011-0102-6 [5] Elliott RS, Tadmor EB. Knowledgebase of Interatomic Models (KIM) Application Programming Interface (API). OpenKIM; 2011. doi:10.25950/ff8f563a Click here to download the above citation in BibTeX format. |
| Citations
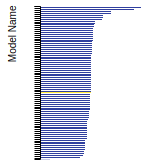
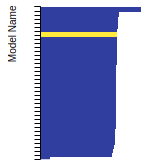
This panel presents information regarding the papers that have cited the interatomic potential (IP) whose page you are on. The OpenKIM machine learning based Deep Citation framework is used to determine whether the citing article actually used the IP in computations (denoted by "USED") or only provides it as a background citation (denoted by "NOT USED"). For more details on Deep Citation and how to work with this panel, click the documentation link at the top of the panel. The word cloud to the right is generated from the abstracts of IP principle source(s) (given below in "How to Cite") and the citing articles that were determined to have used the IP in order to provide users with a quick sense of the types of physical phenomena to which this IP is applied. The bar chart shows the number of articles that cited the IP per year. Each bar is divided into green (articles that USED the IP) and blue (articles that did NOT USE the IP). Users are encouraged to correct Deep Citation errors in determination by clicking the speech icon next to a citing article and providing updated information. This will be integrated into the next Deep Citation learning cycle, which occurs on a regular basis. OpenKIM acknowledges the support of the Allen Institute for AI through the Semantic Scholar project for providing citation information and full text of articles when available, which are used to train the Deep Citation ML algorithm. |
This panel provides information on past usage of this interatomic potential (IP) powered by the OpenKIM Deep Citation framework. The word cloud indicates typical applications of the potential. The bar chart shows citations per year of this IP (bars are divided into articles that used the IP (green) and those that did not (blue)). The complete list of articles that cited this IP is provided below along with the Deep Citation determination on usage. See the Deep Citation documentation for more information. 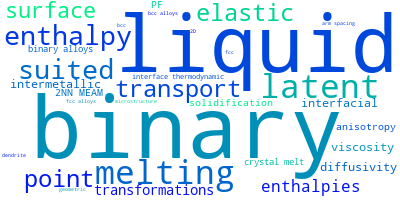
20 Citations (18 used)
Help us to determine which of the papers that cite this potential actually used it to perform calculations. If you know, click the .
USED (low confidence) J. Li, R. Xiao, J. Qin, Y. Ruan, and H. Li, “The structural exploration of thermodynamics and dynamics in Ti-Ni liquid by ab initio molecular dynamics simulation,” Computational Materials Science. 2023. link Times cited: 0 USED (low confidence) Y. Zhou, Y.-chao Liang, L.-li Zhou, Z.-an Tian, Q. Chen, and Y. Mo, “Effects of pore diameter and B2-NiTi crystal on plasticity of amorphous Ni-Ti alloy based on molecular dynamics simulation,” Journal of Materials Research and Technology. 2023. link Times cited: 0 USED (low confidence) S. Kavousi and M. A. Zaeem, “Mechanisms of nucleation and defect growth in undercooled melt containing oxide clusters,” Acta Materialia. 2023. link Times cited: 0 USED (low confidence) S. Kavousi, V. Ankudinov, P. Galenko, and M. A. Zaeem, “Atomistic-informed kinetic phase-field modeling of non-equilibrium crystal growth during rapid solidification,” Acta Materialia. 2023. link Times cited: 1 USED (low confidence) G. Li, T. Yu, P. Wu, and M. Chen, “Molecular Dynamics Simulation of NiTi Shape Memory Alloys Produced by Laser Powder Bed Fusion: Laser Parameters on Phase Transformation Behavior,” Materials. 2023. link Times cited: 1 Abstract: In this study, the deposition, powder spreading, and laser f… read more USED (low confidence) B. Waters, D. S. Karls, I. Nikiforov, R. Elliott, E. Tadmor, and B. Runnels, “Automated determination of grain boundary energy and potential-dependence using the OpenKIM framework,” Computational Materials Science. 2022. link Times cited: 5 USED (low confidence) H. Tang et al., “High accuracy neural network interatomic potential for NiTi shape memory alloy,” Acta Materialia. 2022. link Times cited: 9 USED (low confidence) M. G. Urazaliev, M. E. Stupak, and V. Popov, “An Atomistic Simulation of Special Tilt Boundaries in α-Ti: Structure, Energy, Point Defects, and Grain-Boundary Self-Diffusion,” Physics of Metals and Metallography. 2022. link Times cited: 0 USED (low confidence) G. Azizi, S. Kavousi, and M. A. Zaeem, “Interactive Effects of Interfacial Energy Anisotropy and Solute Transport on Solidification Patterns of Al-Cu Alloys,” Acta Materialia. 2022. link Times cited: 16 USED (low confidence) A. Mahata, T. Mukhopadhyay, and M. A. Zaeem, “Modified embedded-atom method interatomic potentials for Al-Cu, Al-Fe and Al-Ni binary alloys: From room temperature to melting point,” Computational Materials Science. 2022. link Times cited: 27 USED (low confidence) S. Kavousi, A. Gates, L. Jin, and M. A. Zaeem, “A Temperature-Dependent Atomistic-Informed Phase-Field Model to Study Dendritic Growth,” Journal of Crystal Growth. 2021. link Times cited: 6 USED (low confidence) L. L. Rosa and F. Maresca, “On the impact of lattice parameter accuracy of atomistic simulations on the microstructure of Ni–Ti shape memory alloys,” Modelling and Simulation in Materials Science and Engineering. 2021. link Times cited: 1 Abstract: Ni–Ti is a key shape-memory alloy (SMA) system for applicati… read more USED (low confidence) R. Namakian, B. R. Novak, X. Zhang, W. Meng, and D. Moldovan, “A combined molecular dynamics/Monte Carlo simulation of Cu thin film growth on TiN substrates: Illustration of growth mechanisms and comparison with experiments,” Applied Surface Science. 2021. link Times cited: 6 USED (low confidence) M. Su, Q. Deng, L. Liu, L.-Y. Chen, H. He, and Y. Miao, “Molecular dynamics study on mechanical behaviors of Ti/Ni nanolaminate with a pre-existing void,” Nano Materials Science. 2021. link Times cited: 2 USED (low confidence) S. Kavousi, B. R. Novak, D. Moldovan, and M. A. Zaeem, “Quantitative prediction of rapid solidification by integrated atomistic and phase-field modeling,” Acta Materialia. 2021. link Times cited: 8 USED (low confidence) S. Kavousi and M. A. Zaeem, “Quantitative phase-field modeling of solute trapping in rapid solidification,” Acta Materialia. 2020. link Times cited: 28 USED (low confidence) M. Dodaran et al., “Effect of alloying elements on the γ’ antiphase boundary energy in Ni-base superalloys,” Intermetallics. 2020. link Times cited: 42 USED (low confidence) V. Parmar, S. Singh, A. K. Singh, S. Kumar, and D. Kalyanasundaram, “Hybrid thermo-physical modelling and experimentation of ultrafast laser-based fabrication of polycrystalline core–amorphous shell nitinol nanoparticles,” Optics & Laser Technology. 2023. link Times cited: 0 NOT USED (high confidence) Y. Nagatsuma, M. Ohno, T. Takaki, and Y. Shibuta, “Bayesian Data Assimilation of Temperature Dependence of Solid–Liquid Interfacial Properties of Nickel,” Nanomaterials. 2021. link Times cited: 8 Abstract: Temperature dependence of solid–liquid interfacial propertie… read more NOT USED (high confidence) D. Tourret, H. Liu, and J. Llorca, “Phase-field modeling of microstructure evolution: Recent applications, perspectives and challenges,” Progress in Materials Science. 2021. link Times cited: 61 |
| Funding | Not available |
| Short KIM ID
The unique KIM identifier code.
| MO_050461957184_002 |
| Extended KIM ID
The long form of the KIM ID including a human readable prefix (100 characters max), two underscores, and the Short KIM ID. Extended KIM IDs can only contain alpha-numeric characters (letters and digits) and underscores and must begin with a letter.
| MEAM_LAMMPS_KavousiNovakBaskes_2019_NiTi__MO_050461957184_002 |
| DOI |
10.25950/a46c3ac7 https://doi.org/10.25950/a46c3ac7 https://commons.datacite.org/doi.org/10.25950/a46c3ac7 |
| KIM Item Type
Specifies whether this is a Portable Model (software implementation of an interatomic model); Portable Model with parameter file (parameter file to be read in by a Model Driver); Model Driver (software implementation of an interatomic model that reads in parameters).
| Portable Model using Model Driver MEAM_LAMMPS__MD_249792265679_002 |
| Driver | MEAM_LAMMPS__MD_249792265679_002 |
| KIM API Version | 2.2 |
| Potential Type | meam |
| Previous Version | MEAM_LAMMPS_KavousiNovakBaskes_2019_NiTi__MO_050461957184_001 |
| Grade | Name | Category | Brief Description | Full Results | Aux File(s) |
|---|---|---|---|---|---|
| P | vc-species-supported-as-stated | mandatory | The model supports all species it claims to support; see full description. |
Results | Files |
| P | vc-periodicity-support | mandatory | Periodic boundary conditions are handled correctly; see full description. |
Results | Files |
| P | vc-permutation-symmetry | mandatory | Total energy and forces are unchanged when swapping atoms of the same species; see full description. |
Results | Files |
| A | vc-forces-numerical-derivative | consistency | Forces computed by the model agree with numerical derivatives of the energy; see full description. |
Results | Files |
| F | vc-dimer-continuity-c1 | informational | The energy versus separation relation of a pair of atoms is C1 continuous (i.e. the function and its first derivative are continuous); see full description. |
Results | Files |
| P | vc-objectivity | informational | Total energy is unchanged and forces transform correctly under rigid-body translation and rotation; see full description. |
Results | Files |
| P | vc-inversion-symmetry | informational | Total energy is unchanged and forces change sign when inverting a configuration through the origin; see full description. |
Results | Files |
| P | vc-memory-leak | informational | The model code does not have memory leaks (i.e. it releases all allocated memory at the end); see full description. |
Results | Files |
| P | vc-thread-safe | mandatory | The model returns the same energy and forces when computed in serial and when using parallel threads for a set of configurations. Note that this is not a guarantee of thread safety; see full description. |
Results | Files |
| P | vc-unit-conversion | mandatory | The model is able to correctly convert its energy and/or forces to different unit sets; see full description. |
Results | Files |
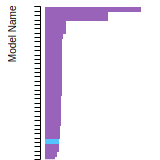
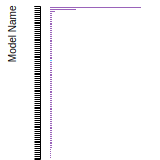
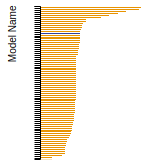
BCC Lattice Constant
This bar chart plot shows the mono-atomic body-centered cubic (bcc) lattice constant predicted by the current model (shown in the unique color) compared with the predictions for all other models in the OpenKIM Repository that support the species. The vertical bars show the average and standard deviation (one sigma) bounds for all model predictions. Graphs are generated for each species supported by the model.
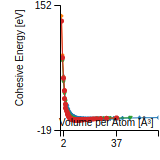
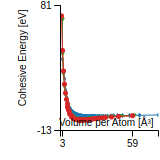
Cohesive Energy Graph
This graph shows the cohesive energy versus volume-per-atom for the current mode for four mono-atomic cubic phases (body-centered cubic (bcc), face-centered cubic (fcc), simple cubic (sc), and diamond). The curve with the lowest minimum is the ground state of the crystal if stable. (The crystal structure is enforced in these calculations, so the phase may not be stable.) Graphs are generated for each species supported by the model.
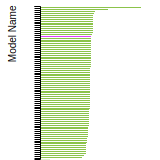
Diamond Lattice Constant
This bar chart plot shows the mono-atomic face-centered diamond lattice constant predicted by the current model (shown in the unique color) compared with the predictions for all other models in the OpenKIM Repository that support the species. The vertical bars show the average and standard deviation (one sigma) bounds for all model predictions. Graphs are generated for each species supported by the model.
Dislocation Core Energies
This graph shows the dislocation core energy of a cubic crystal at zero temperature and pressure for a specific set of dislocation core cutoff radii. After obtaining the total energy of the system from conjugate gradient minimizations, non-singular, isotropic and anisotropic elasticity are applied to obtain the dislocation core energy for each of these supercells with different dipole distances. Graphs are generated for each species supported by the model.
(No matching species)FCC Elastic Constants
This bar chart plot shows the mono-atomic face-centered cubic (fcc) elastic constants predicted by the current model (shown in blue) compared with the predictions for all other models in the OpenKIM Repository that support the species. The vertical bars show the average and standard deviation (one sigma) bounds for all model predictions. Graphs are generated for each species supported by the model.
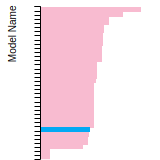
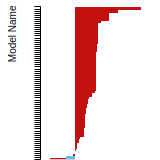
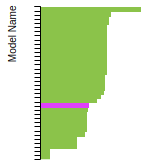
FCC Lattice Constant
This bar chart plot shows the mono-atomic face-centered cubic (fcc) lattice constant predicted by the current model (shown in red) compared with the predictions for all other models in the OpenKIM Repository that support the species. The vertical bars show the average and standard deviation (one sigma) bounds for all model predictions. Graphs are generated for each species supported by the model.
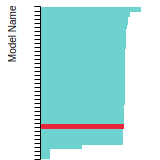
FCC Stacking Fault Energies
This bar chart plot shows the intrinsic and extrinsic stacking fault energies as well as the unstable stacking and unstable twinning energies for face-centered cubic (fcc) predicted by the current model (shown in blue) compared with the predictions for all other models in the OpenKIM Repository that support the species. The vertical bars show the average and standard deviation (one sigma) bounds for all model predictions. Graphs are generated for each species supported by the model.
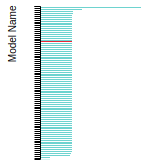
FCC Surface Energies
This bar chart plot shows the mono-atomic face-centered cubic (fcc) relaxed surface energies predicted by the current model (shown in blue) compared with the predictions for all other models in the OpenKIM Repository that support the species. The vertical bars show the average and standard deviation (one sigma) bounds for all model predictions. Graphs are generated for each species supported by the model.
SC Lattice Constant
This bar chart plot shows the mono-atomic simple cubic (sc) lattice constant predicted by the current model (shown in the unique color) compared with the predictions for all other models in the OpenKIM Repository that support the species. The vertical bars show the average and standard deviation (one sigma) bounds for all model predictions. Graphs are generated for each species supported by the model.
Cubic Crystal Basic Properties Table
Species: NiSpecies: Ti
Creators:
Contributor: karls
Publication Year: 2019
DOI: https://doi.org/10.25950/64cb38c5
This Test Driver uses LAMMPS to compute the cohesive energy of a given monoatomic cubic lattice (fcc, bcc, sc, or diamond) at a variety of lattice spacings. The lattice spacings range from a_min (=a_min_frac*a_0) to a_max (=a_max_frac*a_0) where a_0, a_min_frac, and a_max_frac are read from stdin (a_0 is typically approximately equal to the equilibrium lattice constant). The precise scaling and number of lattice spacings sampled between a_min and a_0 (a_0 and a_max) is specified by two additional parameters passed from stdin: N_lower and samplespacing_lower (N_upper and samplespacing_upper). Please see README.txt for further details.
| Test | Test Results | Link to Test Results page | Benchmark time
Usertime multiplied by the Whetstone Benchmark. This number can be used (approximately) to compare the performance of different models independently of the architecture on which the test was run.
Measured in Millions of Whetstone Instructions (MWI) |
|---|---|---|---|
| Cohesive energy versus lattice constant curve for bcc Ni v004 | view | 7151 | |
| Cohesive energy versus lattice constant curve for bcc Ti v004 | view | 7708 | |
| Cohesive energy versus lattice constant curve for diamond Ni v004 | view | 7330 | |
| Cohesive energy versus lattice constant curve for diamond Ti v004 | view | 7519 | |
| Cohesive energy versus lattice constant curve for fcc Ni v004 | view | 7290 | |
| Cohesive energy versus lattice constant curve for fcc Ti v004 | view | 8026 | |
| Cohesive energy versus lattice constant curve for sc Ni v004 | view | 7479 | |
| Cohesive energy versus lattice constant curve for sc Ti v004 | view | 8614 |
Creators: Junhao Li and Ellad Tadmor
Contributor: tadmor
Publication Year: 2019
DOI: https://doi.org/10.25950/5853fb8f
Computes the cubic elastic constants for some common crystal types (fcc, bcc, sc, diamond) by calculating the hessian of the energy density with respect to strain. An estimate of the error associated with the numerical differentiation performed is reported.
| Test | Test Results | Link to Test Results page | Benchmark time
Usertime multiplied by the Whetstone Benchmark. This number can be used (approximately) to compare the performance of different models independently of the architecture on which the test was run.
Measured in Millions of Whetstone Instructions (MWI) |
|---|---|---|---|
| Elastic constants for bcc Ni at zero temperature v006 | view | 40344 | |
| Elastic constants for bcc Ti at zero temperature v006 | view | 35043 | |
| Elastic constants for diamond Ni at zero temperature v001 | view | 56320 | |
| Elastic constants for fcc Ni at zero temperature v006 | view | 28418 | |
| Elastic constants for fcc Ti at zero temperature v006 | view | 35398 | |
| Elastic constants for sc Ni at zero temperature v006 | view | 41964 | |
| Elastic constants for sc Ti at zero temperature v006 | view | 29006 |
Creators:
Contributor: ilia
Publication Year: 2024
DOI: https://doi.org/10.25950/2f2c4ad3
Computes the equilibrium crystal structure and energy for an arbitrary crystal at zero temperature and applied stress by performing symmetry-constrained relaxation. The crystal structure is specified using the AFLOW prototype designation. Multiple sets of free parameters corresponding to the crystal prototype may be specified as initial guesses for structure optimization. No guarantee is made regarding the stability of computed equilibria, nor that any are the ground state.
Creators:
Contributor: brunnels
Publication Year: 2022
DOI: https://doi.org/10.25950/2c59c9d6
Computes grain boundary energy for a range of tilt angles given a crystal structure, tilt axis, and material.
| Test | Test Results | Link to Test Results page | Benchmark time
Usertime multiplied by the Whetstone Benchmark. This number can be used (approximately) to compare the performance of different models independently of the architecture on which the test was run.
Measured in Millions of Whetstone Instructions (MWI) |
|---|---|---|---|
| Relaxed energy as a function of tilt angle for a 100 symmetric tilt grain boundary in fcc Ni v001 | view | 38570837 | |
| Relaxed energy as a function of tilt angle for a 111 symmetric tilt grain boundary in fcc Ni v001 | view | 63320602 |
Creators: Daniel S. Karls and Junhao Li
Contributor: karls
Publication Year: 2019
DOI: https://doi.org/10.25950/2765e3bf
Equilibrium lattice constant and cohesive energy of a cubic lattice at zero temperature and pressure.
| Test | Test Results | Link to Test Results page | Benchmark time
Usertime multiplied by the Whetstone Benchmark. This number can be used (approximately) to compare the performance of different models independently of the architecture on which the test was run.
Measured in Millions of Whetstone Instructions (MWI) |
|---|---|---|---|
| Equilibrium zero-temperature lattice constant for bcc Ni v007 | view | 17227 | |
| Equilibrium zero-temperature lattice constant for bcc Ti v007 | view | 17953 | |
| Equilibrium zero-temperature lattice constant for diamond Ni v007 | view | 17823 | |
| Equilibrium zero-temperature lattice constant for diamond Ti v007 | view | 26798 | |
| Equilibrium zero-temperature lattice constant for fcc Ni v007 | view | 24000 | |
| Equilibrium zero-temperature lattice constant for fcc Ti v007 | view | 17376 |
Creators: Daniel S. Karls and Junhao Li
Contributor: karls
Publication Year: 2019
DOI: https://doi.org/10.25950/c339ca32
Calculates lattice constant of hexagonal bulk structures at zero temperature and pressure by using simplex minimization to minimize the potential energy.
| Test | Test Results | Link to Test Results page | Benchmark time
Usertime multiplied by the Whetstone Benchmark. This number can be used (approximately) to compare the performance of different models independently of the architecture on which the test was run.
Measured in Millions of Whetstone Instructions (MWI) |
|---|---|---|---|
| Equilibrium lattice constants for hcp Ni v005 | view | 214383 |
Creators:
Contributor: mjwen
Publication Year: 2024
DOI: https://doi.org/10.25950/9d9822ec
This Test Driver uses LAMMPS to compute the linear thermal expansion coefficient at a finite temperature under a given pressure for a cubic lattice (fcc, bcc, sc, diamond) of a single given species.
| Test | Test Results | Link to Test Results page | Benchmark time
Usertime multiplied by the Whetstone Benchmark. This number can be used (approximately) to compare the performance of different models independently of the architecture on which the test was run.
Measured in Millions of Whetstone Instructions (MWI) |
|---|---|---|---|
| Linear thermal expansion coefficient of fcc Ni at 293.15 K under a pressure of 0 MPa v002 | view | 4111751 |
Creators: Matt Bierbaum
Contributor: mattbierbaum
Publication Year: 2019
DOI: https://doi.org/10.25950/64f4999b
Calculates the phonon dispersion relations for fcc lattices and records the results as curves.
| Test | Test Results | Link to Test Results page | Benchmark time
Usertime multiplied by the Whetstone Benchmark. This number can be used (approximately) to compare the performance of different models independently of the architecture on which the test was run.
Measured in Millions of Whetstone Instructions (MWI) |
|---|---|---|---|
| Phonon dispersion relations for fcc Ni v004 | view | 86097 |
Creators:
Contributor: SubrahmanyamPattamatta
Publication Year: 2019
DOI: https://doi.org/10.25950/b4cfaf9a
Intrinsic and extrinsic stacking fault energies, unstable stacking fault energy, unstable twinning energy, stacking fault energy as a function of fractional displacement, and gamma surface for a monoatomic FCC lattice at zero temperature and pressure.
| Test | Test Results | Link to Test Results page | Benchmark time
Usertime multiplied by the Whetstone Benchmark. This number can be used (approximately) to compare the performance of different models independently of the architecture on which the test was run.
Measured in Millions of Whetstone Instructions (MWI) |
|---|---|---|---|
| Stacking and twinning fault energies for fcc Ni v002 | view | 69981051 |
Creators: Matt Bierbaum
Contributor: mattbierbaum
Publication Year: 2019
DOI: https://doi.org/10.25950/6c43a4e6
Calculates the surface energy of several high symmetry surfaces and produces a broken-bond model fit. In latex form, the fit equations are given by:
E_{FCC} (\vec{n}) = p_1 (4 \left( |x+y| + |x-y| + |x+z| + |x-z| + |z+y| +|z-y|\right)) + p_2 (8 \left( |x| + |y| + |z|\right)) + p_3 (2 ( |x+ 2y + z| + |x+2y-z| + |x-2y + z| + |x-2y-z| + |2x+y+z| + |2x+y-z| +|2x-y+z| +|2x-y-z| +|x+y+2z| +|x+y-2z| +|x-y+2z| +|x-y-2z| ) + c
E_{BCC} (\vec{n}) = p_1 (6 \left( | x+y+z| + |x+y-z| + |-x+y-z| + |x-y+z| \right)) + p_2 (8 \left( |x| + |y| + |z|\right)) + p_3 (4 \left( |x+y| + |x-y| + |x+z| + |x-z| + |z+y| +|z-y|\right)) +c.
In Python, these two fits take the following form:
def BrokenBondFCC(params, index):
import numpy
x, y, z = index
x = x / numpy.sqrt(x**2.+y**2.+z**2.)
y = y / numpy.sqrt(x**2.+y**2.+z**2.)
z = z / numpy.sqrt(x**2.+y**2.+z**2.)
return params[0]*4* (abs(x+y) + abs(x-y) + abs(x+z) + abs(x-z) + abs(z+y) + abs(z-y)) + params[1]*8*(abs(x) + abs(y) + abs(z)) + params[2]*(abs(x+2*y+z) + abs(x+2*y-z) +abs(x-2*y+z) +abs(x-2*y-z) + abs(2*x+y+z) +abs(2*x+y-z) +abs(2*x-y+z) +abs(2*x-y-z) + abs(x+y+2*z) +abs(x+y-2*z) +abs(x-y+2*z) +abs(x-y-2*z))+params[3]
def BrokenBondBCC(params, x, y, z):
import numpy
x, y, z = index
x = x / numpy.sqrt(x**2.+y**2.+z**2.)
y = y / numpy.sqrt(x**2.+y**2.+z**2.)
z = z / numpy.sqrt(x**2.+y**2.+z**2.)
return params[0]*6*(abs(x+y+z) + abs(x-y-z) + abs(x-y+z) + abs(x+y-z)) + params[1]*8*(abs(x) + abs(y) + abs(z)) + params[2]*4* (abs(x+y) + abs(x-y) + abs(x+z) + abs(x-z) + abs(z+y) + abs(z-y)) + params[3]
| Test | Test Results | Link to Test Results page | Benchmark time
Usertime multiplied by the Whetstone Benchmark. This number can be used (approximately) to compare the performance of different models independently of the architecture on which the test was run.
Measured in Millions of Whetstone Instructions (MWI) |
|---|---|---|---|
| Broken-bond fit of high-symmetry surface energies in fcc Ni v004 | view | 187960 |
Creators:
Contributor: efuem
Publication Year: 2023
DOI: https://doi.org/10.25950/fca89cea
Computes the monovacancy formation energy and relaxation volume for cubic and hcp monoatomic crystals.
| Test | Test Results | Link to Test Results page | Benchmark time
Usertime multiplied by the Whetstone Benchmark. This number can be used (approximately) to compare the performance of different models independently of the architecture on which the test was run.
Measured in Millions of Whetstone Instructions (MWI) |
|---|---|---|---|
| Monovacancy formation energy and relaxation volume for fcc Ni | view | 910686 | |
| Monovacancy formation energy and relaxation volume for hcp Ti | view | 683125 |
Creators:
Contributor: efuem
Publication Year: 2023
DOI: https://doi.org/10.25950/c27ba3cd
Computes the monovacancy formation and migration energies for cubic and hcp monoatomic crystals.
| Test | Test Results | Link to Test Results page | Benchmark time
Usertime multiplied by the Whetstone Benchmark. This number can be used (approximately) to compare the performance of different models independently of the architecture on which the test was run.
Measured in Millions of Whetstone Instructions (MWI) |
|---|---|---|---|
| Vacancy formation and migration energy for fcc Ni | view | 1367206 | |
| Vacancy formation and migration energy for hcp Ti | view | 2265965 |
| Test | Error Categories | Link to Error page |
|---|---|---|
| Elastic constants for diamond Ti at zero temperature v001 | other | view |
ElasticConstantsHexagonal__TD_612503193866_004
| Test | Error Categories | Link to Error page |
|---|---|---|
| Elastic constants for hcp Ni at zero temperature v004 | other | view |
| Elastic constants for hcp Ti at zero temperature v004 | other | view |
EquilibriumCrystalStructure__TD_457028483760_002
| Test | Error Categories | Link to Error page |
|---|---|---|
| Equilibrium crystal structure and energy for NiTi in AFLOW crystal prototype AB_mP4_11_e_e v002 | other | view |
GrainBoundaryCubicCrystalSymmetricTiltRelaxedEnergyVsAngle__TD_410381120771_003
PhononDispersionCurve__TD_530195868545_004
| Test | Error Categories | Link to Error page |
|---|---|---|
| Phonon dispersion relations for fcc Ni v004 | other | view |
SurfaceEnergyCubicCrystalBrokenBondFit__TD_955413365818_004
| Test | Error Categories | Link to Error page |
|---|---|---|
| Broken-bond fit of high-symmetry surface energies in fcc Ni v004 | other | view |
| MEAM_LAMMPS_KavousiNovakBaskes_2019_NiTi__MO_050461957184_002.txz | Tar+XZ | Linux and OS X archive |
| MEAM_LAMMPS_KavousiNovakBaskes_2019_NiTi__MO_050461957184_002.zip | Zip | Windows archive |
This Model requires a Model Driver. Archives for the Model Driver MEAM_LAMMPS__MD_249792265679_002 appear below.
| MEAM_LAMMPS__MD_249792265679_002.txz | Tar+XZ | Linux and OS X archive |
| MEAM_LAMMPS__MD_249792265679_002.zip | Zip | Windows archive |