 MEAM_LAMMPS_KimJungLee_2010_FeNbC__MO_072689718616_002
| Title
A single sentence description.
|
MEAM Potential for the Fe-Nb-C system developed by Kim and Lee (2010) v002 |
|---|---|
| Description
A short description of the Model describing its key features including for example: type of model (pair potential, 3-body potential, EAM, etc.), modeled species (Ac, Ag, ..., Zr), intended purpose, origin, and so on.
|
Interatomic potentials for Fe-Nb-C systems has been developed based on the previously developed MEAM potentials for lower order systems. According to the paper (Kim et al, Journal of Materials Research, 25(7), 2010), the potentials reproduce various fundamental physical properties (structural properties, elastic properties, thermal properties, and surface properties) in generally good agreement with higher-level calculations or experimental information. |
| Species
The supported atomic species.
| C, Fe, Nb |
| Disclaimer
A statement of applicability provided by the contributor, informing users of the intended use of this KIM Item.
|
None |
| Content Origin | http://cmse.postech.ac.kr/home_2nnmeam |
| Contributor |
Donghyuk Seol |
| Maintainer |
Donghyuk Seol |
| Developer |
Hyun-Kyu Kim Woo-Sang Jung Byeong-Joo Lee |
| Published on KIM | 2023 |
| How to Cite |
This Model originally published in [1] is archived in OpenKIM [2-5]. [1] Kim H-K, Jung W-S, Lee B-J. Modified embedded-atom method interatomic potentials for the Nb-C, Nb-N, Fe-Nb-C, and Fe-Nb-N systems. Journal of Materials Research. 2010;25(7):1288–97. doi:10.1557/JMR.2010.0182 — (Primary Source) A primary source is a reference directly related to the item documenting its development, as opposed to other sources that are provided as background information. [2] Kim H-K, Jung W-S, Lee B-J. MEAM Potential for the Fe-Nb-C system developed by Kim and Lee (2010) v002. OpenKIM; 2023. doi:10.25950/36c8c978 [3] Afshar Y, Hütter S, Rudd RE, Stukowski A, Tipton WW, Trinkle DR, et al. The modified embedded atom method (MEAM) potential v002. OpenKIM; 2023. doi:10.25950/ee5eba52 [4] Tadmor EB, Elliott RS, Sethna JP, Miller RE, Becker CA. The potential of atomistic simulations and the Knowledgebase of Interatomic Models. JOM. 2011;63(7):17. doi:10.1007/s11837-011-0102-6 [5] Elliott RS, Tadmor EB. Knowledgebase of Interatomic Models (KIM) Application Programming Interface (API). OpenKIM; 2011. doi:10.25950/ff8f563a Click here to download the above citation in BibTeX format. |
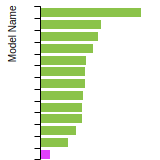
| Citations
This panel presents information regarding the papers that have cited the interatomic potential (IP) whose page you are on. The OpenKIM machine learning based Deep Citation framework is used to determine whether the citing article actually used the IP in computations (denoted by "USED") or only provides it as a background citation (denoted by "NOT USED"). For more details on Deep Citation and how to work with this panel, click the documentation link at the top of the panel. The word cloud to the right is generated from the abstracts of IP principle source(s) (given below in "How to Cite") and the citing articles that were determined to have used the IP in order to provide users with a quick sense of the types of physical phenomena to which this IP is applied. The bar chart shows the number of articles that cited the IP per year. Each bar is divided into green (articles that USED the IP) and blue (articles that did NOT USE the IP). Users are encouraged to correct Deep Citation errors in determination by clicking the speech icon next to a citing article and providing updated information. This will be integrated into the next Deep Citation learning cycle, which occurs on a regular basis. OpenKIM acknowledges the support of the Allen Institute for AI through the Semantic Scholar project for providing citation information and full text of articles when available, which are used to train the Deep Citation ML algorithm. |
This panel provides information on past usage of this interatomic potential (IP) powered by the OpenKIM Deep Citation framework. The word cloud indicates typical applications of the potential. The bar chart shows citations per year of this IP (bars are divided into articles that used the IP (green) and those that did not (blue)). The complete list of articles that cited this IP is provided below along with the Deep Citation determination on usage. See the Deep Citation documentation for more information. 
19 Citations (14 used)
Help us to determine which of the papers that cite this potential actually used it to perform calculations. If you know, click the .
USED (high confidence) M. Damadam, S. Shao, I. Salehinia, G. Ayoub, and H. Zbib, “Molecular dynamics simulations of mechanical behavior in nanoscale ceramic–metallic multilayer composites,” Materials Research Letters. 2017. link Times cited: 17 Abstract: ABSTRACT The mechanical behavior of nanoscale ceramic–metall… read more USED (high confidence) I. Salehinia, S. Shao, J. Wang, and H. Zbib, “Interface structure and the inception of plasticity in Nb/NbC nanolayered composites,” Acta Materialia. 2015. link Times cited: 89 USED (low confidence) Y. Lei et al., “An Embedded-Atom Method Potential for studying the properties of Fe-Pb solid-liquid interface,” Journal of Nuclear Materials. 2022. link Times cited: 1 USED (low confidence) V. Popov, M. E. Stupak, and M. G. Urazaliev, “Atomistic Simulation of Grain Boundaries in Niobium: Structure, Energy, Point Defects and Grain-Boundary Self-Diffusion,” Journal of Phase Equilibria and Diffusion. 2022. link Times cited: 4 USED (low confidence) H.-S. Jang, D. Seol, and B.-J. Lee, “Modified embedded-atom method interatomic potentials for Mg–Al–Ca and Mg–Al–Zn ternary systems,” Journal of Magnesium and Alloys. 2020. link Times cited: 28 USED (low confidence) H.-S. Jang, D. Seol, and B.-J. Lee, “Modified embedded-atom method interatomic potential for the Mg–Zn–Ca ternary system,” Calphad-computer Coupling of Phase Diagrams and Thermochemistry. 2019. link Times cited: 6 USED (low confidence) M. Damadam, S. Shao, I. Salehinia, I. Mastorakos, G. Ayoub, and H. Zbib, “Strength and plastic deformation behavior of nanolaminate composites with pre-existing dislocations,” Computational Materials Science. 2017. link Times cited: 13 USED (low confidence) I. Salehinia, I. Mastorakos, and H. Zbib, “Effects of Defects on Hydrogen Diffusion in NbC,” Applied Surface Science. 2017. link Times cited: 6 USED (low confidence) T. Fu et al., “Molecular dynamics simulation of TiN (001) thin films under indentation,” Ceramics International. 2015. link Times cited: 48 USED (low confidence) I. Salehinia, J. Wang, D. Bahr, and H. Zbib, “Molecular dynamics simulations of plastic deformation in Nb/NbC multilayers,” International Journal of Plasticity. 2014. link Times cited: 103 USED (low confidence) L. Wang, M. Li, and J. Almer, “In situ characterization of Grade 92 steel during tensile deformation using concurrent high energy X-ray diffraction and small angle X-ray scattering,” Journal of Nuclear Materials. 2013. link Times cited: 42 USED (low confidence) B. Jelinek et al., “Modified embedded atom method potential for Al, Si, Mg, Cu, and Fe alloys,” Physical Review B. 2011. link Times cited: 218 Abstract: A set of modified embedded-atom method (MEAM) potentials for… read more USED (low confidence) B.-J. Lee, W. Ko, H.-K. Kim, and E.-H. Kim, “The modified embedded-atom method interatomic potentials and recent progress in atomistic simulations,” Calphad-computer Coupling of Phase Diagrams and Thermochemistry. 2010. link Times cited: 137 USED (low confidence) V. Ogorodnikov, “Computer Modeling of Atomic Mechanisms of Refractory Carbides Deformation and Fracturing by Molecular Dynamics Method,” Izvestiya of Altai State University. 2014. link Times cited: 0 Abstract: Особо тугоплавкие материалы, к которым прежде всего относятс… read more NOT USED (high confidence) B. Waters, D. S. Karls, I. Nikiforov, R. Elliott, E. Tadmor, and B. Runnels, “Automated determination of grain boundary energy and potential-dependence using the OpenKIM framework,” Computational Materials Science. 2022. link Times cited: 5 NOT USED (high confidence) W. Ko and B.-J. Lee, “Modified embedded-atom method interatomic potentials for pure Y and the V–Pd–Y ternary system,” Modelling and Simulation in Materials Science and Engineering. 2013. link Times cited: 20 Abstract: Interatomic potentials for pure Y and the V–Pd–Y ternary sys… read more NOT USED (high confidence) H. Gao, A. Otero-de-la-Roza, S. Aouadi, E. Johnson, and A. Martini, “An empirical model for silver tantalate,” Modelling and Simulation in Materials Science and Engineering. 2013. link Times cited: 13 Abstract: A set of parameters for the modified embedded atom method (M… read more NOT USED (high confidence) W. Ko, N. Kim, and B.-J. Lee, “Atomistic modeling of an impurity element and a metal–impurity system: pure P and Fe–P system,” Journal of Physics: Condensed Matter. 2012. link Times cited: 23 Abstract: An interatomic potential for pure phosphorus, an element tha… read more NOT USED (high confidence) N. Razmara and R. Mohammadzadeh, “Molecular dynamics study of nitrogen diffusion in nanocrystalline iron,” Journal of Molecular Modeling. 2016. link Times cited: 6 |
| Funding | Not available |
| Short KIM ID
The unique KIM identifier code.
| MO_072689718616_002 |
| Extended KIM ID
The long form of the KIM ID including a human readable prefix (100 characters max), two underscores, and the Short KIM ID. Extended KIM IDs can only contain alpha-numeric characters (letters and digits) and underscores and must begin with a letter.
| MEAM_LAMMPS_KimJungLee_2010_FeNbC__MO_072689718616_002 |
| DOI |
10.25950/36c8c978 https://doi.org/10.25950/36c8c978 https://commons.datacite.org/doi.org/10.25950/36c8c978 |
| KIM Item Type
Specifies whether this is a Portable Model (software implementation of an interatomic model); Portable Model with parameter file (parameter file to be read in by a Model Driver); Model Driver (software implementation of an interatomic model that reads in parameters).
| Portable Model using Model Driver MEAM_LAMMPS__MD_249792265679_002 |
| Driver | MEAM_LAMMPS__MD_249792265679_002 |
| KIM API Version | 2.2 |
| Potential Type | meam |
| Previous Version | MEAM_LAMMPS_KimJungLee_2010_FeNbC__MO_072689718616_001 |
| Grade | Name | Category | Brief Description | Full Results | Aux File(s) |
|---|---|---|---|---|---|
| P | vc-species-supported-as-stated | mandatory | The model supports all species it claims to support; see full description. |
Results | Files |
| P | vc-periodicity-support | mandatory | Periodic boundary conditions are handled correctly; see full description. |
Results | Files |
| P | vc-permutation-symmetry | mandatory | Total energy and forces are unchanged when swapping atoms of the same species; see full description. |
Results | Files |
| A | vc-forces-numerical-derivative | consistency | Forces computed by the model agree with numerical derivatives of the energy; see full description. |
Results | Files |
| F | vc-dimer-continuity-c1 | informational | The energy versus separation relation of a pair of atoms is C1 continuous (i.e. the function and its first derivative are continuous); see full description. |
Results | Files |
| P | vc-objectivity | informational | Total energy is unchanged and forces transform correctly under rigid-body translation and rotation; see full description. |
Results | Files |
| P | vc-inversion-symmetry | informational | Total energy is unchanged and forces change sign when inverting a configuration through the origin; see full description. |
Results | Files |
| P | vc-memory-leak | informational | The model code does not have memory leaks (i.e. it releases all allocated memory at the end); see full description. |
Results | Files |
| P | vc-thread-safe | mandatory | The model returns the same energy and forces when computed in serial and when using parallel threads for a set of configurations. Note that this is not a guarantee of thread safety; see full description. |
Results | Files |
| P | vc-unit-conversion | mandatory | The model is able to correctly convert its energy and/or forces to different unit sets; see full description. |
Results | Files |
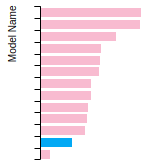
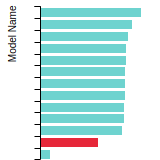
BCC Lattice Constant
This bar chart plot shows the mono-atomic body-centered cubic (bcc) lattice constant predicted by the current model (shown in the unique color) compared with the predictions for all other models in the OpenKIM Repository that support the species. The vertical bars show the average and standard deviation (one sigma) bounds for all model predictions. Graphs are generated for each species supported by the model.

Cohesive Energy Graph
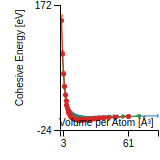
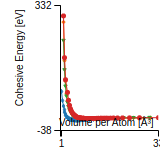
This graph shows the cohesive energy versus volume-per-atom for the current mode for four mono-atomic cubic phases (body-centered cubic (bcc), face-centered cubic (fcc), simple cubic (sc), and diamond). The curve with the lowest minimum is the ground state of the crystal if stable. (The crystal structure is enforced in these calculations, so the phase may not be stable.) Graphs are generated for each species supported by the model.
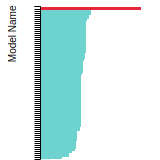
Diamond Lattice Constant
This bar chart plot shows the mono-atomic face-centered diamond lattice constant predicted by the current model (shown in the unique color) compared with the predictions for all other models in the OpenKIM Repository that support the species. The vertical bars show the average and standard deviation (one sigma) bounds for all model predictions. Graphs are generated for each species supported by the model.
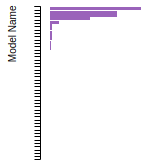
Dislocation Core Energies
This graph shows the dislocation core energy of a cubic crystal at zero temperature and pressure for a specific set of dislocation core cutoff radii. After obtaining the total energy of the system from conjugate gradient minimizations, non-singular, isotropic and anisotropic elasticity are applied to obtain the dislocation core energy for each of these supercells with different dipole distances. Graphs are generated for each species supported by the model.
(No matching species)FCC Elastic Constants
This bar chart plot shows the mono-atomic face-centered cubic (fcc) elastic constants predicted by the current model (shown in blue) compared with the predictions for all other models in the OpenKIM Repository that support the species. The vertical bars show the average and standard deviation (one sigma) bounds for all model predictions. Graphs are generated for each species supported by the model.
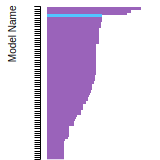
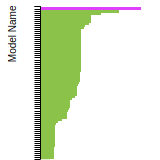
FCC Lattice Constant
This bar chart plot shows the mono-atomic face-centered cubic (fcc) lattice constant predicted by the current model (shown in red) compared with the predictions for all other models in the OpenKIM Repository that support the species. The vertical bars show the average and standard deviation (one sigma) bounds for all model predictions. Graphs are generated for each species supported by the model.
FCC Stacking Fault Energies
This bar chart plot shows the intrinsic and extrinsic stacking fault energies as well as the unstable stacking and unstable twinning energies for face-centered cubic (fcc) predicted by the current model (shown in blue) compared with the predictions for all other models in the OpenKIM Repository that support the species. The vertical bars show the average and standard deviation (one sigma) bounds for all model predictions. Graphs are generated for each species supported by the model.
(No matching species)FCC Surface Energies
This bar chart plot shows the mono-atomic face-centered cubic (fcc) relaxed surface energies predicted by the current model (shown in blue) compared with the predictions for all other models in the OpenKIM Repository that support the species. The vertical bars show the average and standard deviation (one sigma) bounds for all model predictions. Graphs are generated for each species supported by the model.
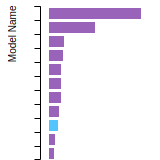
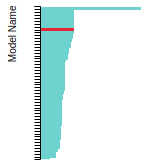
(No matching species)SC Lattice Constant
This bar chart plot shows the mono-atomic simple cubic (sc) lattice constant predicted by the current model (shown in the unique color) compared with the predictions for all other models in the OpenKIM Repository that support the species. The vertical bars show the average and standard deviation (one sigma) bounds for all model predictions. Graphs are generated for each species supported by the model.
Cubic Crystal Basic Properties Table
Species: CSpecies: Fe
Species: Nb
Creators:
Contributor: karls
Publication Year: 2019
DOI: https://doi.org/10.25950/64cb38c5
This Test Driver uses LAMMPS to compute the cohesive energy of a given monoatomic cubic lattice (fcc, bcc, sc, or diamond) at a variety of lattice spacings. The lattice spacings range from a_min (=a_min_frac*a_0) to a_max (=a_max_frac*a_0) where a_0, a_min_frac, and a_max_frac are read from stdin (a_0 is typically approximately equal to the equilibrium lattice constant). The precise scaling and number of lattice spacings sampled between a_min and a_0 (a_0 and a_max) is specified by two additional parameters passed from stdin: N_lower and samplespacing_lower (N_upper and samplespacing_upper). Please see README.txt for further details.
Creators:
Contributor: ilia
Publication Year: 2024
DOI: https://doi.org/10.25950/888f9943
Computes the elastic constants for an arbitrary crystal. A robust computational protocol is used, attempting multiple methods and step sizes to achieve an acceptably low error in numerical differentiation and deviation from material symmetry. The crystal structure is specified using the AFLOW prototype designation as part of the Crystal Genome testing framework. In addition, the distance from the obtained elasticity tensor to the nearest isotropic tensor is computed.
| Test | Test Results | Link to Test Results page | Benchmark time
Usertime multiplied by the Whetstone Benchmark. This number can be used (approximately) to compare the performance of different models independently of the architecture on which the test was run.
Measured in Millions of Whetstone Instructions (MWI) |
|---|---|---|---|
| Elastic constants for CFe in AFLOW crystal prototype A2B5_mC28_15_f_e2f at zero temperature and pressure v000 | view | 2299536 | |
| Elastic constants for FeNb in AFLOW crystal prototype A2B_cF24_227_c_b at zero temperature and pressure v000 | view | 357087 | |
| Elastic constants for FeNb in AFLOW crystal prototype A2B_hP12_194_ah_f at zero temperature and pressure v000 | view | 11645732 | |
| Elastic constants for FeNb in AFLOW crystal prototype A2B_hP24_194_fgh_ef at zero temperature and pressure v000 | view | 19230175 |
Creators: Junhao Li and Ellad Tadmor
Contributor: tadmor
Publication Year: 2019
DOI: https://doi.org/10.25950/5853fb8f
Computes the cubic elastic constants for some common crystal types (fcc, bcc, sc, diamond) by calculating the hessian of the energy density with respect to strain. An estimate of the error associated with the numerical differentiation performed is reported.
Creators:
Contributor: ilia
Publication Year: 2024
DOI: https://doi.org/10.25950/2f2c4ad3
Computes the equilibrium crystal structure and energy for an arbitrary crystal at zero temperature and applied stress by performing symmetry-constrained relaxation. The crystal structure is specified using the AFLOW prototype designation. Multiple sets of free parameters corresponding to the crystal prototype may be specified as initial guesses for structure optimization. No guarantee is made regarding the stability of computed equilibria, nor that any are the ground state.
Creators:
Contributor: ilia
Publication Year: 2025
DOI: https://doi.org/10.25950/866c7cfa
Computes the equilibrium crystal structure and energy for an arbitrary crystal at zero temperature and applied stress by performing symmetry-constrained relaxation. The crystal structure is specified using the AFLOW prototype designation. Multiple sets of free parameters corresponding to the crystal prototype may be specified as initial guesses for structure optimization. No guarantee is made regarding the stability of computed equilibria, nor that any are the ground state.
Creators:
Contributor: brunnels
Publication Year: 2022
DOI: https://doi.org/10.25950/2c59c9d6
Computes grain boundary energy for a range of tilt angles given a crystal structure, tilt axis, and material.
| Test | Test Results | Link to Test Results page | Benchmark time
Usertime multiplied by the Whetstone Benchmark. This number can be used (approximately) to compare the performance of different models independently of the architecture on which the test was run.
Measured in Millions of Whetstone Instructions (MWI) |
|---|---|---|---|
| Relaxed energy as a function of tilt angle for a 100 symmetric tilt grain boundary in bcc Fe v001 | view | 9152051 | |
| Relaxed energy as a function of tilt angle for a 110 symmetric tilt grain boundary in bcc Fe v001 | view | 27988820 | |
| Relaxed energy as a function of tilt angle for a 111 symmetric tilt grain boundary in bcc Fe v001 | view | 15658565 | |
| Relaxed energy as a function of tilt angle for a 112 symmetric tilt grain boundary in bcc Fe v001 | view | 58125070 | |
| Relaxed energy as a function of tilt angle for a 100 symmetric tilt grain boundary in fcc Fe v001 | view | 19068501 | |
| Relaxed energy as a function of tilt angle for a 111 symmetric tilt grain boundary in fcc Fe v001 | view | 62476804 |
Creators: Ilia Nikiforov
Contributor: ilia
Publication Year: 2019
DOI: https://doi.org/10.25950/dd36239b
Given atomic species and structure type (graphene-like, 2H, or 1T) of a 2D hexagonal monolayer crystal, as well as an initial guess at the lattice spacing, this Test Driver calculates the equilibrium lattice spacing and cohesive energy using Polak-Ribiere conjugate gradient minimization in LAMMPS
| Test | Test Results | Link to Test Results page | Benchmark time
Usertime multiplied by the Whetstone Benchmark. This number can be used (approximately) to compare the performance of different models independently of the architecture on which the test was run.
Measured in Millions of Whetstone Instructions (MWI) |
|---|---|---|---|
| Cohesive energy and equilibrium lattice constant of graphene v002 | view | 1402 |
Creators: Daniel S. Karls and Junhao Li
Contributor: karls
Publication Year: 2019
DOI: https://doi.org/10.25950/2765e3bf
Equilibrium lattice constant and cohesive energy of a cubic lattice at zero temperature and pressure.
Creators: Daniel S. Karls and Junhao Li
Contributor: karls
Publication Year: 2019
DOI: https://doi.org/10.25950/c339ca32
Calculates lattice constant of hexagonal bulk structures at zero temperature and pressure by using simplex minimization to minimize the potential energy.
| Test | Test Results | Link to Test Results page | Benchmark time
Usertime multiplied by the Whetstone Benchmark. This number can be used (approximately) to compare the performance of different models independently of the architecture on which the test was run.
Measured in Millions of Whetstone Instructions (MWI) |
|---|---|---|---|
| Equilibrium lattice constants for hcp Fe v005 | view | 444895 | |
| Equilibrium lattice constants for hcp Nb v005 | view | 515564 |
Creators:
Contributor: mjwen
Publication Year: 2024
DOI: https://doi.org/10.25950/9d9822ec
This Test Driver uses LAMMPS to compute the linear thermal expansion coefficient at a finite temperature under a given pressure for a cubic lattice (fcc, bcc, sc, diamond) of a single given species.
| Test | Test Results | Link to Test Results page | Benchmark time
Usertime multiplied by the Whetstone Benchmark. This number can be used (approximately) to compare the performance of different models independently of the architecture on which the test was run.
Measured in Millions of Whetstone Instructions (MWI) |
|---|---|---|---|
| Linear thermal expansion coefficient of bcc Fe at 293.15 K under a pressure of 0 MPa v002 | view | 2214578 | |
| Linear thermal expansion coefficient of diamond C at 293.15 K under a pressure of 0 MPa v002 | view | 12622161 |
Creators: Matt Bierbaum
Contributor: mattbierbaum
Publication Year: 2019
DOI: https://doi.org/10.25950/6c43a4e6
Calculates the surface energy of several high symmetry surfaces and produces a broken-bond model fit. In latex form, the fit equations are given by:
E_{FCC} (\vec{n}) = p_1 (4 \left( |x+y| + |x-y| + |x+z| + |x-z| + |z+y| +|z-y|\right)) + p_2 (8 \left( |x| + |y| + |z|\right)) + p_3 (2 ( |x+ 2y + z| + |x+2y-z| + |x-2y + z| + |x-2y-z| + |2x+y+z| + |2x+y-z| +|2x-y+z| +|2x-y-z| +|x+y+2z| +|x+y-2z| +|x-y+2z| +|x-y-2z| ) + c
E_{BCC} (\vec{n}) = p_1 (6 \left( | x+y+z| + |x+y-z| + |-x+y-z| + |x-y+z| \right)) + p_2 (8 \left( |x| + |y| + |z|\right)) + p_3 (4 \left( |x+y| + |x-y| + |x+z| + |x-z| + |z+y| +|z-y|\right)) +c.
In Python, these two fits take the following form:
def BrokenBondFCC(params, index):
import numpy
x, y, z = index
x = x / numpy.sqrt(x**2.+y**2.+z**2.)
y = y / numpy.sqrt(x**2.+y**2.+z**2.)
z = z / numpy.sqrt(x**2.+y**2.+z**2.)
return params[0]*4* (abs(x+y) + abs(x-y) + abs(x+z) + abs(x-z) + abs(z+y) + abs(z-y)) + params[1]*8*(abs(x) + abs(y) + abs(z)) + params[2]*(abs(x+2*y+z) + abs(x+2*y-z) +abs(x-2*y+z) +abs(x-2*y-z) + abs(2*x+y+z) +abs(2*x+y-z) +abs(2*x-y+z) +abs(2*x-y-z) + abs(x+y+2*z) +abs(x+y-2*z) +abs(x-y+2*z) +abs(x-y-2*z))+params[3]
def BrokenBondBCC(params, x, y, z):
import numpy
x, y, z = index
x = x / numpy.sqrt(x**2.+y**2.+z**2.)
y = y / numpy.sqrt(x**2.+y**2.+z**2.)
z = z / numpy.sqrt(x**2.+y**2.+z**2.)
return params[0]*6*(abs(x+y+z) + abs(x-y-z) + abs(x-y+z) + abs(x+y-z)) + params[1]*8*(abs(x) + abs(y) + abs(z)) + params[2]*4* (abs(x+y) + abs(x-y) + abs(x+z) + abs(x-z) + abs(z+y) + abs(z-y)) + params[3]
| Test | Test Results | Link to Test Results page | Benchmark time
Usertime multiplied by the Whetstone Benchmark. This number can be used (approximately) to compare the performance of different models independently of the architecture on which the test was run.
Measured in Millions of Whetstone Instructions (MWI) |
|---|---|---|---|
| Broken-bond fit of high-symmetry surface energies in bcc Fe v004 | view | 75291 | |
| Broken-bond fit of high-symmetry surface energies in bcc Nb v004 | view | 91573 |
Creators:
Contributor: efuem
Publication Year: 2023
DOI: https://doi.org/10.25950/fca89cea
Computes the monovacancy formation energy and relaxation volume for cubic and hcp monoatomic crystals.
| Test | Test Results | Link to Test Results page | Benchmark time
Usertime multiplied by the Whetstone Benchmark. This number can be used (approximately) to compare the performance of different models independently of the architecture on which the test was run.
Measured in Millions of Whetstone Instructions (MWI) |
|---|---|---|---|
| Monovacancy formation energy and relaxation volume for bcc Fe | view | 404177 | |
| Monovacancy formation energy and relaxation volume for bcc Nb | view | 865777 |
Creators:
Contributor: efuem
Publication Year: 2023
DOI: https://doi.org/10.25950/c27ba3cd
Computes the monovacancy formation and migration energies for cubic and hcp monoatomic crystals.
| Test | Test Results | Link to Test Results page | Benchmark time
Usertime multiplied by the Whetstone Benchmark. This number can be used (approximately) to compare the performance of different models independently of the architecture on which the test was run.
Measured in Millions of Whetstone Instructions (MWI) |
|---|---|---|---|
| Vacancy formation and migration energy for bcc Fe | view | 711469 | |
| Vacancy formation and migration energy for bcc Nb | view | 5018930 |
| Test | Error Categories | Link to Error page |
|---|---|---|
| Elastic constants for diamond Fe at zero temperature v001 | other | view |
ElasticConstantsHexagonal__TD_612503193866_004
| Test | Error Categories | Link to Error page |
|---|---|---|
| Elastic constants for hcp Fe at zero temperature v004 | other | view |
| Elastic constants for hcp Nb at zero temperature v004 | other | view |
EquilibriumCrystalStructure__TD_457028483760_000
EquilibriumCrystalStructure__TD_457028483760_002
EquilibriumCrystalStructure__TD_457028483760_003
GrainBoundaryCubicCrystalSymmetricTiltRelaxedEnergyVsAngle__TD_410381120771_003
LatticeConstantHexagonalEnergy__TD_942334626465_005
| Test | Error Categories | Link to Error page |
|---|---|---|
| Equilibrium lattice constants for hcp C v005 | other | view |
SurfaceEnergyCubicCrystalBrokenBondFit__TD_955413365818_004
| Test | Error Categories | Link to Error page |
|---|---|---|
| Broken-bond fit of high-symmetry surface energies in bcc Fe v004 | other | view |
| Broken-bond fit of high-symmetry surface energies in bcc Nb v004 | other | view |
| MEAM_LAMMPS_KimJungLee_2010_FeNbC__MO_072689718616_002.txz | Tar+XZ | Linux and OS X archive |
| MEAM_LAMMPS_KimJungLee_2010_FeNbC__MO_072689718616_002.zip | Zip | Windows archive |
This Model requires a Model Driver. Archives for the Model Driver MEAM_LAMMPS__MD_249792265679_002 appear below.
| MEAM_LAMMPS__MD_249792265679_002.txz | Tar+XZ | Linux and OS X archive |
| MEAM_LAMMPS__MD_249792265679_002.zip | Zip | Windows archive |