 EAM_Dynamo_ZhouFosterSills_2018_FeNiCr__MO_036303866285_000
| Title
A single sentence description.
|
EAM potential (LAMMPS cubic hermite tabulation) for Fe-Ni-Cr developed by Zhou, Foster and Sills (2018) v000 |
|---|---|
| Description
A short description of the Model describing its key features including for example: type of model (pair potential, 3-body potential, EAM, etc.), modeled species (Ac, Ag, ..., Zr), intended purpose, origin, and so on.
|
Developed using density functional theory as a guide, this potential has been demonstrated to enable stable molecular dynamics simulations of stainless‐steel alloys at high temperatures, accurately reproduce the stacking fault energy-known to strongly influence the mode of plastic deformation (e.g., twinning vs. dislocation glide vs. cross‐slip)-of these alloys over a range of compositions, and give reasonable elastic constants, energies, and volumes for various compositions. The latter are pertinent for determining short‐range order and solute strengthening effects. These results suggest that this potential is suitable for studying mechanical properties of austenitic and ferritic stainless‐steels which have vast implementation in the scientific and industrial communities. |
| Species
The supported atomic species.
| Cr, Fe, Ni |
| Disclaimer
A statement of applicability provided by the contributor, informing users of the intended use of this KIM Item.
|
None |
| Content Origin | https://www.ctcms.nist.gov/potentials/entry/2018--Zhou-X-W-Foster-M-E-Sills-R-B--Fe-Ni-Cr/ |
| Contributor |
I Nikiforov |
| Maintainer |
I Nikiforov |
| Developer |
Xiaowang Zhou Michael E. Foster Ryan B Sills |
| Published on KIM | 2022 |
| How to Cite |
This Model originally published in [1] is archived in OpenKIM [2-5]. [1] Zhou XW, Foster ME, Sills RB. An Fe-Ni-Cr embedded atom method potential for austenitic and ferritic systems. Journal of Computational Chemistry [Internet]. 2018;39(29):2420–31. Available from: https://onlinelibrary.wiley.com/doi/abs/10.1002/jcc.25573 doi:10.1002/jcc.25573 — (Primary Source) A primary source is a reference directly related to the item documenting its development, as opposed to other sources that are provided as background information. [2] Zhou X, Foster ME, Sills RB. EAM potential (LAMMPS cubic hermite tabulation) for Fe-Ni-Cr developed by Zhou, Foster and Sills (2018) v000. OpenKIM; 2022. doi:10.25950/e28aaa47 [3] Foiles SM, Baskes MI, Daw MS, Plimpton SJ. EAM Model Driver for tabulated potentials with cubic Hermite spline interpolation as used in LAMMPS v005. OpenKIM; 2018. doi:10.25950/68defa36 [4] Tadmor EB, Elliott RS, Sethna JP, Miller RE, Becker CA. The potential of atomistic simulations and the Knowledgebase of Interatomic Models. JOM. 2011;63(7):17. doi:10.1007/s11837-011-0102-6 [5] Elliott RS, Tadmor EB. Knowledgebase of Interatomic Models (KIM) Application Programming Interface (API). OpenKIM; 2011. doi:10.25950/ff8f563a Click here to download the above citation in BibTeX format. |
| Citations
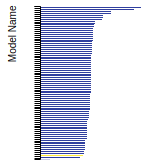
This panel presents information regarding the papers that have cited the interatomic potential (IP) whose page you are on. The OpenKIM machine learning based Deep Citation framework is used to determine whether the citing article actually used the IP in computations (denoted by "USED") or only provides it as a background citation (denoted by "NOT USED"). For more details on Deep Citation and how to work with this panel, click the documentation link at the top of the panel. The word cloud to the right is generated from the abstracts of IP principle source(s) (given below in "How to Cite") and the citing articles that were determined to have used the IP in order to provide users with a quick sense of the types of physical phenomena to which this IP is applied. The bar chart shows the number of articles that cited the IP per year. Each bar is divided into green (articles that USED the IP) and blue (articles that did NOT USE the IP). Users are encouraged to correct Deep Citation errors in determination by clicking the speech icon next to a citing article and providing updated information. This will be integrated into the next Deep Citation learning cycle, which occurs on a regular basis. OpenKIM acknowledges the support of the Allen Institute for AI through the Semantic Scholar project for providing citation information and full text of articles when available, which are used to train the Deep Citation ML algorithm. |
This panel provides information on past usage of this interatomic potential (IP) powered by the OpenKIM Deep Citation framework. The word cloud indicates typical applications of the potential. The bar chart shows citations per year of this IP (bars are divided into articles that used the IP (green) and those that did not (blue)). The complete list of articles that cited this IP is provided below along with the Deep Citation determination on usage. See the Deep Citation documentation for more information. 
64 Citations (58 used)
Help us to determine which of the papers that cite this potential actually used it to perform calculations. If you know, click the .
USED (high confidence) M. Wagih, P. M. Larsen, and C. Schuh, “Learning grain boundary segregation energy spectra in polycrystals,” Nature Communications. 2020. link Times cited: 62 USED (high confidence) G. P’eterffy, P. D. Isp’anovity, M. E. Foster, X. W. Zhou, and R. Sills, “Length scales and scale-free dynamics of dislocations in dense solid solutions,” Materials Theory. 2020. link Times cited: 12 USED (low confidence) S. Hayakawa and H. Xu, “Development of an interatomic potential for L12 precipitates in Fe–Ni–Al alloys,” Computational Materials Science. 2024. link Times cited: 0 USED (low confidence) S. Assouli et al., “Exploring the impact of cooling rates and pressure on fragility and structural transformations in iron monatomic metallic glasses: Insights from molecular dynamics simulations,” Journal of Non-Crystalline Solids. 2023. link Times cited: 3 USED (low confidence) C. Dong and W. Jiang, “Molecular dynamics study on the effect of grain size on the plastic deformation of Fe-Cr-Ni alloy nanopolycrystals,” Materials Today Communications. 2023. link Times cited: 0 USED (low confidence) S. Biswal, R. Barik, S. Neogy, R. Tewari, A. Dutta, and D. Chakrabarti, “Unravelling the mechanisms of copper precipitation-induced strengthening in austenitic stainless steels: An atomistic approach,” Materialia. 2023. link Times cited: 0 USED (low confidence) Z. Hao, J. Hu, Y. Fan, L. Li, and L. Kong, “Research on the dynamic plasticity mechanism of additive manufactured nickel–chromium–molybdenum corrosion-resistant alloy steel under impact load,” Engineering Failure Analysis. 2023. link Times cited: 0 USED (low confidence) S. Kumar et al., “Atomistic characterization of multi nano-crystal formation process in Fe–Cr–Ni alloy during directional solidification: Perspective to the additive manufacturing,” Materials Chemistry and Physics. 2023. link Times cited: 2 USED (low confidence) T. Kaloni, A. Prudil, D. Spearot, and E. Torres, “Modeling of dislocation properties in Fe40Cr25Ni35 and Fe50Cr20Ni30 systems,” Nuclear Engineering and Design. 2023. link Times cited: 0 USED (low confidence) A. Kumar, R. Kumar, S. Kumar, and A. K. V, “Atomistic structural transformation of Fe-Cr-Ni single crystal alloy under uniaxial deformation using molecular dynamics simulation,” Materials Today: Proceedings. 2023. link Times cited: 0 USED (low confidence) W. Guo, Q.-X. Bai, Y. Dou, T. Wang, and H. Wang, “Effect of stainless-steel substrate grain boundaries on surface graphene morphology and nano-friction behavior,” Applied Surface Science. 2023. link Times cited: 0 USED (low confidence) G. Cheng et al., “Probing the effects of hydrogen on the materials used for large-scale transport of hydrogen through multi-scale simulations,” Renewable and Sustainable Energy Reviews. 2023. link Times cited: 0 USED (low confidence) J. Li, S. Yang, L. Dong, J. Zhang, Z. Zheng, and J. Liu, “Effect of crystal orientation on the nanoindentation deformation behavior of TiN coating based on molecular dynamics,” Surface and Coatings Technology. 2023. link Times cited: 0 USED (low confidence) X.-T. Li, X. Tang, Y.-F. Guo, H.-yu Li, and Y. Fan, “Modulating grain boundary-mediated plasticity of high-entropy alloys via chemo-mechanical coupling,” Acta Materialia. 2023. link Times cited: 1 USED (low confidence) C. H. Pham, H. Lorenzana, J. Belof, and N. Goldman, “Hugoniot properties of porous stainless steel: Insights from molecular dynamics simulations,” Journal of Applied Physics. 2023. link Times cited: 0 Abstract: We present a systematic study of Hugoniot properties of poro… read more USED (low confidence) A. Korchuganov, D. Kryzhevich, and K. Zolnikov, “Fracture of Fe95Ni5 Alloys with Gradient-Grained Structure under Uniaxial Tension,” Metals. 2023. link Times cited: 0 Abstract: The fracture behavior of single- (fcc) and two-phase (fcc + … read more USED (low confidence) W. Guo, Q.-X. Bai, Y. Dou, H. Wang, and S. Chen, “Investigation of the effect of stainless-steel grain size on the continuity of graphene frictional behavior using molecular dynamics (MD) simulation,” Computational Materials Science. 2023. link Times cited: 0 USED (low confidence) W. Guo, Q.-X. Bai, Y. Dou, H. Wang, and S. Chen, “Molecular Dynamics Study on the Effects of Substrate Grain Boundaries on the Adsorption State of Graphene: Implications for Nanoscale Lubrication,” ACS Applied Nano Materials. 2023. link Times cited: 2 USED (low confidence) “Influence of reciprocating friction on friction and wear characteristics of MoS2 films,” Results in Engineering. 2023. link Times cited: 3 USED (low confidence) X. W. Zhou, M. E. Foster, and R. Sills, “Enabling molecular dynamics simulations of helium bubble formation in tritium-containing austenitic stainless steels: An Fe-Ni-Cr-H-He potential,” Journal of Nuclear Materials. 2023. link Times cited: 1 USED (low confidence) Z.-tao Li et al., “Achieving superb strength in single-phase FCC alloys via maximizing volume misfit,” Materials Today. 2023. link Times cited: 8 USED (low confidence) P. Simonnin, D. Schreiber, B. Uberuaga, and K. Rosso, “Atomic Diffusion, Segregation, and Grain Boundary Migration in Nickel-Based Alloys from Molecular Dynamics Simulations,” SSRN Electronic Journal. 2023. link Times cited: 4 USED (low confidence) B. Wang, Q. Wang, R. Luo, Q. Kan, and B. Gu, “Atomistic study on high temperature creep of nanocrystalline 316L austenitic stainless steels,” Acta Mechanica Sinica. 2023. link Times cited: 1 USED (low confidence) S. Zhang, H. Zhang, H. Zhang, X. Zhao, and Y. Li, “Study on Diffusion Kinetics and Law of Chromium on the Surface of Low-Carbon Steel,” Coatings. 2023. link Times cited: 2 Abstract: Cr/low-carbon steel surface composites were prepared by aque… read more USED (low confidence) L. Yang, H. Wang, M. Chi, X.-guo Zeng, Y. Wang, and P. Zhao, “Molecular Dynamics Study on Hugoniot State and Mie–Grüneisen Equation of State of 316 Stainless Steel for Hydrogen Storage Tank,” Materials. 2023. link Times cited: 0 Abstract: To promote the popularization and development of hydrogen en… read more USED (low confidence) K. Peng, H. Huang, H.-F. Xu, Y. Kong, L. Zhu, and Z. Liu, “A molecular dynamics study of laser melting of densely packed stainless steel powders,” International Journal of Mechanical Sciences. 2022. link Times cited: 1 USED (low confidence) X. W. Zhou, R. Skelton, R. Sills, and C. S. Marchi, “Slip transmission and voiding during slip band Intersections in Fe70Ni10Cr20 stainless steel,” Scripta Materialia. 2022. link Times cited: 0 USED (low confidence) A.-L. Zhou, Z. J. Bai, H. Hou, Y.-L. Han, and J. Mei, “Atomic simulations of nanoscale friction behavior in polycrystalline alloy 690,” Materials Research Express. 2022. link Times cited: 1 Abstract: Fretting wear is one of the most important failure forms of … read more USED (low confidence) T.-X. Bui, T. Fang, and C.-I. Lee, “Investigation of the deformation behavior and mechanical characteristics of polycrystalline chromium–nickel alloys using molecular dynamics,” Journal of Molecular Modeling. 2022. link Times cited: 2 USED (low confidence) A. Korchuganov, D. Kryzhevich, and K. Zolnikov, “Deformation Behavior of Two-Phase Gradient Nanograined Fe95Ni5 Alloys under Different Types of Loading,” Metals. 2022. link Times cited: 1 Abstract: In this paper, we used molecular dynamics simulations to stu… read more USED (low confidence) C.-G. Li, Z. Luo, Z.-an Tian, and K. Dong, “The concealed solid-solid structural phase transition of Fe70Ni10Cr20 under high pressure,” Materials Today Communications. 2022. link Times cited: 0 USED (low confidence) M. E. Fernandez, R. Dingreville, and D. Spearot, “Statistical perspective on embrittling potency for intergranular fracture,” Physical Review Materials. 2022. link Times cited: 3 USED (low confidence) W. Guo, Q.-X. Bai, Y. Dou, S. Chen, and H. Wang, “Molecular dynamics simulation of frictional strengthening behavior of graphene on stainless steel substrate,” Carbon. 2022. link Times cited: 6 USED (low confidence) E. Zarkadoula, Y. Yang, A. Borisevich, and E. George, “Effects of precipitate size and spacing on deformation-induced fcc to bcc phase transformation,” Materials Research Letters. 2022. link Times cited: 3 Abstract: Molecular dynamics simulations were used to study deformatio… read more USED (low confidence) S. Paul, D. Schwen, M. Short, A. Erickson, and K. Momeni, “Effect of Differently Oriented Interlayer Phases on the Radiation Damage of Inconel-Ni Multimetallic Layered Composite,” Journal of Alloys and Compounds. 2022. link Times cited: 2 USED (low confidence) A. Korchuganov, K. Zolnikov, and D. Kryzhevich, “The Contribution of Various Plasticity Mechanisms to the Deformation Behavior of Gradient Nanograined FeNi Alloy,” Metals. 2022. link Times cited: 3 Abstract: This paper investigates the deformation behavior of a gradie… read more USED (low confidence) A. Mahata and M. Kivy, “Computational study of nanoscale mechanical properties of Fe–Cr–Ni alloy,” Molecular Simulation. 2022. link Times cited: 1 Abstract: ABSTRACT Mechanical properties of Fe–Cr–Ni alloy nanowires h… read more USED (low confidence) K. Chu, A. Diaz, Y. Chen, T. Zhu, and D. McDowell, “Multiscale Concurrent Atomistic-Continuum (CAC) modeling of multicomponent alloys,” Computational Materials Science. 2022. link Times cited: 5 USED (low confidence) S. Paul, M. Muralles, D. Schwen, M. Short, and K. Momeni, “A Modified Embedded-Atom Potential for Fe-Cr-Si Alloys,” The Journal of Physical Chemistry C. 2021. link Times cited: 5 USED (low confidence) Y. Liu et al., “Tuning strength-ductility combination on selective laser melted 316L stainless steel through gradient heterogeneous structure,” Additive Manufacturing. 2021. link Times cited: 29 USED (low confidence) X. W. Zhou et al., “An Fe–Ni–Cr–H interatomic potential and predictions of hydrogen-affected stacking fault energies in austenitic stainless steels,” International Journal of Hydrogen Energy. 2021. link Times cited: 18 USED (low confidence) Y.-C. Yang, C. Liu, C.-Y. Lin, and Z. Xia, “The effect of local atomic configuration in high-entropy alloys on the dislocation behaviors and mechanical properties,” Materials Science and Engineering A-structural Materials Properties Microstructure and Processing. 2021. link Times cited: 18 USED (low confidence) Z. Luo, Z.-an Tian, Y.-chao Liang, and Q. Xie, “Crystallization behavior of Fe70Ni10Cr20 during rapid solidification under different cooling rates,” Materials today communications. 2021. link Times cited: 6 USED (low confidence) M. Bahramyan, R. T. Mousavian, J. Carton, and D. Brabazon, “Nano-scale simulation of directional solidification in TWIP stainless steels: A focus on plastic deformation mechanisms,” Materials Science and Engineering: A. 2021. link Times cited: 4 USED (low confidence) S. Gowthaman and T. Jagadeesha, “Influence of temperature and strain rate on the characteristics of FeNi precipitate through molecular dynamics simulation,” Materials Today: Proceedings. 2021. link Times cited: 2 USED (low confidence) P. Simonnin, D. Schreiber, and K. Rosso, “Predicting the temperature dependence of self-diffusion behavior in Ni-Cr alloys via molecular dynamics,” Materials today communications. 2021. link Times cited: 6 USED (low confidence) S. Gowthaman and T. Jagadeesha, “Analysis on the effect of temperature o the Ni2Al3 precipitate tensile characteristics through molecular dynamics simulation,” Materials Today: Proceedings. 2021. link Times cited: 1 USED (low confidence) A. Korchuganov, D. Kryzhevich, Y. Chumakov, and A. S. Grigoriev, “Influence of grain size on the nucleation and development of plasticity in nanocrystalline FeNi films,” IOP Conference Series: Materials Science and Engineering. 2021. link Times cited: 0 Abstract: A molecular dynamics study of the features of the nucleation… read more USED (low confidence) A. Korchuganov, D. Kryzhevich, Y. Chumakov, and A. S. Grigoriev, “Peculiarities of the development of plastic deformation in a textured FeNi alloy with a gradient grain structure,” IOP Conference Series: Materials Science and Engineering. 2021. link Times cited: 0 Abstract: The mechanisms of nucleation and development of plastic defo… read more USED (low confidence) S. Paul, D. Schwen, M. Short, and K. Momeni, “Effect of Irradiation on Ni-Inconel/Incoloy Heterostructures in Multimetallic Layered Composites,” Journal of Nuclear Materials. 2021. link Times cited: 12 USED (low confidence) R. Sills, M. E. Foster, and X. W. Zhou, “Line-length-dependent dislocation mobilities in an FCC stainless steel alloy,” International Journal of Plasticity. 2020. link Times cited: 21 USED (low confidence) A. Husain, P. La, Y. Hongzheng, and S. Jie, “Molecular Dynamics as a Means to Investigate Grain Size and Strain Rate Effect on Plastic Deformation of 316 L Nanocrystalline Stainless-Steel,” Materials. 2020. link Times cited: 8 Abstract: In the present study, molecular dynamics simulations were em… read more USED (low confidence) A. Husain, P. La, Y. Hongzheng, and S. Jie, “Influence of Temperature on Mechanical Properties of Nanocrystalline 316L Stainless Steel Investigated via Molecular Dynamics Simulations,” Materials. 2020. link Times cited: 8 Abstract: Molecular dynamics simulations were conducted to study the m… read more USED (low confidence) I. C. Njifon and E. Torres, “Cumulative effects of primary radiation damage in alloy 800H: An atomistic simulation study,” Journal of Nuclear Materials. 2023. link Times cited: 0 USED (low confidence) R. Sills, M. E. Foster, and X. W. Zhou, “Line tension induced character angle dependence of dislocation mobility in FCC alloys,” Scripta Materialia. 2022. link Times cited: 3 USED (low confidence) A. Korchuganov, D. Kryzhevich, Y. Chumakov, and A. Grigoriev, “Deformation behavior of FeNi nanofilms with a gradient grain structure during uniaxial compression,” PROCEEDINGS OF THE INTERNATIONAL CONFERENCE “PHYSICAL MESOMECHANICS. MATERIALS WITH MULTILEVEL HIERARCHICAL STRUCTURE AND INTELLIGENT MANUFACTURING TECHNOLOGY.” 2022. link Times cited: 0 USED (low confidence) A. Korchuganov, D. Kryzhevich, Y. Chumakov, and A. Grigoriev, “Effect of grain shape on mechanical and structural response of FeNi alloy with grain size gradient under tension,” PROCEEDINGS OF THE INTERNATIONAL CONFERENCE “PHYSICAL MESOMECHANICS. MATERIALS WITH MULTILEVEL HIERARCHICAL STRUCTURE AND INTELLIGENT MANUFACTURING TECHNOLOGY.” 2022. link Times cited: 0 USED (low confidence) G. Ackland and G. Bonny, “Interatomic Potential Development,” Comprehensive Nuclear Materials. 2020. link Times cited: 4 NOT USED (low confidence) K. Chu et al., “Investigation of chemical short range order strengthening in a model Fe–12Ni–18Cr (at. %) stainless steel alloy: A modeling and experimental study,” Acta Materialia. 2023. link Times cited: 0 NOT USED (low confidence) Y. Lei et al., “An Embedded-Atom Method Potential for studying the properties of Fe-Pb solid-liquid interface,” Journal of Nuclear Materials. 2022. link Times cited: 1 NOT USED (low confidence) M. Kim, J. Ha, Y. T. Kim, and J. Choi, “Stainless steel: A high potential material for green electrochemical energy storage and conversion,” Chemical Engineering Journal. 2022. link Times cited: 14 NOT USED (high confidence) B. Waters, D. S. Karls, I. Nikiforov, R. Elliott, E. Tadmor, and B. Runnels, “Automated determination of grain boundary energy and potential-dependence using the OpenKIM framework,” Computational Materials Science. 2022. link Times cited: 5 NOT USED (high confidence) L. Xu, L. Casillas-Trujillo, Y. Gao, and H. Xu, “Compositional effects on stacking fault energies in Ni-based alloys using first-principles and atomistic simulations,” Computational Materials Science. 2021. link Times cited: 5 NOT USED (high confidence) K. Chu, M. E. Foster, R. Sills, X. W. Zhou, T. Zhu, and D. McDowell, “Temperature and composition dependent screw dislocation mobility in austenitic stainless steels from large-scale molecular dynamics,” npj Computational Materials. 2020. link Times cited: 18 |
| Funding |
Funder: Sandia National Laboratories |
| Short KIM ID
The unique KIM identifier code.
| MO_036303866285_000 |
| Extended KIM ID
The long form of the KIM ID including a human readable prefix (100 characters max), two underscores, and the Short KIM ID. Extended KIM IDs can only contain alpha-numeric characters (letters and digits) and underscores and must begin with a letter.
| EAM_Dynamo_ZhouFosterSills_2018_FeNiCr__MO_036303866285_000 |
| DOI |
10.25950/e28aaa47 https://doi.org/10.25950/e28aaa47 https://commons.datacite.org/doi.org/10.25950/e28aaa47 |
| KIM Item Type
Specifies whether this is a Portable Model (software implementation of an interatomic model); Portable Model with parameter file (parameter file to be read in by a Model Driver); Model Driver (software implementation of an interatomic model that reads in parameters).
| Portable Model using Model Driver EAM_Dynamo__MD_120291908751_005 |
| Driver | EAM_Dynamo__MD_120291908751_005 |
| KIM API Version | 2.2 |
| Potential Type | eam |
| Programming Language(s)
The programming languages used in the code and the percentage of the code written in each one. "N/A" means "not applicable" and refers to model parameterizations which only include parameter tables and have no programming language.
| N/A |
| Grade | Name | Category | Brief Description | Full Results | Aux File(s) |
|---|---|---|---|---|---|
| P | vc-species-supported-as-stated | mandatory | The model supports all species it claims to support; see full description. |
Results | Files |
| P | vc-periodicity-support | mandatory | Periodic boundary conditions are handled correctly; see full description. |
Results | Files |
| P | vc-permutation-symmetry | mandatory | Total energy and forces are unchanged when swapping atoms of the same species; see full description. |
Results | Files |
| F | vc-dimer-continuity-c1 | informational | The energy versus separation relation of a pair of atoms is C1 continuous (i.e. the function and its first derivative are continuous); see full description. |
Results | Files |
| P | vc-objectivity | informational | Total energy is unchanged and forces transform correctly under rigid-body translation and rotation; see full description. |
Results | Files |
| P | vc-inversion-symmetry | informational | Total energy is unchanged and forces change sign when inverting a configuration through the origin; see full description. |
Results | Files |
| N/A | vc-memory-leak | informational | The model code does not have memory leaks (i.e. it releases all allocated memory at the end); see full description. |
Results | Files |
| P | vc-thread-safe | mandatory | The model returns the same energy and forces when computed in serial and when using parallel threads for a set of configurations. Note that this is not a guarantee of thread safety; see full description. |
Results | Files |
| P | vc-unit-conversion | mandatory | The model is able to correctly convert its energy and/or forces to different unit sets; see full description. |
Results | Files |
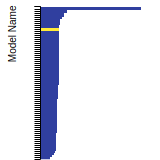
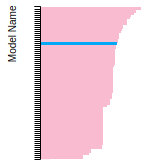
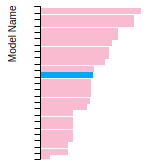
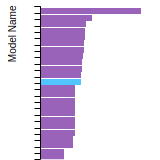
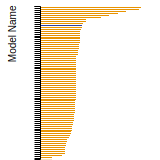
BCC Lattice Constant
This bar chart plot shows the mono-atomic body-centered cubic (bcc) lattice constant predicted by the current model (shown in the unique color) compared with the predictions for all other models in the OpenKIM Repository that support the species. The vertical bars show the average and standard deviation (one sigma) bounds for all model predictions. Graphs are generated for each species supported by the model.
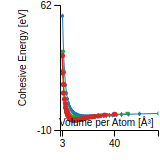
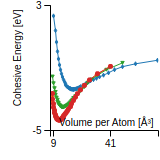
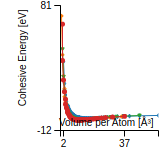
Cohesive Energy Graph
This graph shows the cohesive energy versus volume-per-atom for the current mode for four mono-atomic cubic phases (body-centered cubic (bcc), face-centered cubic (fcc), simple cubic (sc), and diamond). The curve with the lowest minimum is the ground state of the crystal if stable. (The crystal structure is enforced in these calculations, so the phase may not be stable.) Graphs are generated for each species supported by the model.
Diamond Lattice Constant
This bar chart plot shows the mono-atomic face-centered diamond lattice constant predicted by the current model (shown in the unique color) compared with the predictions for all other models in the OpenKIM Repository that support the species. The vertical bars show the average and standard deviation (one sigma) bounds for all model predictions. Graphs are generated for each species supported by the model.
Dislocation Core Energies
This graph shows the dislocation core energy of a cubic crystal at zero temperature and pressure for a specific set of dislocation core cutoff radii. After obtaining the total energy of the system from conjugate gradient minimizations, non-singular, isotropic and anisotropic elasticity are applied to obtain the dislocation core energy for each of these supercells with different dipole distances. Graphs are generated for each species supported by the model.
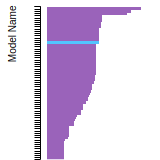
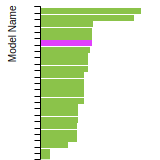
(No matching species)FCC Elastic Constants
This bar chart plot shows the mono-atomic face-centered cubic (fcc) elastic constants predicted by the current model (shown in blue) compared with the predictions for all other models in the OpenKIM Repository that support the species. The vertical bars show the average and standard deviation (one sigma) bounds for all model predictions. Graphs are generated for each species supported by the model.
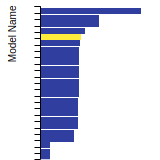
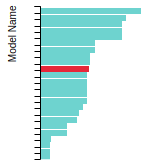
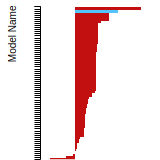
FCC Lattice Constant
This bar chart plot shows the mono-atomic face-centered cubic (fcc) lattice constant predicted by the current model (shown in red) compared with the predictions for all other models in the OpenKIM Repository that support the species. The vertical bars show the average and standard deviation (one sigma) bounds for all model predictions. Graphs are generated for each species supported by the model.
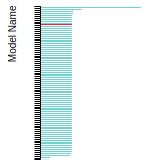
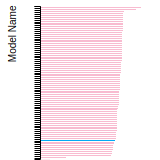
FCC Stacking Fault Energies
This bar chart plot shows the intrinsic and extrinsic stacking fault energies as well as the unstable stacking and unstable twinning energies for face-centered cubic (fcc) predicted by the current model (shown in blue) compared with the predictions for all other models in the OpenKIM Repository that support the species. The vertical bars show the average and standard deviation (one sigma) bounds for all model predictions. Graphs are generated for each species supported by the model.
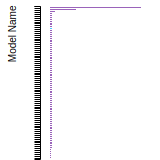
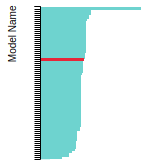
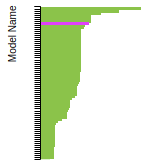
FCC Surface Energies
This bar chart plot shows the mono-atomic face-centered cubic (fcc) relaxed surface energies predicted by the current model (shown in blue) compared with the predictions for all other models in the OpenKIM Repository that support the species. The vertical bars show the average and standard deviation (one sigma) bounds for all model predictions. Graphs are generated for each species supported by the model.
SC Lattice Constant
This bar chart plot shows the mono-atomic simple cubic (sc) lattice constant predicted by the current model (shown in the unique color) compared with the predictions for all other models in the OpenKIM Repository that support the species. The vertical bars show the average and standard deviation (one sigma) bounds for all model predictions. Graphs are generated for each species supported by the model.
Cubic Crystal Basic Properties Table
Species: CrSpecies: Fe
Species: Ni
Creators:
Contributor: karls
Publication Year: 2019
DOI: https://doi.org/10.25950/64cb38c5
This Test Driver uses LAMMPS to compute the cohesive energy of a given monoatomic cubic lattice (fcc, bcc, sc, or diamond) at a variety of lattice spacings. The lattice spacings range from a_min (=a_min_frac*a_0) to a_max (=a_max_frac*a_0) where a_0, a_min_frac, and a_max_frac are read from stdin (a_0 is typically approximately equal to the equilibrium lattice constant). The precise scaling and number of lattice spacings sampled between a_min and a_0 (a_0 and a_max) is specified by two additional parameters passed from stdin: N_lower and samplespacing_lower (N_upper and samplespacing_upper). Please see README.txt for further details.
Creators:
Contributor: ilia
Publication Year: 2024
DOI: https://doi.org/10.25950/888f9943
Computes the elastic constants for an arbitrary crystal. A robust computational protocol is used, attempting multiple methods and step sizes to achieve an acceptably low error in numerical differentiation and deviation from material symmetry. The crystal structure is specified using the AFLOW prototype designation as part of the Crystal Genome testing framework. In addition, the distance from the obtained elasticity tensor to the nearest isotropic tensor is computed.
| Test | Test Results | Link to Test Results page | Benchmark time
Usertime multiplied by the Whetstone Benchmark. This number can be used (approximately) to compare the performance of different models independently of the architecture on which the test was run.
Measured in Millions of Whetstone Instructions (MWI) |
|---|---|---|---|
| Elastic constants for CrFe in AFLOW crystal prototype A2B_cF24_227_c_b at zero temperature and pressure v000 | view | 86644 | |
| Elastic constants for CrNi in AFLOW crystal prototype A2B_cF24_227_c_b at zero temperature and pressure v000 | view | 148051 | |
| Elastic constants for FeNi in AFLOW crystal prototype A2B_cF24_227_c_b at zero temperature and pressure v000 | view | 160714 |
Creators: Junhao Li and Ellad Tadmor
Contributor: tadmor
Publication Year: 2019
DOI: https://doi.org/10.25950/5853fb8f
Computes the cubic elastic constants for some common crystal types (fcc, bcc, sc, diamond) by calculating the hessian of the energy density with respect to strain. An estimate of the error associated with the numerical differentiation performed is reported.
| Test | Test Results | Link to Test Results page | Benchmark time
Usertime multiplied by the Whetstone Benchmark. This number can be used (approximately) to compare the performance of different models independently of the architecture on which the test was run.
Measured in Millions of Whetstone Instructions (MWI) |
|---|---|---|---|
| Elastic constants for bcc Cr at zero temperature v006 | view | 37387 | |
| Elastic constants for bcc Fe at zero temperature v006 | view | 16858 | |
| Elastic constants for bcc Ni at zero temperature v006 | view | 8051 | |
| Elastic constants for fcc Cr at zero temperature v006 | view | 16063 | |
| Elastic constants for fcc Fe at zero temperature v006 | view | 16451 | |
| Elastic constants for fcc Ni at zero temperature v006 | view | 16222 | |
| Elastic constants for sc Cr at zero temperature v006 | view | 32688 | |
| Elastic constants for sc Fe at zero temperature v006 | view | 8088 | |
| Elastic constants for sc Ni at zero temperature v006 | view | 15118 |
Creators:
Contributor: ilia
Publication Year: 2024
DOI: https://doi.org/10.25950/2f2c4ad3
Computes the equilibrium crystal structure and energy for an arbitrary crystal at zero temperature and applied stress by performing symmetry-constrained relaxation. The crystal structure is specified using the AFLOW prototype designation. Multiple sets of free parameters corresponding to the crystal prototype may be specified as initial guesses for structure optimization. No guarantee is made regarding the stability of computed equilibria, nor that any are the ground state.
Creators:
Contributor: brunnels
Publication Year: 2022
DOI: https://doi.org/10.25950/2c59c9d6
Computes grain boundary energy for a range of tilt angles given a crystal structure, tilt axis, and material.
Creators: Daniel S. Karls and Junhao Li
Contributor: karls
Publication Year: 2019
DOI: https://doi.org/10.25950/2765e3bf
Equilibrium lattice constant and cohesive energy of a cubic lattice at zero temperature and pressure.
Creators: Daniel S. Karls and Junhao Li
Contributor: karls
Publication Year: 2019
DOI: https://doi.org/10.25950/c339ca32
Calculates lattice constant of hexagonal bulk structures at zero temperature and pressure by using simplex minimization to minimize the potential energy.
| Test | Test Results | Link to Test Results page | Benchmark time
Usertime multiplied by the Whetstone Benchmark. This number can be used (approximately) to compare the performance of different models independently of the architecture on which the test was run.
Measured in Millions of Whetstone Instructions (MWI) |
|---|---|---|---|
| Equilibrium lattice constants for hcp Cr v005 | view | 106896 | |
| Equilibrium lattice constants for hcp Fe v005 | view | 96274 | |
| Equilibrium lattice constants for hcp Ni v005 | view | 143939 |
Creators:
Contributor: mjwen
Publication Year: 2024
DOI: https://doi.org/10.25950/9d9822ec
This Test Driver uses LAMMPS to compute the linear thermal expansion coefficient at a finite temperature under a given pressure for a cubic lattice (fcc, bcc, sc, diamond) of a single given species.
| Test | Test Results | Link to Test Results page | Benchmark time
Usertime multiplied by the Whetstone Benchmark. This number can be used (approximately) to compare the performance of different models independently of the architecture on which the test was run.
Measured in Millions of Whetstone Instructions (MWI) |
|---|---|---|---|
| Linear thermal expansion coefficient of bcc Cr at 293.15 K under a pressure of 0 MPa v002 | view | 383517 | |
| Linear thermal expansion coefficient of bcc Fe at 293.15 K under a pressure of 0 MPa v002 | view | 454849 | |
| Linear thermal expansion coefficient of fcc Ni at 293.15 K under a pressure of 0 MPa v002 | view | 786417 |
Creators: Matt Bierbaum
Contributor: mattbierbaum
Publication Year: 2019
DOI: https://doi.org/10.25950/64f4999b
Calculates the phonon dispersion relations for fcc lattices and records the results as curves.
| Test | Test Results | Link to Test Results page | Benchmark time
Usertime multiplied by the Whetstone Benchmark. This number can be used (approximately) to compare the performance of different models independently of the architecture on which the test was run.
Measured in Millions of Whetstone Instructions (MWI) |
|---|---|---|---|
| Phonon dispersion relations for fcc Ni v004 | view | 100497 |
Creators:
Contributor: SubrahmanyamPattamatta
Publication Year: 2019
DOI: https://doi.org/10.25950/b4cfaf9a
Intrinsic and extrinsic stacking fault energies, unstable stacking fault energy, unstable twinning energy, stacking fault energy as a function of fractional displacement, and gamma surface for a monoatomic FCC lattice at zero temperature and pressure.
| Test | Test Results | Link to Test Results page | Benchmark time
Usertime multiplied by the Whetstone Benchmark. This number can be used (approximately) to compare the performance of different models independently of the architecture on which the test was run.
Measured in Millions of Whetstone Instructions (MWI) |
|---|---|---|---|
| Stacking and twinning fault energies for fcc Ni v002 | view | 17640092 |
Creators: Matt Bierbaum
Contributor: mattbierbaum
Publication Year: 2019
DOI: https://doi.org/10.25950/6c43a4e6
Calculates the surface energy of several high symmetry surfaces and produces a broken-bond model fit. In latex form, the fit equations are given by:
E_{FCC} (\vec{n}) = p_1 (4 \left( |x+y| + |x-y| + |x+z| + |x-z| + |z+y| +|z-y|\right)) + p_2 (8 \left( |x| + |y| + |z|\right)) + p_3 (2 ( |x+ 2y + z| + |x+2y-z| + |x-2y + z| + |x-2y-z| + |2x+y+z| + |2x+y-z| +|2x-y+z| +|2x-y-z| +|x+y+2z| +|x+y-2z| +|x-y+2z| +|x-y-2z| ) + c
E_{BCC} (\vec{n}) = p_1 (6 \left( | x+y+z| + |x+y-z| + |-x+y-z| + |x-y+z| \right)) + p_2 (8 \left( |x| + |y| + |z|\right)) + p_3 (4 \left( |x+y| + |x-y| + |x+z| + |x-z| + |z+y| +|z-y|\right)) +c.
In Python, these two fits take the following form:
def BrokenBondFCC(params, index):
import numpy
x, y, z = index
x = x / numpy.sqrt(x**2.+y**2.+z**2.)
y = y / numpy.sqrt(x**2.+y**2.+z**2.)
z = z / numpy.sqrt(x**2.+y**2.+z**2.)
return params[0]*4* (abs(x+y) + abs(x-y) + abs(x+z) + abs(x-z) + abs(z+y) + abs(z-y)) + params[1]*8*(abs(x) + abs(y) + abs(z)) + params[2]*(abs(x+2*y+z) + abs(x+2*y-z) +abs(x-2*y+z) +abs(x-2*y-z) + abs(2*x+y+z) +abs(2*x+y-z) +abs(2*x-y+z) +abs(2*x-y-z) + abs(x+y+2*z) +abs(x+y-2*z) +abs(x-y+2*z) +abs(x-y-2*z))+params[3]
def BrokenBondBCC(params, x, y, z):
import numpy
x, y, z = index
x = x / numpy.sqrt(x**2.+y**2.+z**2.)
y = y / numpy.sqrt(x**2.+y**2.+z**2.)
z = z / numpy.sqrt(x**2.+y**2.+z**2.)
return params[0]*6*(abs(x+y+z) + abs(x-y-z) + abs(x-y+z) + abs(x+y-z)) + params[1]*8*(abs(x) + abs(y) + abs(z)) + params[2]*4* (abs(x+y) + abs(x-y) + abs(x+z) + abs(x-z) + abs(z+y) + abs(z-y)) + params[3]
| Test | Test Results | Link to Test Results page | Benchmark time
Usertime multiplied by the Whetstone Benchmark. This number can be used (approximately) to compare the performance of different models independently of the architecture on which the test was run.
Measured in Millions of Whetstone Instructions (MWI) |
|---|---|---|---|
| Broken-bond fit of high-symmetry surface energies in bcc Cr v004 | view | 77410 | |
| Broken-bond fit of high-symmetry surface energies in bcc Fe v004 | view | 78066 | |
| Broken-bond fit of high-symmetry surface energies in fcc Ni v004 | view | 97162 |
Creators:
Contributor: efuem
Publication Year: 2023
DOI: https://doi.org/10.25950/fca89cea
Computes the monovacancy formation energy and relaxation volume for cubic and hcp monoatomic crystals.
| Test | Test Results | Link to Test Results page | Benchmark time
Usertime multiplied by the Whetstone Benchmark. This number can be used (approximately) to compare the performance of different models independently of the architecture on which the test was run.
Measured in Millions of Whetstone Instructions (MWI) |
|---|---|---|---|
| Monovacancy formation energy and relaxation volume for bcc Cr | view | 390041 | |
| Monovacancy formation energy and relaxation volume for bcc Fe | view | 471245 | |
| Monovacancy formation energy and relaxation volume for fcc Ni | view | 356691 |
Creators:
Contributor: efuem
Publication Year: 2023
DOI: https://doi.org/10.25950/c27ba3cd
Computes the monovacancy formation and migration energies for cubic and hcp monoatomic crystals.
| Test | Test Results | Link to Test Results page | Benchmark time
Usertime multiplied by the Whetstone Benchmark. This number can be used (approximately) to compare the performance of different models independently of the architecture on which the test was run.
Measured in Millions of Whetstone Instructions (MWI) |
|---|---|---|---|
| Vacancy formation and migration energy for bcc Cr | view | 3609539 | |
| Vacancy formation and migration energy for bcc Fe | view | 5675183 | |
| Vacancy formation and migration energy for fcc Ni | view | 943594 |
| Test | Error Categories | Link to Error page |
|---|---|---|
| Elastic constants for diamond Cr at zero temperature v001 | other | view |
| Elastic constants for diamond Fe at zero temperature v001 | other | view |
| Elastic constants for diamond Ni at zero temperature v001 | other | view |
ElasticConstantsHexagonal__TD_612503193866_004
| Test | Error Categories | Link to Error page |
|---|---|---|
| Elastic constants for hcp Cr at zero temperature v004 | other | view |
| Elastic constants for hcp Fe at zero temperature v004 | other | view |
| Elastic constants for hcp Ni at zero temperature v004 | other | view |
EquilibriumCrystalStructure__TD_457028483760_000
| Test | Error Categories | Link to Error page |
|---|---|---|
| Equilibrium crystal structure and energy for CrFe in AFLOW crystal prototype AB3_cP4_221_a_c v000 | other | view |
EquilibriumCrystalStructure__TD_457028483760_002
| Test | Error Categories | Link to Error page |
|---|---|---|
| Equilibrium crystal structure and energy for Fe in AFLOW crystal prototype A_tP1_123_a v002 | other | view |
PhononDispersionCurve__TD_530195868545_004
| Test | Error Categories | Link to Error page |
|---|---|---|
| Phonon dispersion relations for fcc Ni v004 | other | view |
SurfaceEnergyCubicCrystalBrokenBondFit__TD_955413365818_004
| Test | Error Categories | Link to Error page |
|---|---|---|
| Broken-bond fit of high-symmetry surface energies in bcc Cr v004 | other | view |
| Broken-bond fit of high-symmetry surface energies in bcc Fe v004 | other | view |
| Broken-bond fit of high-symmetry surface energies in fcc Ni v004 | other | view |
No Driver
| Verification Check | Error Categories | Link to Error page |
|---|---|---|
| ForcesNumerDeriv__VC_710586816390_003 | other | view |
| MemoryLeak__VC_561022993723_004 | other | view |
| EAM_Dynamo_ZhouFosterSills_2018_FeNiCr__MO_036303866285_000.txz | Tar+XZ | Linux and OS X archive |
| EAM_Dynamo_ZhouFosterSills_2018_FeNiCr__MO_036303866285_000.zip | Zip | Windows archive |
This Model requires a Model Driver. Archives for the Model Driver EAM_Dynamo__MD_120291908751_005 appear below.
| EAM_Dynamo__MD_120291908751_005.txz | Tar+XZ | Linux and OS X archive |
| EAM_Dynamo__MD_120291908751_005.zip | Zip | Windows archive |