Citations
This panel presents information regarding the papers that have cited the interatomic potential (IP) whose page you are on.
The OpenKIM machine learning based Deep Citation framework is used to determine whether the citing article actually used the IP in computations (denoted by "USED") or only provides it as a background citation (denoted by "NOT USED"). For more details on Deep Citation and how to work with this panel, click the documentation link at the top of the panel.
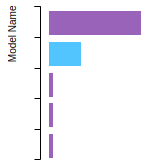
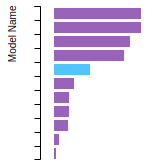
The word cloud to the right is generated from the abstracts of IP principle source(s) (given below in "How to Cite") and the citing articles that were determined to have used the IP in order to provide users with a quick sense of the types of physical phenomena to which this IP is applied.
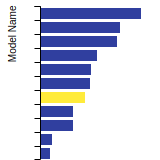
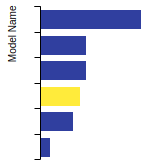
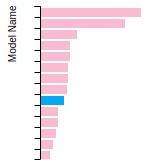
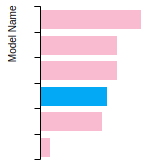
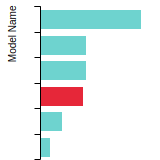
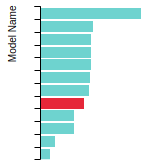
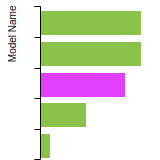
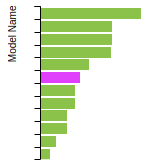
The bar chart shows the number of articles that cited the IP per year. Each bar is divided into green (articles that USED the IP) and blue (articles that did NOT USE the IP).
Users are encouraged to correct Deep Citation errors in determination by clicking the speech icon next to a citing article and providing updated information. This will be integrated into the next Deep Citation learning cycle, which occurs on a regular basis.
OpenKIM acknowledges the support of the Allen Institute for AI through the Semantic Scholar project for providing citation information and full text of articles when available, which are used to train the Deep Citation ML algorithm.
|
This panel provides information on past usage of this interatomic potential (IP) powered by the OpenKIM Deep Citation framework. The word cloud indicates typical applications of the potential. The bar chart shows citations per year of this IP (bars are divided into articles that used the IP (green) and those that did not (blue)). The complete list of articles that cited this IP is provided below along with the Deep Citation determination on usage. See the Deep Citation documentation for more information.
75 Citations (50 used)
Help us to determine which of the papers that cite this potential actually used it to perform calculations. If you know, click the .
USED (high confidence) Y.-T. Zhang, Y.-P. Wang, Y. Zhang, S. Du, and S. Pantelides, “Thermal transport of amorphous carbon and boron-nitride monolayers.” 2021. link Times cited: 2 Abstract: 1 University of Chinese Academy of Sciences and Institute of… read moreAbstract: 1 University of Chinese Academy of Sciences and Institute of Physics, Chinese Academy of Sciences, Beijing 100049, China 2 Hunan Key Laboratory for Super Microstructure and Ultrafast Process, School of Physics and Electronics, Central South University, Changsha 410083, China 3 CAS Center for Excellence in Topological Quantum Computation, University of Chinese Academy of Sciences, Beijing 100049, China 4 Songshan Lake Materials Laboratory, Dongguan, Guangdong 523808, China 5 Department of Physics and Astronomy and Department of Electrical and Computer Engineering, Vanderbilt University, Nashville, Tennessee 37235, USA read less USED (high confidence) M. Z. Dehaghani et al., “α-Helical Antimicrobial Peptide Encapsulation and Release from Boron Nitride Nanotubes: A Computational Study,” International Journal of Nanomedicine. 2021. link Times cited: 9 Abstract: Introduction Antimicrobial peptides are potential therapeuti… read moreAbstract: Introduction Antimicrobial peptides are potential therapeutics as anti-bacteria, anti-viruses, anti-fungi, or anticancers. However, they suffer from a short half-life and drug resistance which limit their long-term clinical usage. Methods Herein, we captured the encapsulation of antimicrobial peptide HA-FD-13 into boron nitride nanotube (BNNT) (20,20) and its release due to subsequent insertion of BNNT (14,14) with molecular dynamics simulation. Results The peptide-BNNT (20,20) van der Waals (vdW) interaction energy decreased to −270 kcal·mol−1 at the end of the simulation (15 ns). However, during the period of 0.2–1.8 ns, when half of the peptide was inside the nanotube, the encapsulation was paused due to an energy barrier in the vicinity of BNNT and subsequently the external intervention, such that the self-adjustment of the peptide allowed full insertion. The free energy of the encapsulation process was −200.12 kcal·mol−1, suggesting that the insertion procedure occurred spontaneously. Discussion Once the BNNT (14,14) entered into the BNNT (20,20), the peptide was completely released after 83.8 ps. This revealed that the vdW interaction between the BNNT (14,14) and BNNT (20,20) was stronger than between BNNT (20,20) and the peptide; therefore, the BNNT (14,14) could act as a piston pushing the peptide outside the BNNT (20,20). Moreover, the sudden drop in the vdW energy between nanotubes to the value of the −1300 Kcal·mol−1 confirmed the self-insertion of the BNNT (14,14) into the BNNT (20,20) and correspondingly the release of the peptide. read less USED (high confidence) P. Zeiger and J. Rusz, “Frequency-resolved frozen phonon multislice method and its application to vibrational electron energy loss spectroscopy using parallel illumination,” Physical Review B. 2021. link Times cited: 5 Abstract: We explore the capabilities of the frequency-resolved frozen… read moreAbstract: We explore the capabilities of the frequency-resolved frozen phonon multislice method introduced in Phys. Rev. Lett. 124, 025501 (2020) to model inelastic vibrational scattering in transmission electron microscopy. We review the method in detail and discuss advantages of using a so called hotspot thermostat instead of the $\delta$-thermostat used in our first report. We apply the method to simulate vibrational electron energy loss spectra of hexagonal boron nitride under plane wave illumination. Simulated spectroscopic information well represents the theoretical phonon bandstructure of the studied material, both in terms of energies as well as polarization vectors of individual phonon modes. read less USED (high confidence) M. Z. Dehaghani et al., “Boron Nitride Nanotube as an Antimicrobial Peptide Carrier: A Theoretical Insight,” International Journal of Nanomedicine. 2021. link Times cited: 21 Abstract: Introduction Nanotube-based drug delivery systems have recei… read moreAbstract: Introduction Nanotube-based drug delivery systems have received considerable attention because of their large internal volume to encapsulate the drug and the ability to penetrate tissues, cells, and bacteria. In this regard, understanding the interaction between the drug and the nanotube to evaluate the encapsulation behavior of the drug in the nanotube is of crucial importance. Methods In this work, the encapsulation process of the cationic antimicrobial peptide named cRW3 in the biocompatible boron nitride nanotube (BNNT) was investigated under the Canonical ensemble (NVT) by molecular dynamics (MD) simulation. Results The peptide was absorbed into the BNNT by van der Waals (vdW) interaction between cRW3 and the BNNT, in which the vdW interaction decreased during the simulation process and reached the value of −142.7 kcal·mol−1 at 4 ns. Discussion The increase in the potential mean force profile of the encapsulated peptide during the pulling process of cRW3 out of the nanotube showed that its insertion into the BNNT occurred spontaneously and that the inserted peptide had the desired stability. The energy barrier at the entrance of the BNNT caused a pause of 0.45 ns when half of the peptide was inside the BNNT during the encapsulation process. Therefore, during this period, the peptide experienced the weakest movement and the smallest conformational changes. read less USED (high confidence) I. Shepelev, S. Dmitriev, and E. Korznikova, “Molecular dynamics simulation of high-speed loading of 2D boron nitride,” Letters on Materials. 2021. link Times cited: 0 Abstract: The purpose of this work is to carry out a thorough analysis… read moreAbstract: The purpose of this work is to carry out a thorough analysis of fine structural parameters and energy scattering channels in a hexagonal boron nitride lattice subjected to shock loading. This external influence leads to the formation of a shock wave in the material. It has been shown that shock waves can be initiated by giving an initial pulse to a single atomic row in the direction normal to that row. At the same time, such initial conditions do not correspond to the stable shock wave profile, but it is formed after a sufficiently short transition period of about 0.1 ps. It has been shown that shock waves in the material under study can propagate only in the two crystallographic directions, namely zigzag and armchair directions. In all the cases, the shock waves travel faster than the speed of sound in the studied material. Mechanisms of shock wave propagation have been investigated. We have revealed that propagation of the shock wave in the zigzag direction is associated with smallest energy losses. We discover that the major mechanisms of energy dissipation in the material during shock wave propagation are the bond length and the bond angle oscillations. read less USED (high confidence) O. Mouhoub et al., “Quantitative insights into the growth mechanisms of nanopores in hexagonal boron nitride,” Physical Review Materials. 2020. link Times cited: 7 Abstract: The formation of nanopores under electron irradiation is an … read moreAbstract: The formation of nanopores under electron irradiation is an ideal process to quantify chemical bonds in two-dimensional materials. Nowadays, high-resolution transmission electron microscopy (HRTEM) allows investigating such nucleation and growth phenomena with incomparable spatial and temporal resolution. Moreover, theoretical calculations are usually exploited to confirm characteristic features of these atomic-scale observations. Nevertheless, the full understanding of the ejection mechanisms of atoms requires a detailed investigation of the interplay between the very dynamic edge structure of expanding nanopores and the displacement energy of edge atoms $({E}_{D})$. Here, the dynamics of triangular nanopores in hexagonal boron nitride (h-BN) under various electron dose rates was followed by aberration-corrected HRTEM with high temporal resolution to provide new in situ insights into their growth processes. We reveal that the ejection of atomic pairs is an elemental mechanism that considerably speeds up the expansion of nanopores. Atomic-scale calculations were exploited to quantify the structure-dependent ${E}_{D}$ of all the ejected edge atoms. They revealed strong variations of this threshold energy during the growth processes. This quantitative study reconciles theoretical and experimental measurements of the ejection rate of atoms in h-BN under electron irradiation, which is essential for nanopore engineering in this atomically thin membrane. read less USED (low confidence) S.-P. Ju, C.-C. Huang, and H.-Y. Chen, “Illuminating the mechanical responses of amorphous boron nitride through deep learning: A molecular dynamics study,” Computational Materials Science. 2024. link Times cited: 0 USED (low confidence) S. Gupta and J. Narayan, “Laser-induced synthesis of cubic BN nanoneedles: a new approach to fabricating nanomaterials for advanced applications,” Journal of Nanoparticle Research. 2023. link Times cited: 0 USED (low confidence) G. Zhang, Y. Chen, S. Yue, Y.-W. Zhang, H. Qin, and Y. Liu, “A unified strength criterion for two-dimensional materials via bond failure analysis,” Journal of the Mechanics and Physics of Solids. 2023. link Times cited: 1 USED (low confidence) N. Sakharova, A. F. G. Pereira, and J. Antunes, “A Study of the Mechanical Behaviour of Boron Nitride Nanosheets Using Numerical Simulation,” Nanomaterials. 2023. link Times cited: 0 Abstract: Hexagonal boron nitride (h-BN) nanosheets are attractive mat… read moreAbstract: Hexagonal boron nitride (h-BN) nanosheets are attractive materials for various applications that require efficient heat transfer, surface adsorption capability, biocompatibility, and flexibility, such as optoelectronics and power electronics devices, nanoelectromechanical systems, and aerospace industry. Knowledge of the mechanical behavior of boron nitride nanosheets is necessary to achieve accurate design and optimal performance of h-BN-based nanodevices and nanosystems. In this context, the Young’s and shear moduli and Poisson’s ratio of square and rectangular boron nitride nanosheets were evaluated using the nanoscale continuum modeling approach, also known as molecular structural mechanics. The latter allows robust and rapid assessment of the elastic constants of nanostructures with graphene-like lattices. To date, there is a lack of systematic research regarding the influence of input parameters for numerical simulation, loading conditions, size, and aspect ratio on the elastic properties of the h-BN nanosheets. The current study contributes to filling this gap. The results allow, on the one hand, to point out the input parameters that lead to better agreement with those available in the literature. On the other hand, the Young’s and shear moduli, and Poisson’s ratio calculated in the present work contribute to a benchmark for the evaluation of elastic constants of h-BN nanosheets using theoretical methods. read less USED (low confidence) N. Kumari and S. K. Sarangi, “Computational study on the effect of aspect ratio on Young’s modulus of boron nitride nanosheets,” Physica Scripta. 2023. link Times cited: 1 Abstract: The effect of the aspect ratio on Young’s modulus (E) of bor… read moreAbstract: The effect of the aspect ratio on Young’s modulus (E) of boron nitride nanosheets (BNNS) was evaluated using molecular dynamics simulation techniques employing the Tersoff potential field. The aspect ratio (L/B) of BNNS may influence the elastic properties; therefore, the values are varied from 2 to 12. Our results revealed that the E of BNNS decreased with an increase in the aspect ratio up to 9 and then became stable in both the armchair and zigzag directions. It is anticipated that the result will provide a beneficial understanding of the elastic properties of BNNS, which can aid in the design and implementation of structured and tailored NEMS devices, transistors, sensors, lightweight materials, and automotive sectors. read less USED (low confidence) “Subcontinuum scale analysis of diamond lattice films through spatial multi-level coarsening method,” Thin-Walled Structures. 2023. link Times cited: 2 USED (low confidence) T. Zhou, Q. Wu, G. Zhao, Z. Wang, B. Guo, and H. Wu, “Analysis of the effect of tool geometry on the cutting process of polycrystalline Fe-Cr-W alloy based on molecular dynamics simulation,” Journal of Manufacturing Processes. 2023. link Times cited: 1 USED (low confidence) N. Vafa, A. H. Mashhadzadeh, M. Z. Dehaghani, B. Firoozabadi, S. Nouranian, and C. Spitas, “Molecular Dynamics Simulation of Hexagonal Boron Nitride Slit Membranes for Wastewater Treatment,” Journal of Molecular Liquids. 2023. link Times cited: 2 USED (low confidence) H. Yuan, G. Huang, G. Qin, L.-chuan Zhang, Y. Xie, and Y. Chen, “Two-Dimensional Carbon Networks with a Negative Poisson’s Ratio,” Crystals. 2023. link Times cited: 1 Abstract: Low-dimensional materials with a negative Poisson’s ratio (N… read moreAbstract: Low-dimensional materials with a negative Poisson’s ratio (NPR) have attracted lots of attention for their potential applications in aerospace, defense, etc. Although graphene and monolayer h-BN have been reported to have NPR behavior under external strains, the mechanism is not clear, and the critical strains of the occurrence of a NPR are relatively larger. Here, we propose that the origination of the NPR phenomena in the 2D honeycomb structures can be explained by the variation of the zigzag chains under strains. Our calculations clarify that a NPR occurs along the armchair-chain direction rather than the zigzag-chain direction in these materials. Furthermore, a series of two-dimensional carbon networks including zigzag chains have demonstrated that there is NPR phenomena in them. In some of the networks, a NPR can be found under a small external strain. Our study not only deepens the understanding of the origin of NPR in honeycomb systems but also offers guidance to design auxetic nanostructures. read less USED (low confidence) D. Wang, Y. Zhang, Q. Zhao, J. Jiang, G. Liu, and C. Li, “Tribological mechanism of carbon group nanofluids on grinding interface under minimum quantity lubrication based on molecular dynamic simulation,” Frontiers of Mechanical Engineering. 2023. link Times cited: 4 USED (low confidence) S. Banik et al., “A Continuous Action Space Tree search for INverse desiGn (CASTING) framework for materials discovery,” npj Computational Materials. 2022. link Times cited: 1 USED (low confidence) T. Zhou et al., “Research on the effect of cutting parameters on the machinability of polycrystalline Fe-Cr-W alloy by molecular dynamics simulation,” Proceedings of the Institution of Mechanical Engineers, Part B: Journal of Engineering Manufacture. 2022. link Times cited: 4 Abstract: Molecular dynamics simulation has become a major theoretical… read moreAbstract: Molecular dynamics simulation has become a major theoretical analysis method for ultra precision machining of various materials. Large Scale Atomic/Molecular Massively Parallel Simulator (LAMMPS) is used to construct a molecular dynamics model for cutting polycrystalline Fe-Cr-W alloy with CBN tool. The geometric parameters of the tool model are: the rake angle is −10°, the clearance angle is 7°, and the tool tip radius is 1.5 nm, including 8570 atoms. The size of the workpiece model is 24 nm × 10 nm × 10 nm, including 203,893 atoms. Ovito is used to visually analyze the influence of cutting parameters on the machinability of workpieces. The results show that the extrusion of the tool on the workpiece makes the atoms of the workpiece move and become chips and machined surfaces. Excessive cutting speed and depth will produce large hydrostatic stress, large cutting force, high cutting temperature and deteriorate the machined surface. read less USED (low confidence) H. Sharma et al., “Thermoatomic analysis of monovacancy defected single-walled boron nitride nanotube under quasi-static strain: Insights from molecular dynamics,” Materials Chemistry and Physics. 2022. link Times cited: 1 USED (low confidence) J. L. Y. Ma, B. Ding, S. Wang, L. Shao, and Y.-L. Chen, “Failure of substrate-supported hexagonal boron nitride under complicated loading conditions,” Mechanics of Materials. 2022. link Times cited: 0 USED (low confidence) A. Abdolazizi, S. Chen, D. Golberg, and C. Yan, “Anisotropy of Two-Dimensional Materials Under Tension: A Molecular Dynamic Study Across Graphene, Hexagonal Boron Nitride and Molybdenum Disulphide,” SSRN Electronic Journal. 2022. link Times cited: 1 USED (low confidence) J. Lu et al., “Molecular dynamics simulation of the temperature effect on ideal mechanical properties of SiC/BN interface for SiCf/SiC composites,” Composite Interfaces. 2022. link Times cited: 0 Abstract: ABSTRACT Interfacial strength plays a significant role in th… read moreAbstract: ABSTRACT Interfacial strength plays a significant role in the mechanical properties of SiCf/SiC composites. The understanding of the micro-mechanisms of interfacial strength on mechanical properties at different temperature is important in application of SiCf/SiC composite. In the present work, the interfacial properties of ideal tensile strength and fracture toughness of SiC/BN interface at different temperature were studied based on molecular dynamics. It is revealed that the interfacial strength of Case Si (Si-terminated SiC/BN interface) decreases with the increase of temperature, resulting in the decrease of tensile strength and fracture toughness, while the interfacial strength of Case C (C-terminated SiC/BN interface) basically remains unchanged; so the interfacial properties of Case C are less affected by temperature. This phenomenon is well explained in terms of stress distribution and interface bonding number. Our results provide a good theoretical explanation for the high-temperature service performance of ceramic matrix composites. Graphical abstract read less USED (low confidence) W. Li and C.-G. Yang, “Thermal transport properties of monolayer GeS and SnS: A comparative study based on machine learning and SW interatomic potential models,” AIP Advances. 2022. link Times cited: 5 Abstract: Phonon transport properties of two-dimensional materials can… read moreAbstract: Phonon transport properties of two-dimensional materials can play a crucial role in the thermal management of low-dimensional electronic devices and thermoelectric applications. In this study, both the empirical Stillinger–Weber (SW) and machine learning interatomic potentials are employed to investigate the lattice thermal conductivity of monolayer GeS and SnS through solving the phonon Boltzmann transport equation. The accuracy of the two types of interatomic potentials and their performance for the evaluation of thermal conductivity are verified by analyzing phonon harmonic and anharmonic properties. Our results indicate that the thermal conductivity can be predicted more accurately with a machine learning approach, while the SW potential gives rise to an overestimated value for both monolayers. In addition, the in-plane anisotropy of thermal transport properties existing in these monolayers can be confirmed by both potential models. Moreover, the origins of the deviation existing in calculated thermal conductivities, including both the effects of interatomic potential models and monolayer compositions, are elucidated through uncovering the underlying phonon transport mechanisms. This study highlights that in contrast to the machine learning approach, more careful verification is required for the simulation of thermal transport properties when empirical interatomic potential models are employed. read less USED (low confidence) A. Galashev, “Numerical simulation of functioning a silicene anode of a lithium-ion battery,” J. Comput. Sci. 2022. link Times cited: 3 USED (low confidence) M. Z. Dehaghani et al., “Encapsulation of an anticancer drug Isatin inside a host nano-vehicle SWCNT: a molecular dynamics simulation,” Scientific Reports. 2021. link Times cited: 14 USED (low confidence) P. Michałowski et al., “Defect-mediated sputtering process of boron nitride during high incident angle low-energy ion bombardment,” Measurement. 2021. link Times cited: 4 USED (low confidence) B. M. R. Raj, S. Singh, and K. Mali, “Multiscale based finite element modeling for the nonlinear bending and postbuckling analyses of some noncarbon nanomaterials,” International Journal of Non-linear Mechanics. 2021. link Times cited: 0 USED (low confidence) S. Ghaderzadeh, S. Kretschmer, M. Ghorbani-Asl, G. Hlawacek, and A. Krasheninnikov, “Atomistic Simulations of Defect Production in Monolayer and Bulk Hexagonal Boron Nitride under Low- and High-Fluence Ion Irradiation,” Nanomaterials. 2021. link Times cited: 3 Abstract: Controlled production of defects in hexagonal boron nitride … read moreAbstract: Controlled production of defects in hexagonal boron nitride (h-BN) through ion irradiation has recently been demonstrated to be an effective tool for adding new functionalities to this material, such as single-photon generation, and for developing optical quantum applications. Using analytical potential molecular dynamics, we study the mechanisms of vacancy creation in single- and multi-layer h-BN under low- and high-fluence ion irradiation. Our results quantify the densities of defects produced by noble gas ions in a wide range of ion energies and elucidate the types and distribution of defects in the target. The simulation data can directly be used to guide the experiment aimed at the creation of defects of particular types in h-BN targets for single-photon emission, spin-selective optical transitions and other applications by using beams of energetic ions. read less USED (low confidence) S. Singh, B. M. R. Raj, K. Mali, and G. Watts, “Elastic Properties and Nonlinear Elasticity of the Noncarbon Hexagonal Lattice Nanomaterials Based on the Multiscale Modeling,” Journal of Engineering Materials and Technology-transactions of The Asme. 2021. link Times cited: 3 Abstract:
This study presents the elastic properties and nonlinear e… read moreAbstract:
This study presents the elastic properties and nonlinear elasticity of the two-dimensional noncarbon nanomaterials of hexagonal lattice structures having molecular structure XY. Four nitride-based and two phosphide-based two-dimensional nanomaterials, having graphene-like hexagonal lattice structure, are considered in the present study. The four empirical parameters associated with the attractive and repulsive terms of the Tersoff–Brenner potential are calibrated for noncarbon nanomaterials and tested for elastic properties, nonlinear constitutive behavior, bending modulus, bending and torsional energy. The mathematical identities for the tangent constitutive matrix in terms of the interatomic potential function are derived through an atomistic–continuum coupled multiscale framework of the extended version of Cauchy–Born rule. The results obtained using newly calibrated empirical parameters for cohesive energy, bond length, elastic properties, and bending rigidity are compared with those reported in the literature through experimental investigations and quantum mechanical calculations. The continuum approximation is attained through the finite element method. Multiscale evaluations for elastic properties and nonlinear stretching of the nanosheets under in-plane loads are also compared with those obtained from atomistic simulations. read less USED (low confidence) Y. Fan, W. Wang, and Z. Hao, “Diffusion mechanism in cutting Ni-based alloy containing γ′ phase (Ni3Al) with CBN tool based on MD simulation,” Proceedings of the Institution of Mechanical Engineers, Part B: Journal of Engineering Manufacture. 2021. link Times cited: 3 Abstract: Ni-based alloys are widely used in aerospace because of thei… read moreAbstract: Ni-based alloys are widely used in aerospace because of their high strength and high temperature oxidation resistance. CBN tool is suitable for precision machining of Ni-based alloy. Diffusion wear is an important wear form of CBN tool in the process of cutting Ni-based alloy. Therefore, it is of great significance to study the diffusion phenomenon in the process of cutting Ni-based alloy with CBN tool. In this paper, the cutting model of Ni-based alloy containing γ′ phase (Ni3Al) with CBN tool is established based on the molecular dynamics (MD) simulation method. The self diffusion activation energy of all kinds of atoms in the workpiece and the formation energy of several point defects in the tool are calculated, so as to study in depth the atom diffusion mechanism according to the simulation results. The results show that the atoms in the crystal boundary of the workpiece are the most easily diffused, followed by the atoms in the phase boundary, and the atoms in the lattice are the most difficult to diffuse. When the workpiece atoms diffuse into the tool, it is easier to diffuse into the tool grain boundary than to form interstitial impurity atoms or displacement impurity atoms. It is more difficult to form the substitutional impurity atom than to form the interstitial impurity atom. read less USED (low confidence) A. Roy, K. K. Gupta, S. Naskar, T. Mukhopadhyay, and S. Dey, “Compound influence of topological defects and heteroatomic inclusions on the mechanical properties of SWCNTs,” Materials today communications. 2021. link Times cited: 15 USED (low confidence) M. Zhou, T. Liang, B.-R. Wu, J. Liu, and P. Zhang, “Phonon transport in antisite-substituted hexagonal boron nitride nanosheets: A molecular dynamics study,” Journal of Applied Physics. 2020. link Times cited: 10 Abstract: This study uses non-equilibrium molecular dynamics simulatio… read moreAbstract: This study uses non-equilibrium molecular dynamics simulations to investigate the impact of antisite substitution on thermal conductivity. The phonon-dispersion curve and predicted thermal conductivity of pristine hexagonal boron nitride nanosheets (hBNNSs) show good agreement with the experiment results, indicating the reliability of the extep potential. It is clear that both neighboring substitution (NS) and random substitution (RS) drastically reduce the thermal conductivity of hBNNSs, of which RS has a larger effect. Calculations for the participation ratio and relaxation time show that the localization is the primary cause for the reduction in thermal conductivity when the defect concentration is low. When the defect concentration is higher, the primary cause is phonon-defect scattering in all phonon modes. RS has a larger effect on the phonon modes with long mean free paths, while NS has a larger effect on phonon modes with various lengths of mean free paths. read less USED (low confidence) F. Cellini et al., “Pressure‐Induced Formation and Mechanical Properties of 2D Diamond Boron Nitride,” Advanced Science. 2020. link Times cited: 14 Abstract: Understanding phase transformations in 2D materials can unlo… read moreAbstract: Understanding phase transformations in 2D materials can unlock unprecedented developments in nanotechnology, since their unique properties can be dramatically modified by external fields that control the phase change. Here, experiments and simulations are used to investigate the mechanical properties of a 2D diamond boron nitride (BN) phase induced by applying local pressure on atomically thin h‐BN on a SiO2 substrate, at room temperature, and without chemical functionalization. Molecular dynamics (MD) simulations show a metastable local rearrangement of the h‐BN atoms into diamond crystal clusters when increasing the indentation pressure. Raman spectroscopy experiments confirm the presence of a pressure‐induced cubic BN phase, and its metastability upon release of pressure. Å‐indentation experiments and simulations show that at pressures of 2–4 GPa, the indentation stiffness of monolayer h‐BN on SiO2 is the same of bare SiO2, whereas for two‐ and three‐layer‐thick h‐BN on SiO2 the stiffness increases of up to 50% compared to bare SiO2, and then it decreases when increasing the number of layers. Up to 4 GPa, the reduced strain in the layers closer to the substrate decreases the probability of the sp2‐to‐sp3 phase transition, explaining the lower stiffness observed in thicker h‐BN. read less USED (low confidence) J. Zhang et al., “Point defects in two-dimensional hexagonal boron nitride: A perspective,” Journal of Applied Physics. 2020. link Times cited: 38 Abstract: Two-dimensional (2D) hexagonal boron nitride (h-BN) is one o… read moreAbstract: Two-dimensional (2D) hexagonal boron nitride (h-BN) is one of the most promising materials for many technological applications ranging from optics to electronics. In past years, a property-tunable strategy that involves the construction of electronic structures of h-BN through an atomic-level design of point defects has been in vogue. The point defects imported during material synthesis or functionalization by defect engineering can endow h-BN with new physical characteristics and applications. In this Perspective, we survey the current state of the art in multifunction variations induced by point defects for 2D h-BN. We begin with an introduction of the band structure and electronic property of the pristine h-BN. Subsequently, the formation and characterization of the most obvious point defects and their modulation in electronic structures of h-BN nanomaterials are envisaged in theory. The experimental results obtained by atom-resolved transmission electron microscopy, magnetic measurement, and optical measurements have provided insights into the point defect engineered structures and their corresponding emerging properties. Finally, we highlight the perspectives of h-BN nanomaterials for heterostructures and devices. This Perspective provides a landscape of the point defect physics involved to demonstrate the modulation of the structure and functionalities in h-BN and identify the roadmap for heterostructure and device applications, which will make advances in electronics, spintronics, and nanophotonics. read less USED (low confidence) Y. Han et al., “Large Elastic Deformation and Defect Tolerance of Hexagonal Boron Nitride Monolayers.” 2020. link Times cited: 24 USED (low confidence) R. Shankar, S. Marchesini, E. A. Müller, and C. Petit, “Gas Adsorption in Amorphous Porous Boron Oxynitride: Grand Canonical Monte Carlo Simulations and Experimental Determination,” ChemRxiv. 2020. link Times cited: 1 Abstract: Note: The authors realised errors in the calculations relate… read moreAbstract: Note: The authors realised errors in the calculations related to this study, which impact the conclusions of the work previously posted. read less USED (low confidence) S. Gupta, R. Sachan, and J. Narayan, “Nanometer-Thick Hexagonal Boron Nitride Films for 2D Field-Effect Transistors.” 2020. link Times cited: 3 Abstract: Hexagonal Boron Nitride (h-BN) is attracting significant att… read moreAbstract: Hexagonal Boron Nitride (h-BN) is attracting significant attention as an ultimate dielectric and active layer in multifunctional 2D heterostructured devices due to the high bandgap and pliability t... read less USED (low confidence) S. Hong et al., “Ultralow-dielectric-constant amorphous boron nitride,” Nature. 2020. link Times cited: 129 USED (low confidence) I. Shepelev, A. Chetverikov, S. Dmitriev, and E. Korznikova, “Shock waves in graphene and boron nitride,” Computational Materials Science. 2020. link Times cited: 30 USED (low confidence) Y. A. Korkmaz, C. Bulutay, and C. Sevik, “Defect states in monolayer hexagonal BN: A comparative DFT and DFT-1/2 study,” Physica B-condensed Matter. 2020. link Times cited: 3 USED (low confidence) A. Mauri and M. Katsnelson, “Scaling behavior of crystalline membranes: An ε-expansion approach,” Nuclear Physics B. 2020. link Times cited: 17 USED (low confidence) S. Daneshnia, M. Adeli, and Y. Mansourpanah, “Gram Scale and Room Temperature Functionalization of Boron Nitride Nanosheets for Water Treatment,” Nano. 2019. link Times cited: 5 Abstract: Two-dimensional hexagonal boron nitride is a fascinating nan… read moreAbstract: Two-dimensional hexagonal boron nitride is a fascinating nanomaterial with a broad range of potential applications. However, further development of this nanomaterial is hampered because of its poor functionality and low processability. One of the efficient strategies for improving the processability of two-dimensional hexagonal boron nitride is the covalent functionalization of this nanomaterial. In this study, we report on a straightforward approach for functionalization of two-dimensional hexagonal boron nitride by lithium cyclopentadienyl and its application for water treatment. Cyclopentadienyl-functionalized boron nitride was characterized by different spectroscopy and microscopy methods as well as thermal and BET analysis. The synthesized nanomaterial was able to efficiently remove methylene blue from water in a short time. Adsorption capacity of this nanomaterial was as high as 476.3[Formula: see text]mg/g, which was superior to the nonfunctionalized boron nitride. Our results showed that cyclopentadienyl-functionalized boron nitride is a promising candidate for the removal of cationic pollutants from water. read less USED (low confidence) J. Li, J. Chen, M. Zhu, H. Song, and H. Zhang, “Interfacial Characteristics of Boron Nitride Nanosheet/Epoxy Resin Nanocomposites: A Molecular Dynamics Simulation,” Applied Sciences. 2019. link Times cited: 20 Abstract: The interface between nanofillers and matrix plays a key rol… read moreAbstract: The interface between nanofillers and matrix plays a key role in determining the properties of nanocomposites, but the interfacial characteristics of nanocomposites such as molecular structure and interaction strength are not fully understood yet. In this work, the interfacial features of a typical nanocomposite, namely epoxy resin (EP) filled with boron nitride nanosheet (BNNS) are investigated by utilizing molecular dynamics simulation, and the effect of surface functionalization is analyzed. The radial distribution density (RDD) and interfacial binding energy (IBE) are used to explore the structure and bonding strength of nanocomposites interface. Besides, the interface compatibility and molecular chain mobility (MCM) of BNNS/EP nanocomposites are analyzed by cohesive energy density (CED), free volume fraction (FFV), and radial mean square displacement (RMSD). The results indicate that the interface region of BNNS/EP is composed of three regions including compact region, buffer region, and normal region. The structure at the interfacial region of nanocomposite is more compact, and the chain mobility is significantly lower than that of the EP away from the interface. Moreover, the interfacial interaction strength and compatibility increase with the functional density of BNNS functionalized by CH3–(CH2)4–O– radicals. These results adequately illustrate interfacial characteristics of nanocomposites from atomic level. read less USED (low confidence) M. Khoshbaten and S. E. Hosseini, “Design and AC Modeling of a Bipolar GNR-h-BN RTD With Enhanced Tunneling Properties and High Robustness to Edge Defects,” IEEE Transactions on Electron Devices. 2019. link Times cited: 2 Abstract: This paper proposes a robust to defects and short length dev… read moreAbstract: This paper proposes a robust to defects and short length device (RDSLD), a newly in-plane resonant tunneling diode (RTD), and its ac-modeling with the minimum length of 3 nm. The proposed structure has robust performance in the presence of defects. It also has a high degree of flexibility in tuning electronic specifications. By using bipolar doping and a special h-boron nitride barrier pattern, these unique features are obtained. The simulation results verify that the proposed structure has the potential for replacing conventional RTD diodes. Such that the peak-to-valley ratio (PVR) and the maximum current of 4500, 450 nA for perfect bowtie and 3.45, 1256 nA for rhombic barrier shape structure are obtained, respectively. Also, negative differential resistance (NDR) is observed in all of the structures with vacancy and impurity defects. The effect of the geometrical parameters on the charge transmission of the device is another issue that is addressed in this paper. Furthermore, the analytical and numerical capacitance model parameters are presented. read less USED (low confidence) Y. Li, P. Chen, C. Zhang, J. Peng, F. Gao, and H. Liu, “Molecular dynamics simulation on the buckling of single-layer MoS2 sheet with defects under uniaxial compression,” Computational Materials Science. 2019. link Times cited: 22 USED (low confidence) T. Ahmed, A. Procak, T. Hao, and Z. Hossain, “Strong anisotropy in strength and toughness in defective hexagonal boron nitride,” Physical Review B. 2019. link Times cited: 14 USED (low confidence) P. F. Achari, K. K. Bejagam, S. Singh, and S. A. Deshmukh, “Development of non-bonded interaction parameters between hexagonal boron-nitride and water,” Computational Materials Science. 2019. link Times cited: 8 USED (low confidence) H. Pan et al., “Tensile strain effects on C4N3H monolayer: Large Poisson’s ratio and robust Dirac cone,” Applied Physics Letters. 2019. link Times cited: 4 Abstract: Recently, a novel two-dimensional (2D) metal-free organic ma… read moreAbstract: Recently, a novel two-dimensional (2D) metal-free organic material, the C4N3H monolayer, has been proposed and predicted to be a 2D Dirac material with high Fermi velocities. Herein, we investigated its mechanical properties and tensile strain effects on its electronic properties based on first-principles calculations. We demonstrated that this material is quite soft with small stiffness constants and can sustain large strains. Compared to many other 2D materials, this material presents a remarkable elastic anisotropy and a large Poisson's ratio, which are very important for strain engineering. We also found that the Dirac cone of this material is very robust against the tensile strains and the Fermi velocity is high. The small stiffness constant, large Poisson's ratio, robust Dirac cone, and high Fermi velocity make the C4N3H monolayer a promising material in high-speed flexible electronic devices.Recently, a novel two-dimensional (2D) metal-free organic material, the C4N3H monolayer, has been proposed and predicted to be a 2D Dirac material with high Fermi velocities. Herein, we investigated its mechanical properties and tensile strain effects on its electronic properties based on first-principles calculations. We demonstrated that this material is quite soft with small stiffness constants and can sustain large strains. Compared to many other 2D materials, this material presents a remarkable elastic anisotropy and a large Poisson's ratio, which are very important for strain engineering. We also found that the Dirac cone of this material is very robust against the tensile strains and the Fermi velocity is high. The small stiffness constant, large Poisson's ratio, robust Dirac cone, and high Fermi velocity make the C4N3H monolayer a promising material in high-speed flexible electronic devices. read less USED (low confidence) O. Kaya and N. Donmezer, “Investigation of the Thermal Transport Properties Across Van der Waals Interfaces of 2D Materials,” IEEE Transactions on Nanotechnology. 2022. link Times cited: 0 Abstract: Two-dimensional (2D) materials have attracted extensive rese… read moreAbstract: Two-dimensional (2D) materials have attracted extensive research interest in various applications in recent years due to their superior thermal, electrical, and optical properties, making them preferable for potential electronic and optoelectronic applications. These 2D materials form Van der Waals interfaces with common substrate materials due to fabrication and/or device requirements. Since the generated heat during the operation of the devices cause degradation and reliability concerns, interface thermal boundary conductance (TBCs) and in-plane thermal conductivities of the interfaces should be well understood for proper thermal management. Herein, we investigate the TBC and in-plane thermal conductivities of the Van der Waals interfaces of 2D materials by approach to-equilibrium molecular dynamics (AEMD) and non-equilibrium molecular dynamics (NEMD) simulations. Our results show that the TBC is higher for the interfaces with stronger phonon DOS and lattice match. Also, the increasing number of 2D material layers increases the TBC of the interface. The results also showed that the thermal conductivity of the materials forming the interface could affect each other's in-plane thermal conductivity. Changes in thermal conductivities of individual in-plane thermal conductivities can be as high as 70%. Change in thermal conductivity depends on the difference in thermal conductivities of materials in contact and only visible in the vicinity of the interface. Thermal management strategies should pay attention to the trade-off between the changes in individual thermal conductivities and TBC of the interfaces. read less USED (low confidence) K. Abgaryan and A. V. Grevtsev, “Parametric Identification of Tersoff Potential for Two-Component Materials.” 2020. link Times cited: 2 NOT USED (low confidence) G. Wang et al., “Recent advances in the mechanics of 2D materials,” International Journal of Extreme Manufacturing. 2023. link Times cited: 7 Abstract: The exceptional physical properties and unique layered struc… read moreAbstract: The exceptional physical properties and unique layered structure of two-dimensional (2D) materials have made this class of materials great candidates for applications in electronics, energy conversion/storage devices, nanocomposites, and multifunctional coatings, among others. At the center of this application space, mechanical properties play a vital role in materials design, manufacturing, integration and performance. The emergence of 2D materials has also sparked broad scientific inquiry, with new understanding of mechanical interactions between 2D structures and interfaces being of great interest to the community. Building on the dramatic expansion of recent research activities, here we review significant advances in the understanding of the elastic properties, in-plane failures, fatigue performance, interfacial shear/friction, and adhesion behavior of 2D materials. In this article, special emphasis is placed on some new 2D materials, novel characterization techniques and computational methods, as well as insights into deformation and failure mechanisms. A deep understanding of the intrinsic and extrinsic factors that govern 2D material mechanics is further provided, in the hopes that the community may draw design strategies for structural and interfacial engineering of 2D material systems. We end this review article with a discussion of our perspective on the state of the field and outlook on areas for future research directions. read less NOT USED (low confidence) Z. Fu et al., “A mini review on oxidative dehydrogenation of propane over boron nitride catalysts,” Petroleum Science. 2023. link Times cited: 0 NOT USED (low confidence) S. Ghazarian, Z. Kalantar, and S. M. Hashemianzadeh, “An exploration of efficiency of proposed drug delivery system including BNNT, C48N12, and TMZ in treating of glioblastoma through classical molecular dynamics,” Journal of Molecular Liquids. 2023. link Times cited: 1 NOT USED (low confidence) M. Mehrabani, M. M. Khatibi, S. Sadeghzadeh, and M. Ashory, “Tailoring the effects of interface physics on the free vibration of graphene-boron nitride heterostructure,” Diamond and Related Materials. 2022. link Times cited: 0 NOT USED (low confidence) S. Attarian and S. Xiao, “Development of a 2NN-MEAM potential for Ti B system and studies of the temperature dependence of the nanohardness of TiB2,” Computational Materials Science. 2022. link Times cited: 3 NOT USED (low confidence) J. Ren and P. Innocenzi, “2D Boron Nitride Heterostructures: Recent Advances and Future Challenges,” Small Structures. 2021. link Times cited: 23 Abstract: Hexagonal boron nitride (h‐BN) is one of the most attractive… read moreAbstract: Hexagonal boron nitride (h‐BN) is one of the most attractive 2D materials because of its remarkable properties. Combining h‐BN with other components (e.g., graphene, carbonitride, semiconductors) to form heterostructures opens new perspectives to developing advanced functional devices. In this review, the state‐of‐the‐art in h‐BN heterojunctions is highlighted. The preparation of high‐quality 2D h‐BN structures with fewer defects can maximize its intrinsic properties, such as thermal conductivity and electrical insulation, which are particularly important in 2D van der Waals electronics. On the other hand, the controlled introduction in 2D h‐BN of multiple defects creates new properties and advanced functions. In this last case, only through a better understanding of the nature and function of defects, it is possible to develop advanced applications based on h‐BN heterostructures. Engineering of the heterojunctions, such as the design of bonding at the interfaces, also plays a primary role. Several applications are proposed for h‐BN heterostructures, mostly in sensing and photocatalysis, and some new perspectives worth further studies are opened. Finally, the current challenges and the rising opportunities for the future developments of next‐generation h‐BN heterostructures are discussed. read less NOT USED (low confidence) M. Z. Dehaghani et al., “Theoretical Encapsulation of Fluorouracil (5-FU) Anti-Cancer Chemotherapy Drug into Carbon Nanotubes (CNT) and Boron Nitride Nanotubes (BNNT),” Molecules. 2021. link Times cited: 18 Abstract: Introduction: Chemotherapy with anti-cancer drugs is conside… read moreAbstract: Introduction: Chemotherapy with anti-cancer drugs is considered the most common approach for killing cancer cells in the human body. However, some barriers such as toxicity and side effects would limit its usage. In this regard, nano-based drug delivery systems have emerged as cost-effective and efficient for sustained and targeted drug delivery. Nanotubes such as carbon nanotubes (CNT) and boron nitride nanotubes (BNNT) are promising nanocarriers that provide the cargo with a large inner volume for encapsulation. However, understanding the insertion process of the anti-cancer drugs into the nanotubes and demonstrating drug-nanotube interactions starts with theoretical analysis. Methods: First, interactions parameters of the atoms of 5-FU were quantified from the DREIDING force field. Second, the storage capacity of BNNT (8,8) was simulated to count the number of drugs 5-FU encapsulated inside the cavity of the nanotubes. In terms of the encapsulation process of the one drug 5-FU into nanotubes, it was clarified that the drug 5-FU was more rapidly adsorbed into the cavity of the BNNT compared with the CNT due to the higher van der Waals (vdW) interaction energy between the drug and the BNNT. Results: The obtained values of free energy confirmed that the encapsulation process of the drug inside the CNT and BNNT occurred spontaneously with the free energies of −14 and −25 kcal·mol−1, respectively. Discussion: However, the lower value of the free energy in the system containing the BNNT unraveled more stability of the encapsulated drug inside the cavity of the BNNT comparing the system having CNT. The encapsulation of Fluorouracil (5-FU) anti-cancer chemotherapy drug (commercial name: Adrucil®) into CNT (8,8) and BNNT (8,8) with the length of 20 Å in an aqueous solution was discussed herein applying molecular dynamics (MD) simulation. read less NOT USED (low confidence) S. Singh, “Critical assessment of the interatomic potentials for the elastic properties of the noncarbon monolayer nanomaterials,” Computational Materials Science. 2020. link Times cited: 4 NOT USED (low confidence) Y. Chen, H. Qin, J. Song, Z. Liu, Y. Liu, and Q. Pei, “Exploring the structure-property relationship of three-dimensional hexagonal boron nitride aerogels with gyroid surfaces.,” Nanoscale. 2020. link Times cited: 5 Abstract: Three-dimensional hexagonal boron nitride aerogels (hBNAGs) … read moreAbstract: Three-dimensional hexagonal boron nitride aerogels (hBNAGs) are novel porous materials with many promising applications such as energy storage, thermal insulation and sensing. However, the structure-property relationships of hBNAGs in complicated thermo-mechanical coupled environments are still not clear. In this study, we employed a binary phase-field crystal (PFC) model to construct the atomic structures of hBNAGs, upon which the mechanical and thermal behaviors of hBNAGs were systematically investigated using large-scale atomistic simulations. It is found that the hBNAG geometry and topological defects strongly affect the mechanical and thermal properties. For example, the Young's modulus and tensile strength follow the scaling laws of mass density with a power factor of about 1.4 and 1.2, respectively, indicating that the stretching and bending combine toward tensile deformation. In addition, cracks nucleate around the octagon defects, indicating that the tensile strength is also influenced by the topological defects. Under compression, complicated crumpled deformations and ridges in the entire region are observed and the compression strength follows the scaling law of mass density with a power factor above 2.0, which means that a large portion of the hBNAGs do not contribute to the compression load bearing. We find that hBNAGs have a very low thermal conductivity of about two orders of magnitude lower than that of a hBN sheet. Also, the thermal conductivity of hBNAGs increases with increasing mass density, which also follows a scaling law. The power of the scaling law is about 0.5, indicating that the thermal conductivity has a strong nonlinear dependence on the mass density. Our work provides a deep understanding of the structure-property relationships of hBNAGs, which is useful for the engineering applications of hBNAGs. read less NOT USED (high confidence) Y.-T. Zhang, Y.-P. Wang, X.-L. Zhang, Y. Zhang, S. Du, and S. Pantelides, “Structure of Amorphous Two-Dimensional Materials: Elemental Monolayer Amorphous Carbon versus Binary Monolayer Amorphous Boron Nitride.,” Nano letters. 2021. link Times cited: 8 Abstract: The structure of amorphous materials has been debated since … read moreAbstract: The structure of amorphous materials has been debated since the 1930s as a binary question: amorphous materials are either Zachariasen continuous random networks (Z-CRNs) or Z-CRNs containing crystallites. It was recently demonstrated, however, that amorphous diamond can be synthesized in either form. Here we address the question of the structure of single-atom-thick amorphous monolayers. We reanalyze the results of prior simulations for amorphous graphene and report kinetic Monte Carlo simulations based on alternative algorithms. We find that crystallite-containing Z-CRN is the favored structure of elemental amorphous graphene, as recently fabricated, whereas the most likely structure of binary monolayer amorphous BN is altogether different than either of the two long-debated options: it is a compositionally disordered "pseudo-CRN" comprising a mix of B-N and noncanonical B-B and N-N bonds and containing "pseudocrystallites", namely, honeycomb regions made of noncanonical hexagons. Implications for other nonelemental 2D and bulk amorphous materials are discussed. read less NOT USED (high confidence) P. Zeiger and J. Rusz, “Simulations of spatially and angle-resolved vibrational electron energy loss spectroscopy for a system with a planar defect,” Physical Review B. 2021. link Times cited: 3 Abstract: Recent developments in experiments with vibrational electron… read moreAbstract: Recent developments in experiments with vibrational electron energy loss spectroscopy (EELS) have revealed spectral shape variations at spatial resolutions down to sub-atomic scale. Interpretation in terms of local phonon density of states enables their qualitative understanding, yet a more detailed analysis is calling for advances in theoretical methods. In Zeiger and Rusz, Phys. Rev. Lett. 124, 025501 (2020) we have presented a frequency resolved frozen phonon multislice method for simulations of vibrational EELS. Detailed simulations for a plane wave electron beam scattering on a vibrating hexagonal boron nitride are presented in a companion manuscript (Zeiger and Rusz, arXiv:2104.03197). Here we present simulations of vibrational EELS assuming a convergent electron probe of nanometer size and atomic size on a hexagonal boron nitride structure model with a planar defect. With a nanometer beam we observe spectral shape modifications in the presence of the defect, which are correlated with local changes of the phonon density of states. With an atomic size electron beam, we observe the same, although with better contrast. In addition, we observe atomic level contrast and sub-atomic scale spectral shape modifications, which are particularly strong for small detector collection angles. read less NOT USED (high confidence) Y. Fan, W. Wang, Z. Hao, and H. Yuan, “Effect of Workpiece Atom Diffusion Into CBN Tool on Its Mechanical Properties in Cutting Ni–Fe–Cr Alloy Based on Molecular Dynamics Simulation,” International Journal of Precision Engineering and Manufacturing. 2021. link Times cited: 2 NOT USED (high confidence) M. Fischer et al., “Controlled generation of luminescent centers in hexagonal boron nitride by irradiation engineering,” Science Advances. 2021. link Times cited: 39 Abstract: Irradiation engineering on hexagonal boron nitride reveals i… read moreAbstract: Irradiation engineering on hexagonal boron nitride reveals insights into the microscopic nature of quantum emitters. Luminescent centers in the two-dimensional material hexagonal boron nitride have the potential to enable quantum applications at room temperature. To be used for applications, it is crucial to generate these centers in a controlled manner and to identify their microscopic nature. Here, we present a method inspired by irradiation engineering with oxygen atoms. We systematically explore the influence of the kinetic energy and the irradiation fluence on the generation of luminescent centers. We find modifications of their density for both parameters, while a fivefold enhancement is observed with increasing fluence. Molecular dynamics simulations clarify the generation mechanism of these centers and their microscopic nature. We infer that VNCB and VB− are the most likely centers formed. Ab initio calculations of their optical properties show excellent agreement with our experiments. Our methodology generates quantum emitters in a controlled manner and provides insights into their microscopic nature. read less NOT USED (high confidence) A. Savin, “Eigenmodes and resonance vibrations of 2D nanomembranes – Graphene and hexagonal boron-nitride.” 2021. link Times cited: 1 Abstract: Natural and resonant oscillations of suspended circular grap… read moreAbstract: Natural and resonant oscillations of suspended circular graphene and hexagonal boron nitride (hBN) membranes (single-layer sheets lying on a flat substrate having a circular hole of radius R) have been simulated using full-atomic models. Substrates formed by flat surfaces of graphite and h-BN crystal, hexagonal ice, silicon carbide 6H-SiC and nickel surface (111) have been used. The presence of the substrate leads to the forming of a gap at the bottom of the frequency spectrum of transversal vibrations of the sheet. The frequencies of natural oscillations of the membrane (oscillations localized on the suspended section of the sheet) always lie in this gap, and the frequencies of oscillations decrease by increasing radius of the membrane as (R + Ri) −2 with nonezero effective increase of radius Ri > 0. The modeling of the sheet dynamics has shown that small periodic transversal displacements of the substrate lead to resonant vibrations of the membranes at frequencies close to eigenfrequencies of nodeless vibrations of membranes with a circular symmetry. The energy distribution of resonant vibrations of the membrane has a circular symmetry and several nodal circles, whose number i coincides with the number of the resonant frequency. The frequencies of the resonances decrease by increasing the radius of the membrane as (R + Ri) αi with exponent αi < 2. The lower rate of resonance frequency decrease is caused by the anharmonicity of membrane vibrations. read less NOT USED (high confidence) T. Hao, Z. Zhang, T. Ahmed, J. Xu, S. Brown, and Z. Hossain, “Line-defect orientation- and length-dependent strength and toughness inhBN,” Journal of Applied Physics. 2021. link Times cited: 1 Abstract: Applying classical molecular dynamics simulations, we report… read moreAbstract: Applying classical molecular dynamics simulations, we report the effects of length ( λ) and orientation ( θ) of a line-defect on strength and toughness in defective 2D hexagonal boron nitride. Results reveal the existence of a “transition angle,” θ t = 2.47 °, at which both toughness and strength are insensitive to the finite length of the defect in an infinite domain. For θ θ t, they show the opposite behavior. Examination of the stress-fields shows that θ-dependent variation in stress-localization at the edges of the line-defect and symmetry-breaking of the stress-fields with respect to the defect-axis govern the disparate θ-dependent behavior. For θ θ t, the stress-intensity at the edges is strongly localized at the opposite sides of the line-defect. The stress-intensity increases asymptotically with the increasing defect-length and reduces the strength and toughness of the defective lattice. The stress-localization, however, saturates at a “saturation angle” of around 60 ° for strength and 30 ° for toughness. Additionally, there exists a critical defect-length λ c = 60 A, below which there is a strong θ-dependent variation in elastic interactions between the edges, affecting strength and toughness substantially. For λ > λ c, the elastic interactions saturate and make both strength and toughness insensitive to the change in the length of the defect. read less NOT USED (high confidence) N. Walet and F. Guinea, “Flat bands, strains, and charge distribution in twisted bilayer
h−BN,” Physical Review B. 2020. link Times cited: 12 Abstract: We study the effect of twisting on bilayer graphene. The eff… read moreAbstract: We study the effect of twisting on bilayer graphene. The effect of lattice relaxation is included; we look at the electronic structure, piezo-electric charges and spontaneous polarisation. We show that the electronic structure without lattice relaxation shows a set of extremely flat in-gap states similar to Landau-levels, where the spacing scales with twist angle. With lattice relaxation we still have flat bands, but now the spectrum becomes independent of twist angle for sufficiently small angles. We describe in detail the nature of the bands, and study appropriate continuum models, at the same time explaining the spectrum We find that even though the spectra for both parallel an anti-parallel alignment are very similar, the spontaneous polarisation effects only occur for parallel alignment. We argue that this suggests a large interlayer hopping between boron and nitrogen. read less NOT USED (high confidence) H. Tian, F. Pan, and B. Zhang, “Crack kinking in h-BN monolayer predicted by energy dissipation,” Journal of Applied Physics. 2020. link Times cited: 0 Abstract: Rapid crack propagation in a strip of a hexagonal boron nitr… read moreAbstract: Rapid crack propagation in a strip of a hexagonal boron nitride monolayer is studied by molecular dynamics. Crack kinking/branching takes place at high velocities under displacement loadings, accompanied by elastic waves dissipating the external supplied work besides the fresh surface energy. Cracks moving at a maximum velocity (∼74% of the Rayleigh wave velocity) do not branch immediately, which is governed by energy dissipation around the crack tip, instead, once the energy release rate (G) reaches a critical value of 19.75 J/m2 (∼5.9 times the surface energy density of 3.35 J/m2), kinking occurs, which shows that G could predict the onset of kinking/branching accurately. The dependences of G for crack initiation and branching on displacement-loading rate, strip size, and initial crack length are examined as well. read less NOT USED (high confidence) F. Thiemann, P. Rowe, E. A. Müller, and A. Michaelides, “Machine Learning Potential for Hexagonal Boron Nitride Applied to Thermally and Mechanically Induced Rippling,” The Journal of Physical Chemistry C. 2020. link Times cited: 18 Abstract: We introduce an interatomic potential for hexagonal boron ni… read moreAbstract: We introduce an interatomic potential for hexagonal boron nitride (hBN) based on the Gaussian approximation potential (GAP) machine learning methodology. The potential is based on a training set of... read less NOT USED (high confidence) A. Mauri, D. Soriano, and M. Katsnelson, “Thermal ripples in bilayer graphene,” Physical Review B. 2020. link Times cited: 2 Abstract: We study thermal fluctuations of a free-standing bilayer gra… read moreAbstract: We study thermal fluctuations of a free-standing bilayer graphene subject to vanishing external tension. Within a phenomenological theory, the system is described as a stack of two continuum crystalline membranes, characterized by finite elastic moduli and a nonzero bending rigidity. A nonlinear rotationally-invariant model guided by elasticity theory is developed to describe interlayer interactions. After neglection of in-plane phonon nonlinearities and anharmonic interactions involving interlayer shear and compression modes, an effective theory for soft flexural fluctuations of the bilayer is constructed. The resulting model has the same form of a well-known effective theory for out-of-plane fluctuations in a single-layer membrane, but with a strongly wave-vector dependent bare bending rigidity. Focusing on AB-stacked bilayer graphene, parameters governing interlayer interactions in the theory are derived by first-principles calculations. Statistical-mechanical properties of interacting flexural fluctuations are then calculated by a numerical iterative solution of field-theory integral equations within the self-consistent screening approximation (SCSA). The bare bending rigidity in the considered model exhibits a crossover between a long-wavelength regime governed by in-plane elastic stress and a short wavelength region controlled by monolayer curvature stiffness. Interactions between flexural fluctuations drive a further crossover between a harmonic and a strong-coupling regime, characterized by anomalous scale invariance. The overlap and interplay between these two crossover behaviors is analyzed at varying temperatures. read less NOT USED (high confidence) T. Hao, T. Ahmed, R. J. Mou, J. Xu, S. Brown, and Z. Hossain, “Critical inter-defect distance that modulates strength and toughness in defective 2D sp2-lattice,” Journal of Applied Physics. 2020. link Times cited: 4 Abstract: This paper reveals the existence of a critical separation di… read moreAbstract: This paper reveals the existence of a critical separation distance ( d c) beyond which the elastic interactions between a pair of monovacancies in graphene or hexagonal boron nitride become inconsequential for the strength and toughness of the defective lattice. This distance is independent of the chirality of the lattice. For any inter-defect distance higher than d c, the lattice behaves mechanically as if there is a single defect. For a distance less than d c, the defect–defect elastic interactions produce distinctive mechanical behavior depending on the orientation ( θ) of the defect pair relative to the loading direction. Both strength and toughness of the lattice containing a pair of “interacting monovacancies (iMVs)” are either higher or smaller than that of the lattice containing a pair of “non-interacting monovacancies (nMVs),” suggesting the existence of a critical orientation angle θ c. For θ < θ c, the smaller the distance between the iMVs, the higher the toughness and strength compared to the lattice containing nMVs, whereas, for θ ≥ θ c, the smaller the separation distance between the iMVs, the smaller the toughness and strength compared to the lattice containing nMVs. The transitional behavior has a negligible dependence on the chirality of the lattice, which indicates that the crystallographic anisotropy has a much weaker influence on toughness and strength compared to the anisotropy induced by the orientation angle itself. These observations underline an important point that the elastic fields emanating from vacancy defects are highly localized and fully contained within a small region of around 1.5 nm radius. read less NOT USED (high confidence) Y. Nan, D. Tan, J. Zhao, M. Willatzen, and Z. L. Wang, “Shape- and size dependent piezoelectric properties of monolayer hexagonal boron nitride nanosheets,” Nanoscale Advances. 2019. link Times cited: 8 Abstract: We use molecular dynamics simulations (MD) to study piezoele… read moreAbstract: We use molecular dynamics simulations (MD) to study piezoelectric properties of hexagonal boron nitride nanosheets (BNNS) and reveal how piezoelectric properties depend on size and shape. We first analyze how the macroscopic shape affects the full 2D structure symmetry and its piezoelectric tensor. In particular, we demonstrate that a hexagonal (rectangular)-shaped BNNS belongs to the hexagonal 6̄m2 (monoclinic m) point group. Our simulation results show that the piezoelectric constants of BNNS depend strongly on the macroscopic shape, in agreement with the symmetry of the structure, but are nearly independent of the macroscopic size. The present study provides a detailed understanding of the piezoelectric properties of finite size BNNS and guidance to future experiments and optimization of 2D piezoelectric materials in general. read less NOT USED (high confidence) Z. Fan, Y. Wang, X. Gu, P. Qian, Y. Su, and T. Ala‐Nissila, “A minimal Tersoff potential for diamond silicon with improved descriptions of elastic and phonon transport properties,” Journal of Physics: Condensed Matter. 2019. link Times cited: 10 Abstract: Silicon is an important material and many empirical interato… read moreAbstract: Silicon is an important material and many empirical interatomic potentials have been developed for atomistic simulations of it. Among them, the Tersoff potential and its variants are the most popular ones. However, all the existing Tersoff-like potentials fail to reproduce the experimentally measured thermal conductivity of diamond silicon. Here we propose a modified Tersoff potential and develop an efficient open source code called GPUGA (graphics processing units genetic algorithm) based on the genetic algorithm and use it to fit the potential parameters against energy, virial and force data from quantum density functional theory calculations. This potential, which is implemented in the efficient open source GPUMD (graphics processing units molecular dynamics) code, gives significantly improved descriptions of the thermal conductivity and phonon dispersion of diamond silicon as compared to previous Tersoff potentials and at the same time well reproduces the elastic constants. Furthermore, we find that quantum effects on the thermal conductivity of diamond silicon at room temperature are non-negligible but small: using classical statistics underestimates the thermal conductivity by about 10% as compared to using quantum statistics. read less NOT USED (high confidence) Z. Wang, “Gear junctions between chiral boron nitride nanotubes,” Physical Review B. 2019. link Times cited: 3 Abstract: A gear effect is demonstrated at parallel and cross junction… read moreAbstract: A gear effect is demonstrated at parallel and cross junctions between boron nitride nanotubes (BNNTs) via atomistic simulations. The atoms of neighboring BNNTs are meshed together at the junctions like gear teeth through long-range non-covalent interaction, which are shown to be able to transmit motion and power. The sliding motion of a BNNT can be spontaneously translated to rotating motion of an adjoining one or viceversa at a well-defined speed ratio. The transmittable motion and force strongly depend on the helical lattice structure of BNNTs represented by a chiral angle. The motion transmission efficiency of the parallel junctions increases up to a maximum for certain BNNTs depending on displacement rates. It then decreases with increasing chiral angles. For cross junctions, the angular motion transmission ratio increases with decreasing chiral angles of the driven BNNTs, while the translational one exhibits the opposite trend. read less NOT USED (high confidence) T. Ahmed, Z. Zhang, C. McDermitt, and Z. Hossain, “Strength and toughness anisotropy in hexagonal boron nitride: An atomistic picture,” Journal of Applied Physics. 2018. link Times cited: 13 Abstract: Strength and toughness are two crucial mechanical properties… read moreAbstract: Strength and toughness are two crucial mechanical properties of a solid that determine its ability to function reliably without undergoing failure in extreme conditions. While hexagonal boron nitride (hBN) is known to be elastically isotropic in the linear regime of mechanical deformation, its directional response to extreme mechanical loading remains less understood. Here, using a combination of density functional theory calculations and molecular dynamics simulations, we show that strength and crack nucleation toughness of pristine hBN are strongly anisotropic and chirality dependent. They vary nonlinearly with the chirality of the lattice under symmetry breaking deformation, and the anisotropic behavior is retained over a large temperature range with a decreasing trend at higher temperatures. An atomistic analysis reveals that bond deformation and associated distortion of electron density are nonuniform in the nonlinear regime of mechanical deformation, irrespective of the loading direction. This nonuniformity forms the physical basis for the observed anisotropy under static conditions, whereas reduction in nonuniformity and thermal softening reduce anisotropy at higher temperatures. The chirality-dependent anisotropic effects are well predicted by inverse cubic polynomials.Strength and toughness are two crucial mechanical properties of a solid that determine its ability to function reliably without undergoing failure in extreme conditions. While hexagonal boron nitride (hBN) is known to be elastically isotropic in the linear regime of mechanical deformation, its directional response to extreme mechanical loading remains less understood. Here, using a combination of density functional theory calculations and molecular dynamics simulations, we show that strength and crack nucleation toughness of pristine hBN are strongly anisotropic and chirality dependent. They vary nonlinearly with the chirality of the lattice under symmetry breaking deformation, and the anisotropic behavior is retained over a large temperature range with a decreasing trend at higher temperatures. An atomistic analysis reveals that bond deformation and associated distortion of electron density are nonuniform in the nonlinear regime of mechanical deformation, irrespective of the loading direction. This nonun... read less NOT USED (high confidence) V. Vijayaraghavan and L. Zhang, “Effective Mechanical Properties and Thickness Determination of Boron Nitride Nanosheets Using Molecular Dynamics Simulation,” Nanomaterials. 2018. link Times cited: 37 Abstract: Research in boron nitride nanosheets (BNNS) has evoked signi… read moreAbstract: Research in boron nitride nanosheets (BNNS) has evoked significant interest in the field of nano-electronics, nanoelectromechanical (NEMS) devices, and nanocomposites due to its excellent physical and chemical properties. Despite this, there has been no reliable data on the effective mechanical properties of BNNS, with the literature reporting a wide scatter of strength data for the same material. To address this challenge, this article presents a comprehensive analysis on the effect of vital factors which can result in variations of the effective mechanical properties of BNNS. Additionally, the article also presents the computation of the correct wall thickness of BNNS from elastic theory equations, which is an important descriptor for any research to determine the mechanical properties of BNNS. It was predicted that the correct thickness of BNNS should be 0.106 nm and the effective Young’s modulus to be 2.75 TPa. It is anticipated that the findings from this study could provide valuable insights on the true mechanical properties of BNNS that could assist in the design and development of efficient BN-based NEMS devices, nanosensors, and nanocomposites. read less |