Citations
This panel presents information regarding the papers that have cited the interatomic potential (IP) whose page you are on.
The OpenKIM machine learning based Deep Citation framework is used to determine whether the citing article actually used the IP in computations (denoted by "USED") or only provides it as a background citation (denoted by "NOT USED"). For more details on Deep Citation and how to work with this panel, click the documentation link at the top of the panel.
The word cloud to the right is generated from the abstracts of IP principle source(s) (given below in "How to Cite") and the citing articles that were determined to have used the IP in order to provide users with a quick sense of the types of physical phenomena to which this IP is applied.
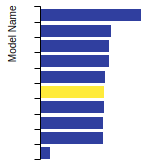
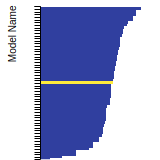
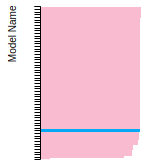
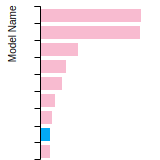
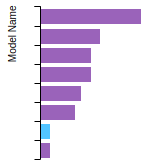
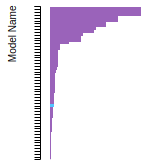
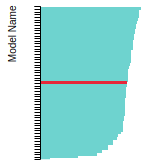
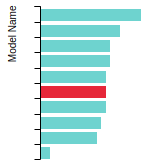
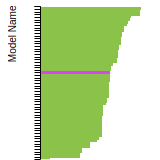
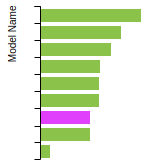
The bar chart shows the number of articles that cited the IP per year. Each bar is divided into green (articles that USED the IP) and blue (articles that did NOT USE the IP).
Users are encouraged to correct Deep Citation errors in determination by clicking the speech icon next to a citing article and providing updated information. This will be integrated into the next Deep Citation learning cycle, which occurs on a regular basis.
OpenKIM acknowledges the support of the Allen Institute for AI through the Semantic Scholar project for providing citation information and full text of articles when available, which are used to train the Deep Citation ML algorithm.
|
This panel provides information on past usage of this interatomic potential (IP) powered by the OpenKIM Deep Citation framework. The word cloud indicates typical applications of the potential. The bar chart shows citations per year of this IP (bars are divided into articles that used the IP (green) and those that did not (blue)). The complete list of articles that cited this IP is provided below along with the Deep Citation determination on usage. See the Deep Citation documentation for more information.
165 Citations (76 used)
Help us to determine which of the papers that cite this potential actually used it to perform calculations. If you know, click the .
USED (definite) J. P. Mendez, M. Ponga, and M. Ortiz, “Diffusive molecular dynamics simulations of lithiation of silicon nanopillars,” Journal of the Mechanics and Physics of Solids. 2018. link Times cited: 21 USED (definite) S. Schwalbe, T. Gruber, K. Trepte, F. Biedermann, F. Mertens, and J. Kortus, “Mechanical, elastic and thermodynamic properties of crystalline lithium silicides,” arXiv: Computational Physics. 2016. link Times cited: 5 USED (high confidence) C. M. Efaw et al., “A closed-host bi-layer dense/porous solid electrolyte interphase for enhanced lithium-metal anode stability,” Materials Today. 2021. link Times cited: 15 USED (high confidence) Y. Yang and Y. Ni, “Elastic interaction between inclusions and tunable periodicity of superlattice structure in nanowires,” Applied Mathematics and Mechanics. 2020. link Times cited: 1 USED (high confidence) Y.-sung Lee et al., “Stress Relief Principle of Micron‐Sized Anodes with Large Volume Variation for Practical High‐Energy Lithium‐Ion Batteries,” Advanced Functional Materials. 2020. link Times cited: 32 Abstract: Practical applications of high gravimetric and volumetric ca… read moreAbstract: Practical applications of high gravimetric and volumetric capacity anodes for next‐generation lithium‐ion batteries have attracted unprecedented attentions, but still faced challenges by their severe volume changes, rendering low Coulombic efficiency and fast capacity fading. Nano and void‐engineering strategies had been extensively applied to overcome the large volume fluctuations causing the continuous irreversible reactions upon cycling, but they showed intrinsic limit in fabrication of practical electrode condition. Achieving high electrode density is particularly paramount factor in terms of the commercial feasibility, which is mainly dominated by the true density and tapping density of active material. Herein, based on finite element method calculation, micron‐sized double passivation layered Si/C design is introduced with restrictive lithiation state, which can withstand the induced stress from Li insertion upon repeated cycling. Such design takes advantage in structural integrity during long‐term cycling even at high gravimetric capacity (1400 mAh g−1). In 1 Ah pouch‐type full‐cell evaluation with high mass loading and electrode density (≈3.75 mAh cm−2 and ≈1.65 g cm−3), it demonstrates superior cycle stability without rapid capacity drop during 800 cycles. read less USED (high confidence) P. Andric and W. Curtin, “Atomistic modeling of fracture,” Modelling and Simulation in Materials Science and Engineering. 2018. link Times cited: 32 Abstract: Atomistic modeling of fracture is intended to illuminate the… read moreAbstract: Atomistic modeling of fracture is intended to illuminate the complex response of atoms in the very high stressed region just ahead of a sharp crack. Accurate modeling of the atomic scale fracture is crucial for describing the intrinsic nature of a material (intrinsic ductility/brittleness), chemical effects in the crack-tip vicinity, the crack interaction with different defects in solids such as grain boundaries, solutes, precipitates, dislocations, voids, etc. Here, different methods for atomistic modeling of fracture are compared in their ability to obtain quantitatively useful results that are in agreement with the basic principles of linear elastic fracture mechanics (LEFM). We demonstrate that the complicated atomic crack-tip behavior is precisely described in simulations of semi-infinite cracks, where the loading is uniquely controlled by the applied stress intensity factor K. Such ‘K-test’ simulations are shown to be equally applicable in crystalline and amorphous materials, and to be suitable for quantitative evaluation of various critical stress intensity factors, the overall material fracture toughness, and quantitative comparison with theories. We further demonstrate that the simulation of a nanoscale center-crack tension (CCT) specimen often leads to the results that do not satisfy the conditions for application of LEFM. The simulated intrinsic fracture toughness, one of the basic material properties, using CCT test geometry is shown to be dependent on the crack size and far-field loading. In general, this study resolves quantitative differences between several methods for atomistic modeling of fracture and recommends that application of simulations based on nanoscale finite size cracks not be pursued. read less USED (high confidence) V. S. Proshchenko, P. Dholabhai, and S. Neogi, “Heat and charge transport in bulk semiconductors with interstitial defects,” Physical Review B. 2018. link Times cited: 10 Abstract: Interstitial defects are inevitably present in doped semicon… read moreAbstract: Interstitial defects are inevitably present in doped semiconductors that enable modern-day electronic, optoelectronic or thermoelectric technologies. Understanding of stability of interstitials and their bonding mechanisms in the silicon lattice was accomplished only recently with the advent of first-principles modeling techniques, supported by powerful experimental methods. However, much less attention has been paid to the effect of different naturally occurring interstitials on the thermal and electrical properties of silicon. In this work, we present a systematic study of the variability of heat and charge transport properties of bulk silicon, in the presence of randomly distributed interstitial defects (Si, Ge, C and Li). We find through atomistic lattice dynamics and molecular dynamics modeling studies that, interstitial defects scatter heat-carrying phonons to suppress thermal transport-1.56% of randomly distributed Ge and Li interstitials reduce the thermal conductivity of silicon by $\sim$ 30 and 34 times, respectively. Using first principles density functional theory and semi-classical Boltzmann transport theory, we compute electronic transport coefficients of bulk Si with 1.56% Ge, C, Si and Li interstitials, in hexagonal, tetrahedral, split-interstitial and bond-centered sites. We demonstrate that hexagonal-Si and hexagonal-Ge interstitials minimally impact charge transport. To complete the study, we predict the thermoelectric property of an experimentally realizable bulk Si sample that contains Ge interstitials in different symmetry sites. Our research establishes a direct relationship between the variability of structures dictated by fabrication processes and heat and charge transport properties of silicon. The relationship provides guidance to accurately estimate performance of Si-based materials for various technological applications. read less USED (high confidence) Q. Fang, Q. Wang, J. Li, E. Chen, B. Liu, and P. Wen, “A systematic investigation of cycle number, temperature and electric field strength effects on Si anode,” Materials & Design. 2018. link Times cited: 2 USED (high confidence) D. E. Galvez-Aranda and J. Seminario, “Simulations of a LiF Solid Electrolyte Interphase Cracking on Silicon Anodes Using Molecular Dynamics,” Journal of The Electrochemical Society. 2018. link Times cited: 32 USED (high confidence) C. Chang, X. Li, Z. Xu, and H. Gao, “Lithiation-enhanced charge transfer and sliding strength at the silicon-graphene interface: A first-principles study,” Acta Mechanica Solida Sinica. 2017. link Times cited: 8 USED (high confidence) H. Sitinamaluwa, J. Y. Nerkar, M. Wang, S. Zhang, and C. Yan, “Deformation and failure mechanisms of electrochemically lithiated silicon thin films,” RSC Advances. 2017. link Times cited: 31 Abstract: A fundamental understanding of mechanical behavior of a Li–S… read moreAbstract: A fundamental understanding of mechanical behavior of a Li–Si system is necessary to address the poor mechanical integrity of amorphous silicon (a-Si) electrodes, in order to utilize their enormous capacity in Li-ion batteries. In this work, deformation and failure mechanisms of electrochemically lithiated a-Si thin films were investigated using nanoindentation and molecular dynamics simulation techniques. The cracking observed in the a-Si thin films after the initial lithiation–delithiation cycle is associated with the tension stress developed when constrained by the substrates. The MD simulations provide an atomistic insight on the origin of plasticity and transition of fracture mechanisms with increasing lithium concentration in the electrode. Both experiment and the MD simulations indicate reduced strength, elastic modulus but increased ductility in the a-Si films after the full lithiation–delithiation cycle, as a result of increased disorder in the microstructures. Also, the mapping of void nucleation and growth indicates different failure modes in pristine and delithiated a-Si. read less USED (high confidence) H. Wang and H. Chew, “Molecular dynamics simulations of plasticity and cracking in lithiated silicon electrodes,” Extreme Mechanics Letters. 2016. link Times cited: 26 USED (high confidence) H. Sitinamaluwa, M. Wang, G. Will, W. Senadeera, S. Zhang, and C. Yan, “Lithium concentration dependent structure and mechanics of amorphous silicon,” Journal of Applied Physics. 2016. link Times cited: 15 Abstract: A better understanding of lithium-silicon alloying mechanism… read moreAbstract: A better understanding of lithium-silicon alloying mechanisms and associated mechanical behavior is essential for the design of Si-based electrodes for Li-ion batteries. Unfortunately, the relationship between the dynamic mechanical response and microstructure evolution during lithiation and delithiation has not been well understood. We use molecular dynamic simulations to investigate lithiated amorphous silicon with a focus to the evolution of its microstructure, phase composition, and stress generation. The results show that the formation of LixSi alloy phase is via different mechanisms, depending on Li concentration. In these alloy phases, the increase in Li concentration results in reduction of modulus of elasticity and fracture strength but increase in ductility in tension. For a LixSi system with uniform Li distribution, volume change induced stress is well below the fracture strength in tension. read less USED (high confidence) X. Yan, A. Gouissem, and P. Sharma, “Atomistic insights into Li-ion diffusion in amorphous silicon,” Mechanics of Materials. 2015. link Times cited: 24 USED (high confidence) W. Ko and B.-J. Lee, “Modified embedded-atom method interatomic potentials for pure Y and the V–Pd–Y ternary system,” Modelling and Simulation in Materials Science and Engineering. 2013. link Times cited: 20 Abstract: Interatomic potentials for pure Y and the V–Pd–Y ternary sys… read moreAbstract: Interatomic potentials for pure Y and the V–Pd–Y ternary system have been developed on the basis of the second nearest-neighbor modified embedded-atom method (2NN MEAM) formalism, with a purpose of investigating the interdiffusion mechanism and the role of yttrium in the palladium-coated vanadium-based hydrogen separation membranes. The potentials can describe various fundamental physical properties of pure Y (the bulk, defect and thermal properties) and the alloy behaviors (structural, thermodynamic and defect properties of solid solutions and compounds) of constituent systems in reasonable agreement with experimental data or first-principles calculations. read less USED (high confidence) K. Zhao et al., “Reactive flow in silicon electrodes assisted by the insertion of lithium.,” Nano letters. 2012. link Times cited: 157 Abstract: In the search for high-energy density materials for Li-ion b… read moreAbstract: In the search for high-energy density materials for Li-ion batteries, silicon has emerged as a promising candidate for anodes due to its ability to absorb a large number of Li atoms. Lithiation of Si leads to large deformation and concurrent changes in its mechanical properties, from a brittle material in its pure form to a material that can sustain large inelastic deformation in the lithiated form. These remarkable changes in behavior pose a challenge to theoretical treatment of the material properties. Here, we provide a detailed picture of the origin of changes in the mechanical properties, based on first-principles calculations of the atomic-scale structural and electronic properties in a model amorphous silicon (a-Si) structure. We regard the reactive flow of lithiated silicon as a nonequilibrium process consisting of concurrent Li insertion driven by unbalanced chemical potential and flow driven by deviatoric stress. The reaction enables the material to flow at a lower level of stress. Our theoretical model is in excellent quantitative agreement with experimental measurements of lithiation-induced stress on a Si thin film. read less USED (high confidence) T. Zhu, “Mechanics of high-capacity electrodes in lithium-ion batteries,” Chinese Physics B. 2015. link Times cited: 10 Abstract: Rechargeable batteries, such as lithium-ion batteries, play … read moreAbstract: Rechargeable batteries, such as lithium-ion batteries, play an important role in the emerging sustainable energy landscape. Mechanical degradation and resulting capacity fade in high-capacity electrode materials critically hinder their use in high-performance lithium-ion batteries. This paper presents an overview of recent advances in understanding the electrochemically-induced mechanical behavior of the electrode materials in lithium-ion batteries. Particular emphasis is placed on stress generation and facture in high-capacity anode materials such as silicon. Finally, we identify several important unresolved issues for future research. read less USED (low confidence) L. Chai et al., “Lifetime Optimization of Amorphous Silicon Thin-Film Anodes for Lithium-Ion Batteries,” ACS Applied Energy Materials. 2023. link Times cited: 1 USED (low confidence) F. Hasheminia, Y. Bahari, and A. Rajabpour, “A molecular dynamics study on the thermal properties of lithiated silicon nanowires,” Applied Physics A. 2023. link Times cited: 0 USED (low confidence) G. Zhang, S. Zhang, R. Song, and C. Cai, “Effect of Mg and Si Contents on Hot-Dip 55Al-Zn Plating: Experimental and Molecular Dynamics Simulation,” Materials Today Communications. 2023. link Times cited: 1 USED (low confidence) D. Bo, L. M. Zhu, M. Zhou, and G. X. Long, “Effect of Li–Si composites on electrochemical properties of silicon-based anode materials,” AIP Advances. 2023. link Times cited: 0 Abstract: Metal silicides are considered promising candidates for the … read moreAbstract: Metal silicides are considered promising candidates for the replacement of graphite due to their larger capacity than graphite used in Li-ion batteries. In this work, a type of lithium silicide composite material consisting of LixSi, graphite (G), and porous carbon (PC) together with carbon coating treatment, denoted as (LS-G-PC)@C, was prepared by high-energy ball milling and subsequent pitch pyrolysis. This type of material is used as a pre-lithiation additive to improve the initial Coulombic efficiency (ICE) of Si-based anodes. The microstructural characteristic of (LS-G-PC)@C composite material was analyzed by x-ray diffraction and scanning electron microscopy. The electrochemical properties were evaluated by cyclic voltammetry, electrochemical impedance spectroscopy, and capacity cycling tests. It has been found that the irregular particles of LS compounds are uniformly dispersed on the graphite sheet, which constitutes an effective conductive network together with PC. The addition of a 5 wt. % (LS-G-PC)@C pre-lithiation additive makes the ICE of a low ICE silicon-based composite material increase by 16%. At a current density of 100 mA g−1, the discharge capacity retention rate of the silicon-based composite increased from 86.1% to 91% after the 19th cycle, showing good cycle stability. Further work is to add higher levels of our pre-lithiation additive in order to improve the ICE significantly. read less USED (low confidence) B. Li, A. Goldman, and J. Xu, “Reactive diffusion of lithium in silicon in anode materials for Li-ion batteries,” Materialia. 2023. link Times cited: 0 USED (low confidence) G. Viana, R. Masson, B. Michel, B. Mathieu, and M. Gărăjeu, “Stress level estimates in coated or uncoated silicon nanoparticles during lithiation,” European Journal of Mechanics - A/Solids. 2023. link Times cited: 1 USED (low confidence) Z. Qin, R. Wang, S. Li, T. Wen, B. Yin, and Z. Wu, “MEAM interatomic potential for thermodynamic and mechanical properties of lithium allotropes,” Computational Materials Science. 2022. link Times cited: 4 USED (low confidence) R. Xue, X. Li, H. Zhao, and Z. Chen, “Phase field model coupling with strain gradient plasticity for fracture in lithium-ion battery electrodes,” Engineering Fracture Mechanics. 2022. link Times cited: 8 USED (low confidence) S. J. Gross, M.-T. Hsieh, D. Mumm, L. Valdevit, and A. Mohraz, “Alleviating expansion-induced mechanical degradation in lithium-ion battery silicon anodes via morphological design,” Extreme Mechanics Letters. 2022. link Times cited: 5 USED (low confidence) S. Chen, H. Chen, Y. Zhao, H. Chathuranga, A. Du, and C. Yan, “Numerical investigation of microstructure and failure of lithiated silicon under biaxial tension,” Computational Materials Science. 2021. link Times cited: 0 USED (low confidence) F. Shuang and K. Aifantis, “A First Molecular Dynamics Study for Modeling the Microstructure and Mechanical Behavior of Si Nanopillars during Lithiation.,” ACS applied materials & interfaces. 2021. link Times cited: 9 Abstract: This is the first study that employs large-scale atomistic s… read moreAbstract: This is the first study that employs large-scale atomistic simulations to examine the stress generation and deformation mechanisms of various Si nanopillars (SiNPs) during Li-ion insertion. First, a new robust and effective minimization approach is proposed to relax a lithiated amorphous SiNP (a-SiNP), which outperforms the known methods. Using this new method, our simulations are able to successfully capture the experimental morphological changes and volume expansions that SiNPs, hollow a-SiNPs, and solid crystalline SiNPs (c-SiNPs) experience upon maximum lithiation. These simulations enable us to selectively track the displacement of Si atoms and their atomic shear strain in the Li3.75Si alloy region, allowing us to observe the plastic flow and illustrate the atomistic mechanism of lithiation-induced deformation for various SiNPs for the first time. Based on the simulation results, a simple fracture mechanistic model is used to determine the fracture resistance of SiNPs, showing that the hollow a-SiNP is the optimal form of Si as an anode because it has the highest fracture resistance. The crack propagation simulation suggests that the preexisting dislocations in pristine c-Si can contribute toward the fracture of c-SiNPs during lithiation. These findings can guide the design of new Si-based anode geometries for the next-generation Li-ion batteries. read less USED (low confidence) L. Vasconcelos, R. Xu, and K. Zhao, “Quantitative spatiotemporal Li profiling using nanoindentation,” Journal of The Mechanics and Physics of Solids. 2020. link Times cited: 16 USED (low confidence) S. Chen, A. Du, and C. Yan, “Molecular dynamic investigation of the structure and stress in crystalline and amorphous silicon during lithiation,” Computational Materials Science. 2020. link Times cited: 7 USED (low confidence) M.-Q. Le, H.-T. Nguyen, and T.-L. Bui, “A Computational Comparative Study of the Lithium Diffusion in Amorphous Silicon Spheres, Rods, and Circular Disks.” 2020. link Times cited: 0 Abstract:
We study through extensive finite element analysis the lit… read moreAbstract:
We study through extensive finite element analysis the lithium diffusion in small elements of Si anodes under the forms of spheres, rods, and circular disks for Li-ion batteries. Elastoplastic properties of the amorphous silicon are assumed to be lithium concentration-dependent. Effects of the normalized flux of Li-ions on the lithium concentrations, stresses, and total equivalent plastic strains are considered. Effects of the disk's thickness are also included. At a given normalized flux, the heterogeneity of the lithiation, stresses, and plastic deformation increases in the order: disk, sphere, and rod. The thinner disk the better performance is. Below a critical value of the normalized flux of Li-ions, silicon spheres and disks exhibit linear elasticity and homogeneous distribution of Li-ions, whereas silicon rods undergo always plastic deformation after lithiation. When the radii of these three structures are smaller than several micrometers and the normalized flux is taken as 95% of their critical value, the charge time falls in the range from minutes to several hours. Our findings will help to optimize the charge and geometrical parameters for silicon anodes. read less USED (low confidence) A. Singh and S. Pal, “Coupled chemo-mechanical modeling of fracture in polycrystalline cathode for lithium-ion battery,” International Journal of Plasticity. 2020. link Times cited: 35 USED (low confidence) X. Li, H. Cui, and R.-Z. Zhang, “Mechanical, acoustical, and optical properties of several Li-Si alloys: a first-principles study,” Journal of Zhejiang University-SCIENCE A. 2019. link Times cited: 2 Abstract: Owing to their excellent theoretical capacity, Li-Si alloys … read moreAbstract: Owing to their excellent theoretical capacity, Li-Si alloys have been extensively investigated as potential Lithium-ion batteries. Knowledge of the mechanical, acoustical, and optical properties of Li-Si alloys is important in order to improve battery performance. In the present study, we calculated the mechanical, acoustical, and optical properties of several Li-Si alloys theoretically. Our investigation confirms the mechanical stability of these Li-Si alloys. With increasing lithium content, Li-Si alloys become increasingly vulnerable to shape deformation as the number of Si-Si bonds decreases. The analysis of elastic moduli shows that the bulk modulus increases with the increase of lithium contents. Li22Si5 has the strongest anisotropic Young’s modulus. The sequence of degree of anisotropic Young’s modulus is Li22Si5>Li15Si4>LiSi>Li17Si4>Li12Si7>Li13Si4. From an analysis of the anisotropy of acoustic velocity, the transverse velocities are shown to be less than the corresponding longitudinal acoustic velocities. The longitudinal wave of the cubic system is the fastest along the [111] direction, while it is the fastest along the [001] direction for the orthorhombic system and the [010] direction for the tetragonal system. In addition, all the studied Li-Si alloys have relatively low thermal conductivities and show a higher anisotropy when photon energies are lower than 20 eV. We conclude that the studied Li-Si alloys are promising dielectric materials. read less USED (low confidence) S. Basu, N. Koratkar, and Y. Shi, “Structural Transformation and Embrittlement During Lithiation and Delithiation Cycles in an Amorphous Silicon Electrode,” Materials Science Educator: Courses. 2019. link Times cited: 20 Abstract: Silicon shows potential as an anode material in lithium ion … read moreAbstract: Silicon shows potential as an anode material in lithium ion batteries due to its high specific capacity, yet its considerable volume expansion during lithiation leads to fracture and pulverization. Unfortunately, neither the atomic-level structural evolution, nor the mechanical behavior of the anode during lithiation and delithiation cycles is well understood. Interestingly, the lithiation process of a-Si provides an interesting continuum from open-structured network glass to densely-packed atomic glass, which could be used to obtain useful insights regarding commonalities in glasses. Here atomic level simulation has been used to investigate one cycle of lithiation and delithiation of amorphous silicon electrode, using Grand Canonical Monte Carlo (GCMC) and molecular dynamics (MD) simulations. The atomic level structural transformation and damage accumulation of the anode during cycling has been systematically analyzed, as well as their mechanical responses in compact tension tests. There appears to be a ductile-brittle-ductile transition for the amorphous silicon anode during both the lithiation and delithiation cycle. In other words, amorphous silicon is particularly vulnerable at intermediate lithiation. The fracture behavior of lithiated silicon was found to correlate to the Poisson's ratio, due to variations in bond covalency and structural disorder. read less USED (low confidence) X. Duan, B. He, M. Guo, Z. Liu, Y. Wen, and B. Shan, “Lattice inversion modified embedded atom method for FCC metals,” Computational Materials Science. 2018. link Times cited: 8 USED (low confidence) L. Chang, Y. Lu, L. He, and Y. Ni, “Phase field model for two-phase lithiation in an arbitrarily shaped elastoplastic electrode particle under galvanostatic and potentiostatic operations,” International Journal of Solids and Structures. 2018. link Times cited: 25 USED (low confidence) C. Huang et al., “Simulation study of effects of Ti content on microstructure evolution and elastic constants of immiscible Mg-Ti alloys during rapid quenching process,” Materials Letters. 2018. link Times cited: 4 USED (low confidence) Y. Lu, L. Chang, H. B. Yao, L. He, and Y. Ni, “Transition from Deceleration to Acceleration of Lithiation Front Movement in Hollow Phase Transformation Electrodes,” Journal of The Electrochemical Society. 2017. link Times cited: 5 USED (low confidence) F. Taubert et al., “Thermodynamic characterization of lithium monosilicide (LiSi) by means of calorimetry and DFT-calculations,” International Journal of Materials Research. 2017. link Times cited: 8 Abstract: In this work we summarize a symbiotic approach to combine ex… read moreAbstract: In this work we summarize a symbiotic approach to combine experimental and theoretical investigations for the derivation of high quality thermodynamic data for the description of potential lithium ion battery materials. The methodology of this concept was demonstrated in detail by exploring and describing the properties of the lithium monosilicide phase LiSi. The procedures were also applied in a series of investigations to all major LixSiy-phases which will be reviewed briefly. Regarding the LiSi phase, the measured and calculated isobaric heat capacity, which may enable further thermodynamic investigations (e. g. with CALPHAD method) of the phase diagram of the Li–Si-system is presented. The heat capacity of the stable phase LiSi was measured as a function of temperature in a range from (2 to 673) K and compared with corresponding ab-initio and molecular dynamic calculations resulting in values for absolute entropies. The heat of formation of the system was determined in an unconventional manner via hydrogenation experiments. read less USED (low confidence) S. M. Khosrownejad and W. Curtin, “Crack growth and fracture toughness of amorphous Li-Si anodes: Mechanisms and role of charging/discharging studied by atomistic simulations,” Journal of The Mechanics and Physics of Solids. 2017. link Times cited: 20 USED (low confidence) H. Zhang et al., “Effects of pressure on microstructure evolution and mechanical properties of liquid Ni64Zr36 alloy during rapid solidification: A molecular dynamics simulation study,” Computational Materials Science. 2017. link Times cited: 7 USED (low confidence) Y. Sato, C. Nakai, M. Wakeda, and S. Ogata, “Predictive modeling of Time-Temperature-Transformation diagram of metallic glasses based on atomistically-informed classical nucleation theory,” Scientific Reports. 2017. link Times cited: 15 USED (low confidence) B. Ding and X. Li, “An Eccentric Ellipse Failure Criterion for Amorphous Materials,” Journal of Applied Mechanics. 2017. link Times cited: 7 USED (low confidence) X. Sun, S. Xiao, H. Deng, and W. Hu, “Molecular dynamics simulation of wetting behaviors of Li on W surfaces,” Fusion Engineering and Design. 2017. link Times cited: 14 USED (low confidence) X. Yan, P. Cao, W. Tao, P. Sharma, and H. S. Park, “Atomistic modeling at experimental strain rates and timescales,” Journal of Physics D: Applied Physics. 2016. link Times cited: 16 Abstract: Modeling physical phenomena with atomistic fidelity and at l… read moreAbstract: Modeling physical phenomena with atomistic fidelity and at laboratory timescales is one of the holy grails of computational materials science. Conventional molecular dynamics (MD) simulations enable the elucidation of an astonishing array of phenomena inherent in the mechanical and chemical behavior of materials. However, conventional MD, with our current computational modalities, is incapable of resolving timescales longer than microseconds (at best). In this short review article, we briefly review a recently proposed approach—the so-called autonomous basin climbing (ABC) method—that in certain instances can provide valuable information on slow timescale processes. We provide a general summary of the principles underlying the ABC approach, with emphasis on recent methodological developments enabling the study of mechanically-driven processes at slow (experimental) strain rates and timescales. Specifically, we show that by combining a strong physical understanding of the underlying phenomena, kinetic Monte Carlo, transition state theory and minimum energy pathway methods, the ABC method has been found to be useful in a variety of mechanically-driven problems ranging from the prediction of creep-behavior in metals, constitutive laws for grain boundary sliding, void nucleation rates, diffusion in amorphous materials to protein unfolding. Aside from reviewing the basic ideas underlying this approach, we emphasize some of the key challenges encountered in our own personal research work and suggest future research avenues for exploration. read less USED (low confidence) J. Moon, B. Lee, M. Cho, and K. Cho, “Ab initio and kinetic Monte Carlo study of lithium diffusion in LiSi, Li12Si7, Li13Si5 and Li15Si4,” Journal of Power Sources. 2016. link Times cited: 18 USED (low confidence) S. M. Khosrownejad and W. Curtin, “Model for charge/discharge-rate-dependent plastic flow in amorphous battery materials,” Journal of The Mechanics and Physics of Solids. 2016. link Times cited: 15 USED (low confidence) C. Shen et al., “In Situ and Ex Situ TEM Study of Lithiation Behaviours of Porous Silicon Nanostructures,” Scientific Reports. 2016. link Times cited: 39 USED (low confidence) A. P. Moore, B. Beeler, C. Deo, M. Baskes, and M. Okuniewski, “Atomistic modeling of high temperature uranium–zirconium alloy structure and thermodynamics,” Journal of Nuclear Materials. 2015. link Times cited: 41 USED (low confidence) N. S. Mikhaleva, M. Visotin, Z. Popov, A. Kuzubov, and A. Fedorov, “Ab initio and empirical modeling of lithium atoms penetration into silicon,” Computational Materials Science. 2015. link Times cited: 4 USED (low confidence) F. Yang, “Entropy change-induced elastic softening of lithiated materials,” Theoretical and Applied Mechanics Letters. 2015. link Times cited: 3 USED (low confidence) B. Ding, X. Li, X. Zhang, H. Wu, Z. Xu, and H. Gao, “Brittle versus ductile fracture mechanism transition in amorphous lithiated silicon: From intrinsic nanoscale cavitation to shear banding,” Nano Energy. 2015. link Times cited: 45 USED (low confidence) M. Mortazavi, Q. Ye, N. Birbilis, and N. Medhekar, “High capacity group-15 alloy anodes for Na-ion batteries: electrochemical and mechanical insights,” Journal of Power Sources. 2015. link Times cited: 68 USED (low confidence) M. Alam and S. Groh, “Dislocation modeling in bcc lithium: A comparison between continuum and atomistic predictions in the modified embedded atoms method,” Journal of Physics and Chemistry of Solids. 2015. link Times cited: 19 USED (low confidence) D. Thomas et al., “The heat capacity and entropy of the lithium silicides Li17Si4 and Li16.42Si4 in the temperature range from (2 to 873) K,” The Journal of Chemical Thermodynamics. 2015. link Times cited: 15 USED (low confidence) Y. Mo et al., “Non-linear effects of initial melt temperatures on microstructures and mechanical properties during quenching process of liquid Cu46Zr54 alloy,” Physica B-condensed Matter. 2015. link Times cited: 5 USED (low confidence) X. Duan, B. Zhou, Y. Wen, R. Chen, H. Zhou, and B. Shan, “Lattice inversion modified embedded atom method for bcc transition metals,” Computational Materials Science. 2015. link Times cited: 14 USED (low confidence) S. Chang, J. Moon, K. Cho, and M. Cho, “Multiscale analysis of prelithiated silicon nanowire for Li-ion battery,” Computational Materials Science. 2015. link Times cited: 27 USED (low confidence) C.-Y. Chou and G. Hwang, “On the origin of anisotropic lithiation in crystalline silicon over germanium: A first principles study,” Applied Surface Science. 2014. link Times cited: 16 USED (low confidence) Z. Guo, T. Zhang, J. Zhu, and Y. Wang, “Effects of hydrostatic pressure and modulus softening on electrode curvature and stress in a bilayer electrode plate,” Computational Materials Science. 2014. link Times cited: 10 USED (low confidence) C.-Y. Chou and G. Hwang, “On the origin of the significant difference in lithiation behavior between silicon and germanium,” Journal of Power Sources. 2014. link Times cited: 43 USED (low confidence) J. Xia and E. Carter, “Orbital-free density functional theory study of crystalline Li–Si alloys,” Journal of Power Sources. 2014. link Times cited: 16 USED (low confidence) C. Cheng, H. Liu, X. Xin, H. Cao, and L. Shi, “Highly dispersed copper nanoparticle modified nano Li4Ti5O12 with high rate performance for lithium ion battery,” Electrochimica Acta. 2014. link Times cited: 37 USED (low confidence) Y. He, H. Hu, Y. Song, Z. Guo, C. Liu, and J. Zhang, “Effects of concentration-dependent elastic modulus on the diffusion of lithium ions and diffusion induced stress in layered battery electrodes,” Journal of Power Sources. 2014. link Times cited: 64 USED (low confidence) F. Legrain, O. Malyi, and S. Manzhos, “Comparative computational study of the diffusion of Li, Na, and Mg in silicon including the effect of vibrations,” Solid State Ionics. 2013. link Times cited: 48 USED (low confidence) Z. Zeng et al., “Elastic moduli of polycrystalline Li15Si4 produced in lithium ion batteries,” Journal of Power Sources. 2013. link Times cited: 31 USED (low confidence) A. Carvalho, M. Rayson, P. Briddon, and S. Manzhos, “Effect of the adsorption of ethylene carbonate on Si surfaces on the Li insertion behavior,” Chemical Physics Letters. 2013. link Times cited: 3 USED (low confidence) Z. Cui, F. Gao, and J. Qu, “Two-phase versus two-stage versus multi-phase lithiation kinetics in silicon,” Applied Physics Letters. 2013. link Times cited: 14 Abstract: We classify the lithiation process into three types, namely,… read moreAbstract: We classify the lithiation process into three types, namely, two-phase, two-stage, and multi-phase lithiation. We found that under a given charging rate, smaller electrochemical Biot number of β will likely to result in two-phase lithiation, while larger β may lead to multi-phase lithiation. For the film anode, intermediate β, or intermediate charging rate, will yield two-stage lithiation, and the Li concentration during the first stage of the lithiation is determined by the relationship between β and the charging rate (or more precisely the Li flux supplied to the Si/LixSi phase interface). Such two-stage lithiation does not occur in the particle or fiber anode. read less USED (low confidence) Y. Sun, C. Wang, and Y. Chen, “Molecular dynamics simulations of the deformation behavior of gadolinia-doped ceria solid electrolytes under tensile loading,” Journal of Power Sources. 2013. link Times cited: 17 USED (low confidence) Z. Cui, F. Gao, and J. Qu, “Interface-reaction controlled diffusion in binary solids with applications to lithiation of silicon in lithium-ion batteries,” Journal of The Mechanics and Physics of Solids. 2013. link Times cited: 154 USED (low confidence) S. Jung, J. Choi, and Y. K. Han, “Anisotropic volume expansion of crystalline silicon during electrochemical lithium insertion: an atomic level rationale.,” Nano letters. 2012. link Times cited: 113 Abstract: The volume expansion of silicon is the most important featur… read moreAbstract: The volume expansion of silicon is the most important feature for electrochemical operations of high capacity Si anodes in lithium ion batteries. Recently, the unexpected anisotropic volume expansion of Si during lithiation has been experimentally observed, but its atomic-level origin is still unclear. By employing first-principles molecular dynamics simulations, herein, we report that the interfacial energy at the phase boundary of amorphous Li(x)Si/crystalline Si plays a very critical role in lithium diffusion and thus volume expansion. While the interface formation turns out to be favorable at x = 3.4 for all of the (100), (110), and (111) orientations, the interfacial energy for the (110) interface is the smallest, which is indeed linked to the preferential volume expansion along the <110> direction because the preferred (110) interface would promote lithiation behind the interface. Utilizing the structural characteristic of the Si(110) surface, local Li density at the (110) interface is especially high reaching Li(5.5)Si. Our atomic-level calculations enlighten the importance of the interfacial energy in the volume expansion of Si and offer an explanation for the previously unsolved perspective. read less USED (low confidence) M. Wang, H. Ye, and C. Zhai, “Amorphization-induced energy loss of amorphous Si anodes for Li-ion batteries,” Scripta Materialia. 2022. link Times cited: 1 USED (low confidence) A. Bagheri, J. Arghavani, R. Naghdabadi, and L. Brassart, “A theory for coupled lithium insertion and viscoplastic flow in amorphous anode materials for Li-ion batteries,” Mechanics of Materials. 2021. link Times cited: 14 USED (low confidence) F. Taubert, J. Seidel, R. Hüttl, M. Bobnar, R. Gumeniuk, and F. Mertens, “The heat capacity and entropy of the metastable lithium silicide Li15Si4 in the temperature range (2 to 615) K,” The Journal of Chemical Thermodynamics. 2018. link Times cited: 3 USED (low confidence) L. Berla, S. Lee, Y. Cui, and W. Nix, “Mechanical behavior of electrochemically lithiated silicon,” Journal of Power Sources. 2015. link Times cited: 116 USED (low confidence) P. Haldar and A. Chatterjee, “Nudged-Elastic Band Study of Lithium Diffusion in Bulk Silicon in the Presence of Strain,” Energy Procedia. 2014. link Times cited: 6 NOT USED (low confidence) Y. Xiong, B. Lu, Y. Zhao, Y. Song, and J. Zhang, “A coupled mechanical-electrochemical phase-field formulation for understanding the evolution of lithiated-silicon sponge,” Journal of the Mechanics and Physics of Solids. 2023. link Times cited: 0 NOT USED (low confidence) L. Chai, X. Wang, B. Su, X. Li, and W. Xue, “Insight into The Decay Mechanism of Non-ultra-thin Silicon Film Anode for Lithium-ion Batteries,” Electrochimica Acta. 2023. link Times cited: 1 NOT USED (low confidence) F. Taubert, D. Thomas, R. Hüttl, J. Seidel, and F. Mertens, “Experimental determination of enthalpies of formation of Li17Si4, Li16.42Si4 and Li13Si4,” Journal of Alloys and Compounds. 2021. link Times cited: 0 NOT USED (low confidence) S. Park et al., “Scalable Synthesis of Hollow β-SiC/Si Anodes via Selective Thermal Oxidation for Lithium-Ion Batteries.,” ACS nano. 2020. link Times cited: 22 Abstract: Silicon for anode in lithium ion batteries has received much… read moreAbstract: Silicon for anode in lithium ion batteries has received much attention owing to its superior specific capacity. There has been a rapid increase of research related void engineering to address the silicon failure mechanism stemming from massive volume change during (dis)charging in the last decade. Nevertheless, conventional synthetic methods require the complex synthetic procedures and toxic reagents to form void space, so they have an obvious limitation to reach practical application. Here, we introduce the SiCx consisting of nano crystallite Si embedded in the inactive matrix of β-SiC to fabricate various type of void structures using thermal etching with scalable one-pot CVD method. The unique structural features of SiCx make the carbonaceous template possible to be etched selectively without Si oxidation in high temperature with air atmosphere. Furthermore, bottom-up gas phase synthesis of SiCx ensure atomically identical structural features regardless of different type of sacrificial templates. For these reasons, various types of SiCx hollow structures having shell, tube, and sheet can be synthesized by simply employing different morphologies of carbon template. In result, morphological effect of different hollow structures can be deeply investigated as well as free volume effect originated from void engineering in both electrochemical and computational point of view. In terms of selective thermal oxidation, SiCx-hollow-shell achieve much higher initial coulombic efficiency (> 89%) than that of Si-hollow-shell (65%) because of its non-oxidative property originated from structural characteristics of SiCx during thermal etching. Moreover, findings based on the clearly observed different electrochemical features between half-cell and full-cell configuration give insight to further Si anode researches. read less NOT USED (low confidence) N. Xu, Y. Shi, Y. He, and Q. Shao, “A Deep-Learning Potential for Crystalline and Amorphous Li–Si Alloys,” Journal of Physical Chemistry C. 2020. link Times cited: 38 Abstract: This work investigates the ability of the deep-learning pote… read moreAbstract: This work investigates the ability of the deep-learning potential (DP) to describe structural, dynamic and energetic properties of crystalline and amorphous Li-Si alloys. Li-Si systems play an impo... read less NOT USED (low confidence) F. Darbaniyan, X. Yan, and P. Sharma, “An Atomistic Perspective on the Effect of Strain Rate and Lithium Fraction on the Mechanical Behavior of Silicon Electrodes,” Journal of Applied Mechanics. 2020. link Times cited: 9 Abstract: The process of charging and discharging of lithium-ion batte… read moreAbstract: The process of charging and discharging of lithium-ion batteries results in the periodic intercalation and ejection of lithium ions in the anode material. High-capacity anode materials that are of significant interest for next-generation batteries, such as silicon, undergo large deformation during this process. The ensuing electro-chemo-mechanical stresses and accompanying microstructural changes lead to a complex state of inelastic deformation and damage in the silicon electrode that causes a significant capacity loss within just a few cycles. In this study, we attempt to understand, from an atomistic viewpoint, the mechanisms underlying the plasticity behavior of Si-anode as a function of lithiation. Conventional molecular dynamics simulations are of limited use since they are restricted to loading rates in the order of 10 s. Practical charging-discharging rates are several orders of magnitude slower, thus precluding a realistic atomistic assessment of the highly ratedependent mechanical behavior of lithiated silicon anodes via conventional molecular dynamics. In this work, we use a time-scaling approach that is predicated on the combination of a potential energy surface sampling method, minimum energy pathway, kinetic Monte Carlo, and transition state theory, to achieve applied strain rates as low as 1 s. We assess and compare the atomistic mechanisms of plastic deformation in three different lithium concentration structures: LiSi2, LiSi, and Li15Si4 for various strain-rates. We find that the strain rate plays a significant role in the alteration of the deformation and damage mechanisms including the evolution of the plastic deformation, nucleation of shear transformation zone, and void nucleation. Somewhat anomalously, LiSi appears to demonstrate (comparatively) the least strain rate sensitivity. [DOI: 10.1115/1.4045545] read less NOT USED (low confidence) F. Zhou et al., “Diatomite derived hierarchical hybrid anode for high performance all-solid-state lithium metal batteries,” Nature Communications. 2019. link Times cited: 77 NOT USED (low confidence) X.-song Huang, X. Dong, L. Liu, and P. Li, “An improved modified embedded-atom method potential to fit the properties of silicon at high temperature,” Computational Materials Science. 2018. link Times cited: 5 NOT USED (low confidence) Y. An, K. K. Bejagam, and S. A. Deshmukh, “Development of New Transferable Coarse-Grained Models of Hydrocarbons.,” The journal of physical chemistry. B. 2018. link Times cited: 21 Abstract: We have utilized an approach that integrates molecular dynam… read moreAbstract: We have utilized an approach that integrates molecular dynamics (MD) simulations with particle swarm optimization (PSO) to accelerate the development of coarse-grained (CG) models of hydrocarbons. Specifically, we have developed new transferable CG beads, which can be used to model the hydrocarbons (C5 to C17) and reproduce their experimental properties with good accuracy. First, the PSO method was used to develop the CG beads of the decane model represented with a 2:1 (2-2-2-2-2) mapping scheme. This was followed by the development of the nonane model described with hybrid 2-2-3-2 and 3:1 (3-3-3) mapping schemes. The force-field parameters for these three CG models were optimized to reproduce four experimentally observed properties including density, enthalpy of vaporization, surface tension, and self-diffusion coefficient at 300 K. The CG MD simulations conducted with these new CG models of decane and nonane, at different timesteps, for various system sizes, and at a range of different temperatures, were able to predict their density, enthalpy of vaporization, surface tension, self-diffusion coefficient, expansibility, and isothermal compressibility with good accuracy. Moreover, a comparison of structural features obtained from the CG MD simulations and the CG beads of mapped all-atom trajectories of decane and nonane showed very good agreement. To test the chemical transferability of these models, we have constructed the models for hydrocarbons ranging from pentane to heptadecane, by using different combinations of the CG beads of decane and nonane. The properties of pentane to heptadecane predicted by these new CG models showed excellent agreement with the experimental data. read less NOT USED (low confidence) J. Chen, J. Chen, P. Yu, H. Wang, K. Liew, and S. Shen, “An ABAQUS implementation of electrochemomechanical theory for mixed ionic electronic conductors,” Solid State Ionics. 2018. link Times cited: 7 NOT USED (low confidence) D. Vranković et al., “Highly Porous Silicon Embedded in a Ceramic Matrix: A Stable High-Capacity Electrode for Li-Ion Batteries.,” ACS nano. 2017. link Times cited: 67 Abstract: We demonstrate a cost-effective synthesis route that provide… read moreAbstract: We demonstrate a cost-effective synthesis route that provides Si-based anode materials with capacities between 2000 and 3000 mAh·gSi-1 (400 and 600 mAh·gcomposite-1), Coulombic efficiencies above 99.5%, and almost 100% capacity retention over more than 100 cycles. The Si-based composite is prepared from highly porous silicon (obtained by reduction of silica) by encapsulation in an organic carbon and polymer-derived silicon oxycarbide (C/SiOC) matrix. Molecular dynamics simulations show that the highly porous silicon morphology delivers free volume for the accommodation of strain leading to no macroscopic changes during initial Li-Si alloying. In addition, a carbon layer provides an electrical contact, whereas the SiOC matrix significantly diminishes the interface between the electrolyte and the electrode material and thus suppresses the formation of a solid-electrolyte interphase on Si. Electrochemical tests of the micrometer-sized, glass-fiber-derived silicon demonstrate the up-scaling potential of the presented approach. read less NOT USED (low confidence) B. Cai and B. Jia, “Nanophotonics silicon solar cells.” 2017. link Times cited: 0 NOT USED (low confidence) F. Ozanam and M. Rosso, “Silicon as anode material for Li-ion batteries,” Materials Science and Engineering B-advanced Functional Solid-state Materials. 2016. link Times cited: 66 NOT USED (low confidence) B. Liu, H. Zhang, J. Tao, Z. R. Liu, X. Chen, and Y. Zhang, “Development of a second-nearest-neighbor modified embedded atom method potential for silicon–phosphorus binary system,” Computational Materials Science. 2016. link Times cited: 8 NOT USED (low confidence) B. Liu, H. Zhang, J. Tao, X. Chen, and Y.-A. Zhang, “Comparative investigation of a newly optimized modified embedded atom method potential with other potentials for silicon,” Computational Materials Science. 2015. link Times cited: 7 NOT USED (low confidence) J. R. Vella, F. Stillinger, A. Panagiotopoulos, and P. Debenedetti, “A Comparison of the Predictive Capabilities of the Embedded-Atom Method and Modified Embedded-Atom Method Potentials for Lithium.,” The journal of physical chemistry. B. 2015. link Times cited: 25 Abstract: We compare six lithium potentials by examining their ability… read moreAbstract: We compare six lithium potentials by examining their ability to predict coexistence properties and liquid structure using molecular dynamics. All potentials are of the embedded-atom method type. The coexistence properties we focus on are the melting curve, vapor pressure, saturated liquid density, and vapor-liquid surface tension. For each property studied, the simulation results are compared to available experimental data in order to properly assess the accuracy of each potential. We find that the Cui second nearest-neighbor modified embedded-atom method potential is overall the most reliable potential, giving adequate agreement for most of the properties examined. For example, the zero-pressure melting point of this potential is shown to be around 443 K, while it is it known from experiments to be about 454 K. This potential also gives excellent agreement for the saturated liquid densities, even though no liquid properties were used in the fitting procedure. We conclude that even though this potential is the most reliable overall, there is still room for improvement in terms of obtaining more accurate agreement for some of the properties studied, specifically the slope of the melting pressure versus temperature. read less NOT USED (low confidence) X. Duan, B. Zhou, R. Chen, H. Zhou, Y. Wen, and B. Shan, “Development of lattice inversion modified embedded atom method and its applications,” Current Applied Physics. 2014. link Times cited: 11 NOT USED (low confidence) E. D. Cubuk and E. Kaxiras, “Theory of structural transformation in lithiated amorphous silicon.,” Nano letters. 2014. link Times cited: 41 Abstract: Determining structural transformations in amorphous solids i… read moreAbstract: Determining structural transformations in amorphous solids is challenging due to the paucity of structural signatures. The effect of the transitions on the properties of the solid can be significant and important for applications. Moreover, such transitions may not be discernible in the behavior of the total energy or the volume of the solid as a function of the variables that identify its phases. These issues arise in the context of lithiation of amorphous silicon (a-Si), a promising anode material for high-energy density batteries based on lithium ions. Recent experiments suggest the surprising result that the lithiation of a-Si is a two-phase process. Here, we present first-principles calculations of the structure of a-Si at different lithiation levels. Through a detailed analysis of the short and medium-range properties of the amorphous network, using Voronoi-Delaunay methods and ring statistics, we show that a-LixSi has a fundamentally different structure below and above a lithiation level corresponding to x ∼ 2. read less NOT USED (low confidence) K. Zhang and J. Luo, “Research on flatness errors evaluation based on artificial fish swarm algorithm and Powell method,” Int. J. Comput. Sci. Math. 2013. link Times cited: 9 Abstract: In this paper, based on the analysis of existent evaluation … read moreAbstract: In this paper, based on the analysis of existent evaluation methods for form errors, a hybrid evaluation method is provided. The optimum model and the calculation process are introduced in detail. The hybrid optimisation algorithm based on artificial fish swarm algorithm AFSA and Powell optimisation method. As a new heuristic intelligent optimisation algorithm, AFSA has better performances such as good global convergence, strong robustness, insensitive to initial values, simplicity of implementation and faster convergent speed with random initial values compared with genetic algorithm. The Powell method is a classical powerful local descent algorithm, and its advantages are simple and efficient. By integrating Powell optimisation search the precision of AFSA optimisation result is evidently improved. The flatness error is discussed as an example. Finally, a control experiment is carried out, and the simulation result shows that the hybrid evaluation method is feasible and satisfactory in the evaluation of flatness errors. read less NOT USED (low confidence) B. Tian et al., “Combined Surface and Electrochemical Study of the Lithiation/Delithiation Mechanism of the Iron Oxide Thin-Film Anode for Lithium-Ion Batteries,” Journal of Physical Chemistry C. 2013. link Times cited: 53 Abstract: Iron oxide (mostly α-Fe2O3) model thin-film electrodes were … read moreAbstract: Iron oxide (mostly α-Fe2O3) model thin-film electrodes were prepared by thermal oxidation of pure metal iron substrates at 300 ± 5 °C in air and used for comprehensive investigation of the lithiation/delithiation mechanisms of anode material undergoing an electrochemical conversion reaction with lithium ions. Surface (X-ray photoelectron spectroscopy (XPS) and time-of-flight secondary ion mass spectrometry (ToF-SIMS)) and electrochemical (cyclic voltammetry (CV) and electrochemical impedance spectroscopy (EIS)) analytical techniques were combined. The results show that intercalation of Li in the Fe2O3 matrix and solid electrolyte interphase (SEI) layer formation both precede conversion to metallic iron and Li2O upon lithiation. Depth profile analysis evidences stratification of the converted thin-film electrode into fully and partially lithiated outer and inner parts, respectively, due to mass transport limitation. The SEI layer has a stable composition (Li2CO3 with minor ROCO2Li) but dynamically increase... read less NOT USED (low confidence) W. Yang and Z. Pei, “Hybrid ABC/PSO to solve travelling salesman problem,” Int. J. Comput. Sci. Math. 2013. link Times cited: 18 Abstract: In this paper, we present a hybrid optimisation algorithm wi… read moreAbstract: In this paper, we present a hybrid optimisation algorithm with artificial bee colony ABC and particle swarm optimisation PSO. Due to the fast convergent speed, PSO is the main methodology of this hybrid algorithm, as well as ABC is used to optimise the parameters. To investigate the performance, it is applied to solve travelling salesman problem. Simulation results show it is effective. read less NOT USED (low confidence) X. Feng, Y. Liang, and L. Jiao, “Bio-inspired optimisation approach for data association in target tracking,” Int. J. Wirel. Mob. Comput. 2013. link Times cited: 7 Abstract: Data association is an essential part of track maintenance i… read moreAbstract: Data association is an essential part of track maintenance in multiple target tracking, which can be solved by multidimensional assignment methods. When there is a need to solve the multidimensional assignment problem, the ant colony optimisation ACO algorithm stands out as it can solve combinatorial optimisation problem with excellent performance in acceptable CPU time. Here, each measurement is modelled as an ant, each track is modelled as a city, and the problem of data association is modelled as the food locating by ants. Thus, a novel data association based on an improved ant colony optimisation algorithm ACODA is proposed in this paper. The detailed corresponding relationship and theoretical analysis between basic ACO algorithm and the ACODA algorithm are given. Simulation results show that as the number of targets increases, the ACODA algorithm performs better than JPDA and NN, with superior performance both in computational time and accuracy. read less NOT USED (low confidence) C. Ma, Y. Li, R. He, F. Wu, B. Qi, and Q. Ye, “Route optimisation models and algorithms for hazardous materials transportation under different environments,” Int. J. Bio Inspired Comput. 2013. link Times cited: 21 Abstract: This study focuses on how to determine the optimum transport… read moreAbstract: This study focuses on how to determine the optimum transportation route for hazardous materials under the certain, fuzzy or stochastic environment. On the basis of analysing the transportation route selection problem of hazardous materials TRSP-HM, three objectives are presented and the multi-objective routing programming model MRPM for hazardous materials transportation HMT is put forward under the certain environment, and an improved label algorithm is proposed to solve the MRPM. After defining the maximum-chance optimum route and the α-optimum routes, the multi-objective routing chance-constrained programming model MRCPM and multi-objective routing dependent-chance programming model MRDPM for HMT under the fuzzy or stochastic environment are established respectively. Then, the integration intelligent algorithm is developed to solve the proposed models, which integrates the fuzzy simulation, neural networks, stochastic simulation and genetic algorithm. Finally, the proposed models and algorithms are successfully tested with the help of two real cases. read less NOT USED (low confidence) L. Chen, L. Pan, and C. Yang, “Using APPM-trained ANN to solve stochastic expected value mode,” Int. J. Bio Inspired Comput. 2013. link Times cited: 2 Abstract: Stochastic expected value model is one classical stochastic … read moreAbstract: Stochastic expected value model is one classical stochastic optimisation problem. Generally, the fitness function should be constructed and computed with artificial neural network ANN, thus, the computational efficiency is relied upon the weights and structure of ANN. In this paper, a new algorithm, artificial plant growing process model APPM which is inspired by plant growing process, is applied to train the weights of ANN. To show the performance, two examples are chosen to check. Simulation results show it is effective. read less NOT USED (low confidence) C. Wei and J. Fang, “Group search optimiser: a brief survey,” Int. J. Comput. Sci. Math. 2013. link Times cited: 6 Abstract: Group search optimiser GSO is a new swarm methodology algori… read moreAbstract: Group search optimiser GSO is a new swarm methodology algorithm inspired by animal behaviour. In GSO, the total individuals are divided into three kinds: producer, scroungers and rangers. In this paper, we provide a brief survey varying from the member updating strategies, topology and hybridisation. Finally, some future research topics are discussed. read less NOT USED (low confidence) R. Xiao and T. Chen, “Relationships of swarm intelligence and artificial immune system,” Int. J. Bio Inspired Comput. 2013. link Times cited: 15 Abstract: Swarm intelligence SI and artificial immune system AIS are b… read moreAbstract: Swarm intelligence SI and artificial immune system AIS are both derived from imitation of nature biology system. Their common characteristic is that they both have simple individuals but appear emergence characteristic in population level through interaction among individuals. In order to explore inherent similarity and difference of complex system, we take two typical forms of swarm intelligence ant colony system and particle swarm optimisation, and AIS as objectives to study this characteristic in this paper. First, we discuss the similarity between two biology systems from system structure and operation mechanism. In addition, we also illustrate the difference between two systems from algorithm design, individual diversity and shape space. At the end of the paper, numerical experiment is used to test the performance of swarm intelligence techniques and AIS, where benchmark test functions include unimodal and multimodal function optimisation problems. Besides, combined with a concrete example, travelling salesman problem TSP, the generality and feature of these two systems in solving complex problems are discussed in detail. The objective of the paper is to set up inherent connection and difference between two unlike systems, which not only has important theoretical significance but also has significant actual value to reveal production and operation mechanism of human intelligence. read less NOT USED (low confidence) S. Saha, R. Kar, D. Mandal, S. Ghoshal, and V. Mukherjee, “A new design method using opposition-based BAT algorithm for IIR system identification problem,” Int. J. Bio Inspired Comput. 2013. link Times cited: 46 Abstract: BAT algorithm BA is a meta-heuristic algorithm, based on the… read moreAbstract: BAT algorithm BA is a meta-heuristic algorithm, based on the echolocation behaviour of bats. In this paper, optimal set of filter coefficients is searched by the modified optimisation methodology called opposition-based BAT algorithm OBA for infinite impulse response IIR system identification problem. Opposition based numbering concept is embedded into the primary foundation of BA metaphorically to enhance the convergence speed and performance for finding better near-global optimal solution. Detailed and balanced search in multidimensional problem space is accomplished with judiciously chosen control parameters of OBA technique. When tested against standard benchmark examples, for same and reduced order models, the simulation results establish the OBA as a more competent candidate to other evolutionary algorithms as real coded genetic algorithm RGA, differential evolution DE and particle swarm optimisation PSO in terms of accuracy and convergence speed. read less NOT USED (low confidence) Z. Cui, F. Gao, and J. Qu, “On the perturbation solution of interface-reaction controlled diffusion in solids,” Acta Mechanica Sinica. 2012. link Times cited: 10 NOT USED (low confidence) F. Fan and T. Zhu, “Modeling of Lithiation in Silicon Electrodes.” 2016. link Times cited: 0 NOT USED (low confidence) L. Xie, J. Zeng, and R. Formato, “Selection strategies for gravitational constant G in artificial physics optimisation based on analysis of convergence properties,” Int. J. Bio Inspired Comput. 2012. link Times cited: 24 Abstract: The gravitational constant G is a particularly important par… read moreAbstract: The gravitational constant G is a particularly important parameter in artificial physics optimisation (APO) because it influences the algorithm's convergence. APO is a population-based heuristic whose swarm at each step can be divided into two distinct subsets: a divergent subset, and a convergent subset, the former containing all individuals exhibiting divergent behaviour, and the latter all others exhibiting convergent behaviour. How APO's population is apportioned between the divergent and convergent subsets is largely determined by the value of G. Two strategies for assigning its value were studied: a constant G, and an adaptive G. The disadvantage of the constant G case is mitigated by adaptive G by tuning the swarm's distribution between the two subsets. These strategies for selecting G were tested against several benchmark functions, and the results show that APO with an adaptive G outperforms APO with a constant G. read less NOT USED (high confidence) L. He, D. Polsin, S. Zhang, G. W. Collins, and N. Abdolrahim, “Phase transformation path in Aluminum under ramp compression; simulation and experimental study,” Scientific Reports. 2021. link Times cited: 7 NOT USED (high confidence) H. Xie, Y. Kang, H. Song, J.-G. Guo, and Q. Zhang, “In situ method for stress measurements in film-substrate electrodes during electrochemical processes: key role of softening and stiffening,” Acta Mechanica Sinica. 2020. link Times cited: 14 NOT USED (high confidence) J. Godet, T. Bunjaku, and M. Luisier, “Empirical potential optimization for the investigation of lithiation-delithiation cycles of amorphous Si nanowires,” Physical Review Materials. 2020. link Times cited: 1 NOT USED (high confidence) L. Selis and J. Seminario, “Dendrite formation in Li-metal anodes: an atomistic molecular dynamics study,” RSC Advances. 2019. link Times cited: 22 Abstract: Lithium-metal is a desired material for anodes of Li-ion and… read moreAbstract: Lithium-metal is a desired material for anodes of Li-ion and beyond Li-ion batteries because of its large theoretical specific capacity of 3860 mA h g−1 (the highest known so far), low density, and extremely low potential. Unfortunately, there are several problems that restrict the practical application of lithium-metal anodes, such as the formation of dendrites and reactivity with electrolytes. We present here a study of lithium dendrite formation on a Li-metal anode covered by a cracked solid electrolyte interface (SEI) of LiF in contact with a typical liquid electrolyte composed of 1 M LiPF6 salt solvated in ethylene carbonate. The study uses classical molecular dynamics on a model nanobattery. We tested three ways to charge the nanobattery: (1) constant current at a rate of one Li+ per 0.4 ps, (2) pulse train 10 Li+ per 4 ps, and (3) constant number ions in the electrolyte: one Li+ enters the electrolyte from the cathode as one Li+ exits the electrolyte to the anode. We found that although the SEI does not interfere with the lithiation, the mere presence of a crack in the SEI boosts and guides dendrite formation at temperatures between 325 K and 410.7 K at any C-rate, being more favorable at 325 K than at 410.7 K. On the other hand, we find that a higher C-rate (2.2C) favors the lithium dendrite formation compared to a lower C-rate (1.6C). Thus the battery could store more energy in a safe way at a lower C-rate. read less NOT USED (high confidence) H. Yang and J. Qu, “Fracture toughness of LixSi alloys in lithium ion battery,” Extreme Mechanics Letters. 2019. link Times cited: 7 Abstract: Fundamental understanding of the fracture toughness of the L… read moreAbstract: Fundamental understanding of the fracture toughness of the LixSi alloys is crucial for designing of Si based high-capacity and failure-resistant electrodes. In this study, molecular dynamics simulation informed continuum chemo-mechanical modelings with conservation integrals were conducted to derive fracture toughness of LixSi alloys. Our modeling results show reasonable agreement with available experimental data, revealing that the fracture toughness of LixSi alloys with low lithium concentration does not vary significantly with lithium concentration. In addition, we demonstrated that, if lithium redistribution caused by the stress gradient around crack tip needs to be considered, an appropriate chemo-mechanical path-independent J-integral should be used as the classic Rice's J-integral is path-dependent. The obtained fracture toughness of the LixSi alloys here provides guidance for the rational design of Si based electrodes, and the presented approach also sheds light for the evaluation of the fracture toughness of other energy materials at different charging/discharging levels. read less NOT USED (high confidence) B. Liu, Y. Li, Y. Yue, Y. Tao, Z. Qin, and C. Cheng, “Molecular Dynamics Investigation on the Phosphorus Doping Effects on the Mechanical Properties of Crystal Silicon,” DEStech Transactions on Engineering and Technology Research. 2019. link Times cited: 0 Abstract: The effects of phosphorus (P), one of the most common impuri… read moreAbstract: The effects of phosphorus (P), one of the most common impurities in silicon (Si), on the mechanical responses of crystal Si (c-Si) under tension are investigated using molecular dynamics with a Modified Embedded Atom Method (MEAM) potential. Tensile tests at 300K are applied for bulk c-Si with uniformly distributed and aggregated P impurities, notched c-Si films with P doping on the crack tip or at the middle of the crack propagation path. For bulk c-Si, local defects come into being around P, then rapidly nucleate and propagate, finally lead to brittle fracture. The fracture threshold decreases as the concentration increases, no matter P atoms are uniformly distributed or regionally aggregated. However, for notched c-Si film, P can evidently enhance its fracture strength by blocking the origin and propagation of cracks. With regard to Si-based micro/nano structures, fracture usually starts from the surface, indicating that P impurities play a critical role on the surface. read less NOT USED (high confidence) Y. Lu, A. Soh, Y. Ni, and L. He, “Understanding size-dependent migration of a two-phase lithiation front coupled to stress,” Acta Mechanica. 2018. link Times cited: 0 NOT USED (high confidence) Y. Lu, A. Soh, Y. Ni, and L. He, “Understanding size-dependent migration of a two-phase lithiation front coupled to stress,” Acta Mechanica. 2018. link Times cited: 9 NOT USED (high confidence) J. Yin, X. Shao, B. Lu, Y. Song, and J. Zhang, “Two-way coupled analysis of lithium diffusion and diffusion induced finite elastoplastic bending of bilayer electrodes in lithium-ion batteries,” Applied Mathematics and Mechanics. 2018. link Times cited: 7 NOT USED (high confidence) J. Yin, X. Shao, B. Lu, Y. Song, and J. Zhang, “Two-way coupled analysis of lithium diffusion and diffusion induced finite elastoplastic bending of bilayer electrodes in lithium-ion batteries,” Applied Mathematics and Mechanics. 2018. link Times cited: 0 NOT USED (high confidence) C. Chang, X. Li, and Z. Xu, “Microstructure- and concentration-dependence of lithium diffusion in the silicon anode: Kinetic Monte Carlo simulations and complex network analysis,” Applied Physics Letters. 2018. link Times cited: 11 Abstract: Diffusion of lithium atoms in the silicon anode is a key pro… read moreAbstract: Diffusion of lithium atoms in the silicon anode is a key process for the lithiation and de-lithiation steps in lithium-ion batteries. The relationship between atomic structures of silicon, in forms of crystals and glasses, and the diffusivity of lithium atoms are thus of critical importance to assess the performance of batteries using silicon as the anode. In this work, we probe the microstructure- and concentration-dependence of lithium diffusivity in silicon samples prepared in both crystalline and amorphous phases, by performing molecular dynamics and kinetic Monte Carlo simulations. We find that the diffusivity in the crystalline sample decreases with the concentration due to the blockade effect, while those in the amorphous samples increase first with the concentration as the sites with higher binding energies are occupied, activating long-distance diffusion between sites with lower binding energies, and then decline due to the blockage of diffusion pathways at a high lithium concentration. Complex network analysis of the transport pathway is conducted to measure the underlying microstructure-diffusivity correlation and statistical principles. The methodology and conclusions can be generalized to study the diffusive processes in media with complex microstructures, offering microscopic mechanisms-based understandings.Diffusion of lithium atoms in the silicon anode is a key process for the lithiation and de-lithiation steps in lithium-ion batteries. The relationship between atomic structures of silicon, in forms of crystals and glasses, and the diffusivity of lithium atoms are thus of critical importance to assess the performance of batteries using silicon as the anode. In this work, we probe the microstructure- and concentration-dependence of lithium diffusivity in silicon samples prepared in both crystalline and amorphous phases, by performing molecular dynamics and kinetic Monte Carlo simulations. We find that the diffusivity in the crystalline sample decreases with the concentration due to the blockade effect, while those in the amorphous samples increase first with the concentration as the sites with higher binding energies are occupied, activating long-distance diffusion between sites with lower binding energies, and then decline due to the blockage of diffusion pathways at a high lithium concentration. Complex n... read less NOT USED (high confidence) L. Li et al., “Self-heating–induced healing of lithium dendrites,” Science. 2018. link Times cited: 329 Abstract: Healing away the dendrites The formation of lithium dendrite… read moreAbstract: Healing away the dendrites The formation of lithium dendrites during charge-discharge cycles limits the development of lithium metal batteries, because the dendrites can cause electrical shorting of the cells. A number of tricks have been used to try to prevent dendrite formation. Li et al. took the opposite approach (see the Perspective by Mukhopadhyay and Jangid). They operated their cells at higher current densities, under which one would expect dendrites to form owing to the higher nucleation rates. However, under these conditions, the dendrites that started to form heated up and annealed, leading to their disappearance. Science, this issue p. 1513; see also p. 1463 Lithium metal dendrites can be healed in situ by Joule self-heating of the dendritic particles. Lithium (Li) metal electrodes are not deployable in rechargeable batteries because electrochemical plating and stripping invariably leads to growth of dendrites that reduce coulombic efficiency and eventually short the battery. It is generally accepted that the dendrite problem is exacerbated at high current densities. Here, we report a regime for dendrite evolution in which the reverse is true. In our experiments, we found that when the plating and stripping current density is raised above ~9 milliamperes per square centimeter, there is substantial self-heating of the dendrites, which triggers extensive surface migration of Li. This surface diffusion heals the dendrites and smoothens the Li metal surface. We show that repeated doses of high-current-density healing treatment enables the safe cycling of Li-sulfur batteries with high coulombic efficiency. read less NOT USED (high confidence) B. Onat, E. D. Cubuk, B. Malone, and E. Kaxiras, “Implanted neural network potentials: Application to Li-Si alloys,” Physical Review B. 2018. link Times cited: 52 Abstract: Modeling the behavior of materials composed of elements with… read moreAbstract: Modeling the behavior of materials composed of elements with different bonding and electronic structure character for large spatial and temporal scales and over a large compositional range, is a challenging problem. A case in point are amorphous alloys of Si, a prototypical covalent material, and Li, a prototypical metal, which are being considered as anodes for high-energydensity batteries. To address this challenge, we develop a methodology based on neural networks, that extends the conventional training approach to incorporate pre-trained parts that capture the character of different components, into the overall network; we refer to this model as the “implanted neural network” method. We show that this approach works well for the Si-Li amorphous alloys for a wide range of compositions, giving good results for key quantities like the diffusion coefficients. The method is readily generalizable to more complicated situations that involve two or more different elements. read less NOT USED (high confidence) L. Selis and J. Seminario, “Dendrite formation in silicon anodes of lithium-ion batteries,” RSC Advances. 2018. link Times cited: 42 Abstract: Rechargeable lithium-ion batteries require a vigorous improv… read moreAbstract: Rechargeable lithium-ion batteries require a vigorous improvement if we want to use them massively for high energy applications. Silicon and metal lithium anodes are excellent alternatives because of their large theoretical capacity when compared to graphite used in practically all rechargeable Li-ion batteries. However, several problems need to be addressed satisfactorily before a major fabrication effort can be launched; for instance, the growth of lithium dendrites is one of the most important to take care due to safety issues. In this work we attempt to predict the mechanism of dendrite growth by simulating possible behaviors of charge distributions in the anode of an already cracked solid electrolyte interphase of a nanobattery, which is under the application of an external field representing the charging of the battery; thus, elucidating the conditions for dendrite growth. The extremely slow drift velocity of the Li-ions of ∼1 mm per hour in a typical commercial Li-ion battery, makes the growth of a dendrite take a few hours; however, once a Li-ion arrives at an active site of the anode, it takes an extremely short time of ∼1 ps to react. This large difference in time-scales allows us to perform the molecular dynamics simulation of the ions at much larger drift velocities, so we can have valuable results in reasonable computational times. The conditions before the growth are assumed and conditions that do not lead to the growth are ignored. We performed molecular dynamics simulations of a pre-lithiated silicon anode with a Li : Si ratio of 21 : 5, corresponding to a fully charged battery. We simulate the dendrite growth by testing a few charge distributions in a nanosized square representing a crack of the solid electrolyte interphase, which is where the electrolyte solution comes into direct contact with the LiSi alloy anode. Depending on the selected charge distributions for such an anode surface, the dendrites grow during the simulation when an external field is applied. We found that dendrites grow when strong deviations of charge distributions take place on the surface of the crack. Results from this work are important in finding ways to constrain lithium dendrite growth using tailored coatings or pre-coatings covering the LiSi alloy anode. read less NOT USED (high confidence) K. K. Bejagam, S. Singh, and S. A. Deshmukh, “Development of non‐bonded interaction parameters between graphene and water using particle swarm optimization,” Journal of Computational Chemistry. 2017. link Times cited: 14 Abstract: New Lennard‐Jones parameters have been developed to describe… read moreAbstract: New Lennard‐Jones parameters have been developed to describe the interactions between atomistic model of graphene, represented by REBO potential, and five commonly used all‐atom water models, namely SPC, SPC/E, SPC/Fw, SPC/Fd, and TIP3P/Fs by employing particle swarm optimization (PSO) method. These new parameters were optimized to reproduce the macroscopic contact angle of water on a graphene sheet. The calculated line tension was in the order of 10−11 J/m for the droplets of all water models. Our molecular dynamics simulations indicate the preferential orientation of water molecules near graphene–water interface with one OH bond pointing toward the graphene surface. Detailed analysis of simulation trajectories reveals the presence of water molecules with ≤∼1, ∼2, and ∼4 hydrogen bonds at the surface of air–water interface, graphene–water interface, and bulk region of the water droplet, respectively. Presence of water molecules with ≤∼1 and ∼2 hydrogen bonds suggest the existence of water clusters of different sizes at these interfaces. The trends observed in the libration, bending, and stretching bands of the vibrational spectra are closely associated with these structural features of water. The inhomogeneity in hydrogen bond network of water at the air–water and graphene–water interface is manifested by broadening of the peaks in the libration band for water present at these interfaces. The stretching band for the molecules in water droplet shows a blue shift as compared to the pure bulk water, which conjecture the presence of weaker hydrogen bond network in a droplet. © 2017 Wiley Periodicals, Inc. read less NOT USED (high confidence) M. Zhang, J. Qu, and J. Rice, “Path independent integrals in equilibrium electro-chemo-elasticity,” Journal of The Mechanics and Physics of Solids. 2017. link Times cited: 18 NOT USED (high confidence) X. Wang, W. Shen, X. Huang, J. Zang, and Y.-pu Zhao, “Estimating the thickness of diffusive solid electrolyte interface,” Science China Physics, Mechanics & Astronomy. 2017. link Times cited: 20 NOT USED (high confidence) D. E. Galvez-Aranda, V. Ponce, and J. Seminario, “Molecular dynamics simulations of the first charge of a Li-ion—Si-anode nanobattery,” Journal of Molecular Modeling. 2017. link Times cited: 25 NOT USED (high confidence) X. Lu, Y. He, S. Mao, C. Wang, and B. Korgel, “Size Dependent Pore Formation in Germanium Nanowires Undergoing Reversible Delithiation Observed by In Situ TEM,” Journal of Physical Chemistry C. 2016. link Times cited: 9 Abstract: Germanium (Ge) nanowires coated with an amorphous silicon (S… read moreAbstract: Germanium (Ge) nanowires coated with an amorphous silicon (Si) shell undergoing lithiation and delithiation were studied using in situ transmission electron microscopy (TEM). Delithiation creates pores in nanowires with diameters larger than ∼25 nm, but not in smaller diameter nanowires. The formation of pores in Ge nanowires undergoing delithiation has been observed before in in situ TEM experiments, but there has been no indication that a critical diameter exists below which pores do not form. Pore formation occurs as a result of fast lithium diffusion compared to vacancy migration. We propose that a short diffusion path for vacancies to the nanowire surface plays a role in limiting pore formation even when lithium diffusion is fast. read less NOT USED (high confidence) V. Imandi and A. Chatterjee, “Estimating Arrhenius parameters using temperature programmed molecular dynamics.,” The Journal of chemical physics. 2016. link Times cited: 24 Abstract: Kinetic rates at different temperatures and the associated A… read moreAbstract: Kinetic rates at different temperatures and the associated Arrhenius parameters, whenever Arrhenius law is obeyed, are efficiently estimated by applying maximum likelihood analysis to waiting times collected using the temperature programmed molecular dynamics method. When transitions involving many activated pathways are available in the dataset, their rates may be calculated using the same collection of waiting times. Arrhenius behaviour is ascertained by comparing rates at the sampled temperatures with ones from the Arrhenius expression. Three prototype systems with corrugated energy landscapes, namely, solvated alanine dipeptide, diffusion at the metal-solvent interphase, and lithium diffusion in silicon, are studied to highlight various aspects of the method. The method becomes particularly appealing when the Arrhenius parameters can be used to find rates at low temperatures where transitions are rare. Systematic coarse-graining of states can further extend the time scales accessible to the method. Good estimates for the rate parameters are obtained with 500-1000 waiting times. read less NOT USED (high confidence) B. Xu, “Silicon-Based Anode Materials for Lithium-Ion Batteries.” 2016. link Times cited: 15 Abstract: ............................................................… read moreAbstract: ................................................................................................................................................ I Acknowledgements .......................................................................................................................... VII read less NOT USED (high confidence) S. Chang, J. Moon, and M. Cho, “Stress-diffusion coupled multiscale analysis of Si anode for Li-ion battery†,” Journal of Mechanical Science and Technology. 2015. link Times cited: 15 NOT USED (high confidence) S. Chang, J. Moon, and M. Cho, “Stress-diffusion coupled multiscale analysis of Si anode for Li-ion battery†,” Journal of Mechanical Science and Technology. 2015. link Times cited: 0 NOT USED (high confidence) L. Liu, C. Cheng, H. Liu, L. Shi, and D. Wang, “Using Carboxylmethylated Cellulose as Water-Borne Binder to Enhance the Electrochemical Properties of Li 4 Ti 5 O 12 -Based Anodes,” Journal of Korean Powder Metallurgy Institute. 2015. link Times cited: 0 Abstract: The present work reports a systematic study of using carboxy… read moreAbstract: The present work reports a systematic study of using carboxymethylated cellulose (CMC) as water-bornebinder to produce Li 4 Ti 5 O 12 -based anodes for manufacture of high rate performance lithium ion batteries. When theLTO-to-CB-to-CMC mass ratio is carefully optimized to be 8:1:0.57, the special capacity of the resulting electrodes is144 mAh·g − 1 at 10 C and their capacity retention was 97.7% after 1000 cycles at 1 C and 98.5% after 500 cycles at5 C, respectively. This rate performance is comparable or even better than that of the electrolytes produced using con-ventional, organic, polyvinylidene fluoride binder. Keywords: Lithium titanate, CMC binder, Electrochemical properties, Long cycle life ······························································································································· ································································································· 1. Introduction Exhaust gas emitted from vehicles is one of the big-gest contributions to the increasingly serious environmen-tal pollution nowadays. Over the years, a considerablenumber of efforts have been put in development of envi-ronmental-friendly, green fuels for automobiles instead offossil fuels [1-3]. In this context, electric vehicles (EVs)and energy storage station (ESS) have been recentlydeveloped on the basis of use of high performance lith-ium ion batteries (LIBs) with long cycle life and highenergy density [4-9]. However, the stability and safety ofLIBs remain the big technical concerns, which limits thecommercialization of LIB [10,11]. To address these issues,novel electrode materials with larger lithium ion storageat high rate have been developed [12]. Among currently developed anode materials, spinelLi read less NOT USED (high confidence) K. Zhang, Y. Li, and B. Zheng, “Effects of concentration-dependent elastic modulus on Li-ions diffusion and diffusion-induced stresses in spherical composition-gradient electrodes,” Journal of Applied Physics. 2015. link Times cited: 32 Abstract: The composition-gradient electrode material is considered as… read moreAbstract: The composition-gradient electrode material is considered as one of the most promising materials for lithium-ion batteries because of its excellent electrochemical performance and thermal stability. In this work, the effects of concentration-dependent elastic modulus on Li-ions diffusion and diffusion-induce stress in the composition-gradient electrodes were studied. The coupling equations of elasticity and diffusion under both potentiostatic charging and galvanostatic charging were developed to obtain the distributions of both the Li-ions concentration and the stress. The results indicated that the effects of the concentration-dependent elastic modulus on the Li-ions diffusion and the diffusion-induce stresses are controlled by the lithiation induced stiffening factor in the composition-gradient electrodes: a low stiffening factor at the center and a high stiffening factor at the surface lead to a significant effect, whereas a high stiffening factor at the center and a low stiffening factor at the surface result in a minimal effect. The results in this work provide guidance for the selection of electrode materials. read less NOT USED (high confidence) E. Peled, F. Patolsky, D. Golodnitsky, K. Freedman, G. Davidi, and D. Schneier, “Tissue-like Silicon Nanowires-Based Three-Dimensional Anodes for High-Capacity Lithium Ion Batteries.,” Nano letters. 2015. link Times cited: 103 Abstract: Here, we report on the scalable synthesis and characterizati… read moreAbstract: Here, we report on the scalable synthesis and characterization of novel architecture three-dimensional (3D) high-capacity amorphous silicon nanowires (SiNWs)-based anodes with focus on studying their electrochemical degradation mechanisms. We achieved an unprecedented combination of remarkable performance characteristics, high loadings of 3-15 mAh/cm(2), a very low irreversible capacity (10% for the 3-4 mAh/cm(2) anodes), current efficiency greater than 99.5%, cycle stability (both in half cells and a LiFePO4 battery), a total capacity of 457 mAh/cm(2) over 204 cycles and fast charge-discharge rates (up to 2.7C at 20 mA/cm(2)). These SiNWs-based binder-free 3D anodes have been cycled for over 200 cycles, exhibiting a stable cycle life. Notably, it was found that the growth of the continuous SEI layer thickness, and its concomitant increase in resistivity, represents the major reason for the observed capacity loss of the SiNWs-based anodes. Importantly, these NWs-based anodes of novel architecture meet the requirements of lithium batteries for future portable, and electric-vehicle, applications. read less NOT USED (high confidence) S. Groh and M. Alam, “Fracture behavior of lithium single crystal in the framework of (semi-)empirical force field derived from first-principles,” Modelling and Simulation in Materials Science and Engineering. 2015. link Times cited: 11 Abstract: An approach to derive, from first-principles data, accurate … read moreAbstract: An approach to derive, from first-principles data, accurate and reliable potentials in the modified embedded-atom method in view of modeling the mechanical behavior of metals is presented in this work and applied to the optimization of a potential representative of lithium (Li). Although the theoretical background of the modified embedded-atom method was considered in this work, the proposed method is general and it can be applied to any other functional form. The main feature of the method is to introduce several path transformations in the material database that are critical for plastic and failure behavior. As part of the potential validation, path transformations different from the ones used for the parameterization procedure are considered. Applied in the case of Li, the material database was enriched with the generalized stacking fault energy curve along the <1 1 1> -direction on the {1 1 0}-plane, and with the traction-separation behavior of a {1 0 0}-surface. The path transformations used to enrich the material database were initially derived from first-principles calculations. For validation, the generalized stacking fault energy curves along the <1 1 1> -direction on the {1 1 2}- and {1 2 3}-planes were considered for plasticity, while traction-separation behavior of {1 1 0} and {1 1 1}-planes were considered for failure behavior. As part of the validation procedure, the predictions made in the MEAM framework were validated by first-principles data. The final potential accurately reproduced basic equilibrium properties, elastic constants, surface energies in agreement with first-principles predictions, and transition energy between different crystal structures. Furthermore, generalized stacking fault energy curves along the <1 1 1> -direction on the {1 1 0}, {1 1 2}, and {1 2 3}-planes, and tensile cohesive stress, characteristic length of fracture, and work of separation of a {1 0 0}, {1 1 0}, and {1 1 1} surfaces obtained in the MEAM framework compared well with first-principles predictions. It also predicts good elastic constants for a crystal structure different than the one used for the fitting of the potential and the other four path transformations. The potential was tested for failure behavior using a full atomistic setup, and in addition of being qualitatively correct, the stress intensity factor for different crack orientations was found to be in agreement with the theory of Rice (1992 J. Mech. Phys. Solids 40 239–71) within an error of 10%. Finally, the optimized Li-MEAM potential is expected to be transferable to different local environments encountered in atomistic simulations of lattice defects. read less NOT USED (high confidence) J. Seo et al., “Ultrafast chemical lithiation of single crystalline silicon nanowires: in situ characterization and first principles modeling,” RSC Advances. 2015. link Times cited: 10 Abstract: Through a combined density functional theory and in situ sca… read moreAbstract: Through a combined density functional theory and in situ scanning electron microscopy study, we provide evidence of the ultrafast chemical lithiation of a single crystalline Si nanowire which is brought into direct contact with Li metal in the absence of an applied external electric field. Unlike the previous in situ lithiation results, the ultra-fast lithiation process in this study is purely driven by the concentration gradient and is found to be limited by Li diffusion through the pristine/lithiated Si phase boundary. The experimental and calculated lithiation speeds are in excellent agreement at around 1 μm s−1, corresponding to a high Li diffusivity value of about 10−9 cm2 s−1. The improved understanding of lithiation kinetics may contribute to the design of higher-power Si-based anodes. read less NOT USED (high confidence) M. M. Islam et al., “ReaxFF molecular dynamics simulations on lithiated sulfur cathode materials.,” Physical chemistry chemical physics : PCCP. 2015. link Times cited: 95 Abstract: Sulfur is a very promising cathode material for rechargeable… read moreAbstract: Sulfur is a very promising cathode material for rechargeable energy storage devices. However, sulfur cathodes undergo a noticeable volume variation upon cycling, which induces mechanical stress. In spite of intensive investigation of the electrochemical behavior of the lithiated sulfur compounds, their mechanical properties are not very well understood. In order to fill this gap, we developed a ReaxFF interatomic potential to describe Li-S interactions and performed molecular dynamics (MD) simulations to study the structural, mechanical, and kinetic behavior of the amorphous lithiated sulfur (a-LixS) compounds. We examined the effect of lithiation on material properties such as ultimate strength, yield strength, and Young's modulus. Our results suggest that with increasing lithium content, the strength of lithiated sulfur compounds improves, although this increment is not linear with lithiation. The diffusion coefficients of both lithium and sulfur were computed for the a-LixS system at various stages of Li-loading. A grand canonical Monte Carlo (GCMC) scheme was used to calculate the open circuit voltage profile during cell discharge. The Li-S binary phase diagram was constructed using genetic algorithm based tools. Overall, these simulation results provide insight into the behavior of sulfur based cathode materials that are needed for developing lithium-sulfur batteries. read less NOT USED (high confidence) M. Pharr, Z. Suo, and J. Vlassak, “Variation of stress with charging rate due to strain-rate sensitivity of silicon electrodes of Li-ion batteries,” Journal of Power Sources. 2014. link Times cited: 91 NOT USED (high confidence) Z. Cui and L. Brinson, “A combination optimisation method for the estimation of material parameters for viscoelastic solids,” Int. J. Comput. Sci. Math. 2014. link Times cited: 4 Abstract: In the current work, we propose a two-step optimisation meth… read moreAbstract: In the current work, we propose a two-step optimisation method to determine the coefficients of the Prony series expansion for a viscoelastic constitutive model by combining the benefits of particle swarm optimisation and linear least square solver. The entire fitting progress is decoupled and divided into two portions. Each optimisation approach is used for obtaining one set of parameters. This method overcomes the usual difficulties of original function determinations and could find the global optimal solution with a high precision. The quality of the developed method is verified by three examples on both time-domain and frequency-domain experimental data. Simulation results are consistent with corresponding experimental data, showing that the new technique is valid and applicable for estimating structural properties of viscoelastic materials. read less NOT USED (high confidence) H. Lee and B.-J. Lee, “Structural changes during lithiation and delithiation of Si anodes in Li-ion batteries: A large scale molecular dynamics study,” Metals and Materials International. 2014. link Times cited: 10 NOT USED (high confidence) X. Song, Y. Zhou, J. He, W. Xu, H. Wang, and X. Liu, “Nanoscale phase stability in Li ion battery anode materials,” RSC Advances. 2014. link Times cited: 3 Abstract: A thermodynamic model was developed in particular for nanocr… read moreAbstract: A thermodynamic model was developed in particular for nanocrystalline partially ionic solids, which represent a group of Li ion battery anode materials. The lithium compounds were used as examples to demonstrate the model applications in studies of phase stability and phase transformation behavior in the nanoscale anode system. The peritectic and eutectic transformations were described systematically concerning the reaction temperatures and liquid concentrations at various equilibria, in which the grain size effects on the equilibrium, stability and transformation of Li-containing phases were quantified. To verify the model predictions, a series of experiments were performed using the nanocrystalline Li–Si system as sample materials. The experimental finding confirmed the model calculations, based on which the correlation of phase stability, temperature, grain size and critical grain size was proposed. read less NOT USED (high confidence) W. Guo, W. Li, Q. Zhang, L. Wang, Q. Wu, and H. Ren, “Biogeography-based particle swarm optimization with fuzzy elitism and its applications to constrained engineering problems,” Engineering Optimization. 2014. link Times cited: 47 Abstract: In evolutionary algorithms, elites are crucial to maintain g… read moreAbstract: In evolutionary algorithms, elites are crucial to maintain good features in solutions. However, too many elites can make the evolutionary process stagnate and cannot enhance the performance. This article employs particle swarm optimization (PSO) and biogeography-based optimization (BBO) to propose a hybrid algorithm termed biogeography-based particle swarm optimization (BPSO) which could make a large number of elites effective in searching optima. In this algorithm, the whole population is split into several subgroups; BBO is employed to search within each subgroup and PSO for the global search. Since not all the population is used in PSO, this structure overcomes the premature convergence in the original PSO. Time complexity analysis shows that the novel algorithm does not increase the time consumption. Fourteen numerical benchmarks and four engineering problems with constraints are used to test the BPSO. To better deal with constraints, a fuzzy strategy for the number of elites is investigated. The simulation results validate the feasibility and effectiveness of the proposed algorithm. read less NOT USED (high confidence) X. Cai, L. Wang, Q. Kang, and Q. Wu, “Bat algorithm with Gaussian walk,” Int. J. Bio Inspired Comput. 2014. link Times cited: 52 Abstract: Bat algorithm is a novel branch of evolutionary computation.… read moreAbstract: Bat algorithm is a novel branch of evolutionary computation. Although there are several research papers that focus on this new algorithm, however, few of them concerns the high-dimensional numerical problems. In this paper, a new variant called bat algorithm with Gaussian walk BAGW is proposed aiming to solve this problem. In this variant, a Gaussian walk is employed in the local turbulence instead of the original uniform walk to improve the local search capability. Furthermore, to keep the high exploitation pressure, the velocity update equation is also changed. Finally, to increase the population diversity, the frequency is dominated by each dimension in our modification, as well as it is depended on the different bat in the standard version. To test the performance of our variant, four famous un-constraint numerical benchmarks are employed, and test on different dimensional cases, simulation results show our modification is effective. read less NOT USED (high confidence) S. Yang, Z. Cui, and J. Qu, “A coarse-grained model for epoxy molding compound.,” The journal of physical chemistry. B. 2014. link Times cited: 56 Abstract: We present a coarse-grained model for molecular dynamics sim… read moreAbstract: We present a coarse-grained model for molecular dynamics simulations of an epoxy system composed of epoxy phenol novolac as epoxy monomer and bisphenol-A as the cross-linking agent. The epoxy and hardener molecules are represented as short chains of connected beads, and cross-linking is accomplished by introducing bonds between reactive beads. The interbead potential, composed of Lennard-Jones, bond stretching, and angle bending terms, is parametrized through an optimization process based on a particle swarm optimization method to fit certain key thermomechanical properties of the material obtained from experiments and previous full atomistic simulations. The newly developed coarse-grained model is capable of predicting a number of thermomechanical properties of the epoxy system. The predictions are in very good agreement with available data in the literature. More importantly, our coarse-grained model is capable of predicting tensile failure of the epoxy system, a capability that no other conventional molecular dynamic simulation model has. Finally, our coarse-grained model can speed up the simulations by more than an order of magnitude when compared with traditional molecular dynamic simulations. read less NOT USED (high confidence) T. Zhang and Z. Guo, “Effects of electrode properties and fabricated pressure on Li ion diffusion and diffusion-induced stresses in cylindrical Li-ion batteries,” Modelling and Simulation in Materials Science and Engineering. 2014. link Times cited: 8 Abstract: The effects of electrode properties and fabricated pressure … read moreAbstract: The effects of electrode properties and fabricated pressure on Li ion diffusion and diffusion-induced stress in a cylindrical Li-ion battery are studied. It is found that hydrostatic pressure or elastic modulus variation in the active layer have little effect on the distribution of Li ions for a higher diffusivity coefficient, but both can facilitate Li ion diffusion for a lower diffusivity coefficient. The elastic modulus variation has a significant effect on the distribution of stress and hydrostatic pressure can reduce the surface stress for the lower diffusivity coefficient. A higher charging rate causes a more transient response in the stress history, but a linear charging history is observed for slow charging rates. A higher charging rate would not inflict extra damage on the electrode for the higher diffusivity coefficient and the stress history becomes highly transient and charging rate dependent for the lower diffusivity coefficient. The effect of fabricated pressure can be neglected. read less NOT USED (high confidence) Z. Zhu, “Using Watts-Strogatz particle swarm optimisation to solve direct orbits of chaotic systems,” Int. J. Comput. Sci. Math. 2013. link Times cited: 3 Abstract: Watts-Strogatz particle swarm optimisation WSPSO is a new va… read moreAbstract: Watts-Strogatz particle swarm optimisation WSPSO is a new variant of particle swarm optimisation by employing small-world topology. In this variant, the topology of each particle is changed dynamically according to Watts-Strogatz rules within the whole evolutionary process. In this paper, WSPSO is employed to solve the directing orbits of chaotic systems, simulation results show this new variant increases the performance significantly when compared with other three variants of particle swarm optimisation. read less NOT USED (high confidence) H.-J. Wang, X. Ji, C. Chen, K. Xu, and L. Miao, “Lithium diffusion in silicon and induced structure disorder: A molecular dynamics study,” AIP Advances. 2013. link Times cited: 18 Abstract: Using molecular dynamics method, we investigate the diffusio… read moreAbstract: Using molecular dynamics method, we investigate the diffusion property of lithium in different silicon structures and silicon structure's disorder extent during lithium's diffusion process. We find that the pathway and the incident angle between the direction of barrier and diffusion of lithium are also the essential factors to the lithium's diffusion property in silicon anode besides the barrier. Smaller incident angle could decrease the scattering of lithium in silicon structure effectively. Moreover, lithium diffuses easier in the Li-Si alloy structure of higher lithium concentration with deeper injection depth. The silicon's structure will be damaged gradually during the charge and discharge process. However, it will also recover to initial state to a great extent after relaxation. Therefore, the damage of lithium diffusion to silicon anode in the structure of low lithium concentration is reversible to a great degree. In addition, the silicon structure of crystal orientation perform better properties in both lithium's diffusivity and structural stability. read less NOT USED (high confidence) F. Fan et al., “Mechanical properties of amorphous LixSi alloys: a reactive force field study,” Modelling and Simulation in Materials Science and Engineering. 2013. link Times cited: 111 Abstract: Silicon is a high-capacity anode material for lithium-ion ba… read moreAbstract: Silicon is a high-capacity anode material for lithium-ion batteries. Electrochemical cycling of Si electrodes usually produces amorphous LixSi (a-LixSi) alloys at room temperature. Despite intensive investigation of the electrochemical behaviors of a-LixSi alloys, their mechanical properties and underlying atomistic mechanisms remain largely unexplored. Here we perform molecular dynamics simulations to characterize the mechanical properties of a-LixSi with a newly developed reactive force field (ReaxFF). We compute the yield and fracture strengths of a-LixSi alloys under a variety of chemomechanical loading conditions, including the constrained thin-film lithiation, biaxial compression, uniaxial tension and compression. Effects of loading sequence and stress state are investigated to correlate the mechanical responses with the dominant atomic bonding, featuring a transition from the covalent to the metallic glass characteristics with increasing Li concentration. The results provide mechanistic insights for interpreting experiments, understanding properties and designing new experiments on a-LixSi alloys, which are essential to the development of durable Si electrodes for high-performance lithium-ion batteries. read less NOT USED (high confidence) Y. An and H. Jiang, “A finite element simulation on transient large deformation and mass diffusion in electrodes for lithium ion batteries,” Modelling and Simulation in Materials Science and Engineering. 2013. link Times cited: 39 Abstract: Lithium-ion batteries have attracted great deal of attention… read moreAbstract: Lithium-ion batteries have attracted great deal of attention recently. Silicon is one of the most promising anode materials for high-performance lithium-ion batteries, due to its highest theoretical specific capacity. However, the short lifetime confined by mechanical failure in the silicon anode is now considered to be the biggest challenge in desired applications. High stress induced by the huge volume change due to lithium insertion/extraction is the main reason underlying this problem. Some theoretical models have been developed to address this issue. In order to properly implement these models, we develop a finite element based numerical method using a commercial software package, ABAQUS, as a platform at the continuum level to study fully coupled large deformation and mass diffusion problem. Using this method, large deformation, elasticity–plasticity of the electrodes, various spatial and temporal conditions, arbitrary geometry and dimension could be fulfilled. The interaction between anode and other components of the lithium ion batteries can also be studied as an integrated system. Several specific examples are presented to demonstrate the capability of this numerical platform. read less NOT USED (high confidence) G.-ge Wang, L. Guo, A. Gandomi, A. Alavi, and H. Duan, “Simulated Annealing-Based Krill Herd Algorithm for Global Optimization,” Abstract and Applied Analysis. 2013. link Times cited: 39 Abstract: Recently, Gandomi and Alavi proposed a novel swarm intellige… read moreAbstract: Recently, Gandomi and Alavi proposed a novel swarm intelligent method, called krill herd (KH), for global optimization. To enhance the performance of the KH method, in this paper, a new improved meta-heuristic simulated annealing-based krill herd (SKH) method is proposed for optimization tasks. A new krill selecting (KS) operator is used to refine krill behavior when updating krill's position so as to enhance its reliability and robustness dealing with optimization problems. The introduced KS operator involves greedy strategy and accepting few not-so-good solutions with a low probability originally used in simulated annealing (SA). In addition, a kind of elitism scheme is used to save the best individuals in the population in the process of the krill updating. The merits of these improvements are verified by fourteen standard benchmarking functions and experimental results show that, in most cases, the performance of this improved meta-heuristic SKH method is superior to, or at least highly competitive with, the standard KH and other optimization methods. read less NOT USED (high confidence) Y.-quan Yuan, X.-guo Zeng, H. Chen, A. Yao, and Y. Hu, “Molecular dynamics simulation on microstructure evolution during solidification of copper nanoparticles,” Journal of the Korean Physical Society. 2013. link Times cited: 9 Abstract: The effect of cooling rate on the microstructure evolution o… read moreAbstract: The effect of cooling rate on the microstructure evolution of liquid Cu nanoparticles during their solidification process is investigated by using a molecular dynamics simulation based on the embedded atom method (EAM) potential developed by Foiles et al.. The potential energy analysis, the pair distribution function and the common neighbor analysis have been used. The results show that the solidification point increases with decreasing cooling rate and that the solidification of the microstructure of Cu nanoparticles varies with the cooling rate. The microstructure consists of fcc, hcp and bcc crystals or mixtures, though the fcc structure dominates, except in the amorphous state. An amorphous structure was obtained when the cooling rate reached 1.0 × 10¹³ K/s or higher while crystallization degree increased with decreasing cooling rate, and the total content of crystal structures reached to 95% when the cooling rate dropped to 4.0 × 10¹¹ K/s, which was nearly a perfect crystal structure. The results also indicate that a single-crystal nanoparticle will not be obtained by quenching the liquid metal under various cooling rates. read less NOT USED (high confidence) J. Y. Li and Z. Cui, “Reactive power optimisation of power system with APPM,” Int. J. Comput. Sci. Math. 2013. link Times cited: 6 Abstract: Artificial plant optimisation algorithm is a new stochastic … read moreAbstract: Artificial plant optimisation algorithm is a new stochastic optimisation algorithm inspired by the plant growing process. In this paper, the primary version is applied to solve reactive power optimisation of power system. To show the efficiency, IEEE118 bus systems is employed. Simulation results show it is effective. read less NOT USED (high confidence) C.-Y. Chou and G. Hwang, “Surface effects on the structure and lithium behavior in lithiated silicon: A first principles study,” Surface Science. 2013. link Times cited: 34 NOT USED (high confidence) Y. Gao and M. Zhou, “Coupled mechano-diffusional driving forces for fracture in electrode materials,” Journal of Power Sources. 2013. link Times cited: 86 NOT USED (high confidence) Z. Cui, S. Fan, J. Zeng, and Z. Shi, “APOA with parabola model for directing orbits of chaotic systems,” Int. J. Bio Inspired Comput. 2013. link Times cited: 21 Abstract: Artificial plant optimisation algorithm APOA is a recent pro… read moreAbstract: Artificial plant optimisation algorithm APOA is a recent proposed evolutionary computation in which the growing process of one tree is mapped into the optimised problem. In APOA, three new operators: photosynthesis operator, phototropism operator and apical dominance operator are designed to simulate three important phenomenon. In this paper, a new variant of APOA in which the light responsive curve of photosynthesis operator is selected as parabola model. To test the performance, this variant is applied to directing orbits of chaotic system. Simulation results show it is effective. read less NOT USED (high confidence) Z. Cui, S. Fan, J. Zeng, and Z. Shi, “Artificial plant optimisation algorithm with three-period photosynthesis,” Int. J. Bio Inspired Comput. 2013. link Times cited: 24 Abstract: In the standard version of artificial plant optimisation alg… read moreAbstract: In the standard version of artificial plant optimisation algorithm APOA, the light responsive curve of photosynthesis operator is selected as rectangular hyperbolic model. However, different light responsive curve may result in different performance, therefore, a combination of some different light responsive curves may increase the effectiveness of photosynthesis operator. In this paper, the whole evaluation process is divided into three parts, while different light responsive curve is selected in each part. With orthogonal experimental design, an optimal combination model is determined which consists of parabola model, updated rectangular hyperbolic model and straight line model, and is called three-period photosynthesis operator. To test the performance, some famous benchmarks are employed to test, and simulation results show it is effective. read less NOT USED (high confidence) A. Mozaffari, A. Goudarzi, A. Fathi, and P. Samadian, “Bio-inspired methods for fast and robust arrangement of thermoelectric modulus,” Int. J. Bio Inspired Comput. 2013. link Times cited: 14 Abstract: This paper aims to evaluate the ability of some well-known b… read moreAbstract: This paper aims to evaluate the ability of some well-known bio-inspired metaheuristics for optimal arrangement of thermoelectric cells mounted in a thermal component. In real life applications, proper arrangement of thermoelectric modules plays a pivotal role by maximising the generated electricity. However, some defects such as the increase in total maintenance cost is often associated with the use of thermoelectric cells. Hence, it is mandatory to contrive a policy which guarantees the maximum electricity generation while keeps the maintenance cost in lowest level. Here, authors use both adaptive neuro-fuzzy inference system ANFIS and experimental data to model the power generation and maintenance cost of thermoelectric cells. At the next step, they engage some famous bio-inspired metaheuristic algorithms, i.e., bee algorithm BA, particle swarm optimisation PSO and the great salmon run TGSR to arrange the thermoelectric cells in a cost effective manner. The gained results indicate that the proposed algorithms are highly capable to find an efficient arrangement for thermoelectric cells within a rational duration. Besides, through independent runs, it is observed that metaheuristics show acceptable robustness for the current case study. read less NOT USED (high confidence) M. Zhang, “Multiscale Modeling of Thermoplastic Elastomers for Enhanced Mechanical Properties.” 2018. link Times cited: 0 Abstract: ............................................................… read moreAbstract: .................................................................................................................................. 3 ACKNOWLEDGEMENT ............................................................................................................ 5 Table of read less NOT USED (high confidence) A. P. Moore, C. Deo, M. Baskes, M. Okuniewski, and D. McDowell, “Understanding the uncertainty of interatomic potentials’ parameters and formalism,” Computational Materials Science. 2017. link Times cited: 17 NOT USED (high confidence) Y. Liu and Z. Xu, “Time-varying social emotional optimisation algorithm,” Int. J. Comput. Sci. Math. 2012. link Times cited: 10 Abstract: Social emotional optimisation algorithm SEOA is a recently p… read moreAbstract: Social emotional optimisation algorithm SEOA is a recently proposed swarm intelligent algorithm by simulating the decision process among human society. In SEOA, each individual denotes one virtual person, and three different kinds of emotions are designed: low-spirited, middle-spirited and high-spirited, then, each person selects the behaviour emotion according to emotional index. In the standard version of SEOA, there are three parameters used to control the influences of personal experiences, social experiences and failure experiences, however, all of them are designed as fixed values. This phenomenon is confused with the nature. In fact, the influences of these experiences are different for different period. For example, individual experiences are more important for the early period, the same as failure experiences, while the social experiences are more important in the later period. Therefore, to meet this phenomenon, a dynamic time-varying strategy is designed. To testify the performance of modified SEOA, three famous benchmarks are chosen, they are Rosenbrock model, Rastrigin model and Griewank model. The dimension is from 30 up to 300. Simulation results show this modification improves the performance significantly especially for multimodal, high-dimensional problems. read less NOT USED (high confidence) X. Cai, S. Fan, and Y. Tan, “Light responsive curve selection for photosynthesis operator of APOA,” Int. J. Bio Inspired Comput. 2012. link Times cited: 28 Abstract: Artificial plant optimisation algorithm (APOA) is a recent p… read moreAbstract: Artificial plant optimisation algorithm (APOA) is a recent proposed evolutionary computation methodology in which the growing process of one tree is mapped into the optimised problem. In APOA, three new operators: photosynthesis operator, phototropism operator and apical dominance operator are designed to simulate three important phenomenon. In the standard version of APOA, the light responsive curve of photosynthesis operator is selected as rectangular hyperbolic model which is only a general one. However, we argue whether the rectangular hyperbolic model provide the best average performance? In this paper, seven classical models are chosen to investigate, they are: rectangular hyperbolic model, non-rectangular hyperbolic model, updated rectangular hyperbolic model, parabola model, straight line model and two exponential curve models. To test the performance, eleven benchmarks are selected. In each experiment, the light responsive curve is translated by the corresponding model. Simulation results show the average performance of parabola model is best when compared with other six models. read less NOT USED (definite) E. Meca, A. Münch, and B. Wagner, “Thin-film electrodes for high-capacity lithium-ion batteries: influence of phase transformations on stress,” Proceedings of the Royal Society A: Mathematical, Physical and Engineering Sciences. 2016. link Times cited: 6 Abstract: In this study, we revisit experiments by Sethuraman et al. (… read moreAbstract: In this study, we revisit experiments by Sethuraman et al. (2010 J. Power Sources, 195, 5062–5066. (doi:10.1016/j.jpowsour.2010.02.013)) on the stress evolution during the lithiation/delithiation cycle of a thin film of amorphous silicon. Based on recent work that show a two-phase process of lithiation of amorphous silicon, we formulate a phase-field model coupled to elasticity in the framework of Larché-Cahn. Using an adaptive nonlinear multigrid algorithm for the finite-volume discretization of this model, our two-dimensional numerical simulations show the formation of a sharp phase boundary between the lithiated and the amorphous silicon that continues to move as a front through the thin layer. We show that our model captures the non-monotone stress loading curve and rate dependence, as observed in recent experiments and connects characteristic features of the curve with the structure formation within the layer. We take advantage of the thin film geometry and study the corresponding one-dimensional model to establish the dependence on the material parameters and obtain a comprehensive picture of the behaviour of the system. read less NOT USED (definite) H. Haftbaradaran and J. Qu, “Two-dimensional chemo-elasticity under chemical equilibrium,” International Journal of Solids and Structures. 2015. link Times cited: 25 NOT USED (definite) H. Haftbaradaran and J. Qu, “A path-independent integral for fracture of solids under combined electrochemical and mechanical loadings,” Journal of The Mechanics and Physics of Solids. 2014. link Times cited: 44 NOT USED (definite) S. Manzhos and G. Giorgi, “Bridging the Fields of Solar Cell and Battery Research to Develop High-Performance Anodes for Photoelectrochemical Cells and Metal Ion Batteries,” Challenges. 2013. link Times cited: 6 Abstract: Solar-to-electricity energy conversion and large scale elect… read moreAbstract: Solar-to-electricity energy conversion and large scale electricity storage technologies are key to achieve a sustainable development of society. For energy conversion, photoelectrochemical solar cells were proposed as an economic alternative to the conventional Si-based technology. For energy storage, metal-ion batteries are a very promising technology. Titania (TiO2) based anodes are widely used in photoelectrochemical cells and have recently emerged as safe, high-rate anodes for metal-ion batteries. In both applications, titania interacts with electrolyte species: molecules and metal ions. Details of this interaction determine the performance of the electrode in both technologies, but no unified theoretical description exists, e.g., there is no systematic description of the effects of Li, Na insertion into TiO2 on solar cell performance (while it is widely studied in battery research) and no description of effects of surface adsorbents on the performance of battery anodes (while they are widely studied in solar cell research). In fact, there is no systematic description of interactions of electrolyte species with TiO2 of different phases and morphologies. We propose a computation-focused study that will bridge the two fields that have heretofore largely been developing in parallel and will identify improved anode materials for both photoelectrochemical solar cells and metal-ion batteries. read less NOT USED (definite) P. Tontragunrat and S. Bureerat, “Antioptimisation of Trusses Using Two-Level Population-Based Incremental Learning,” J. Appl. Math. 2013. link Times cited: 1 Abstract: Practical optimum design of structures often involves parame… read moreAbstract: Practical optimum design of structures often involves parameters with uncertainties. There have been several ways to deal with such optimisation problems, and one of the approaches is an antioptimisation process. The task is to find the optimum solution of common design variables while simultaneously searching for the worst case scenario of those parameters with uncertainties. This paper proposed a metaheuristic based on population-based incremental learning (PBIL) for solving antioptimisation of trusses. The new algorithm is called two-level PBIL which consists of outer and inner loops. Five antioptimisation problems are posed to test the optimiser performance. The numerical results show that the concept of using PBIL probability vectors for handling the antioptimisation of truss is powerful and effective. The two-level PBIL can be considered a powerful optimiser for antioptimisation of trusses. read less NOT USED (definite) A. Hussain, F. Malek, M. A. Rashid, L. Mohamed, and N. Affendi, “Optimal Coordinated Design of Multiple Damping Controllers Based on PSS and UPFC Device to Improve Dynamic Stability in the Power System,” Mathematical Problems in Engineering. 2013. link Times cited: 14 Abstract: Unified Power Flow Controller (UPFC) device is applied to co… read moreAbstract: Unified Power Flow Controller (UPFC) device is applied to control power flow in transmission lines. Supplementary damping controller can be installed on any control channel of the UPFC inputs to implement the task of Power Oscillation Damping (POD) controller. In this paper, we have presented the simultaneous coordinated design of the multiple damping controllers between Power System Stabilizer (PSS) and UPFC-based POD or between different multiple UPFC-based POD controllers without PSS in a single-machine infinite-bus power system in order to identify the design that provided the most effective damping performance. The parameters of the damping controllers are optimized utilizing a Chaotic Particle Swarm Optimization (CPSO) algorithm based on eigenvalue objective function. The simulation results show that the coordinated design of the multiple damping controllers has high ability in damping oscillations compared to the individual damping controllers. Furthermore, the coordinated design of UPFC-based POD controllers demonstrates the superiority over the coordinated design of PSS and UPFC-based POD controllers for enhancing greatly the stability of the power system. read less |