Sim_LAMMPS_ReaxFF_BroqvistKullgrenWolf_2015_CeO__SM_063950220736_000
| Title
A single sentence description.
|
LAMMPS ReaxFF potential for Ce-O systems developed by Broqvist et al. (2015) v000 |
|---|---|
| Description | This is a reactive force-field of the ReaxFF type for stoichiometric ceria (CeO2) and partially reduced ceria (CeO2–x). It is ablea to accurately describe the oxygen chemistry of the bulk, extended surfaces, surface steps, and nanoparticles of the material. |
| Species
The supported atomic species.
| Ce, O |
| Disclaimer
A statement of applicability provided by the contributor, informing users of the intended use of this KIM Item.
|
There is a (false) local minimum occurring for partially reduced ceria at a short Ce-O distance (approx. 1.89 Angstrom). This may (for example) have consequences for dynamic simulations at moderate temperatures. In relevant cases, users are advised to analyze the bond distances from the simulations. |
| Content Origin | https://www.ctcms.nist.gov/potentials/entry/2015--Broqvist-P-Kullgren-J-Wolf-M-J-et-al--Ce-O/ |
| Contributor |
I Nikiforov |
| Maintainer |
I Nikiforov |
| Developer |
Peter Broqvist Jolla Kullgren Matthew J. Wolf Adri C. T. van Duin Kersti Hermansson |
| Published on KIM | 2022 |
| How to Cite |
This Simulator Model originally published in [1] is archived in OpenKIM [2-4]. [1] Broqvist P, Kullgren J, Wolf MJ, Duin ACT van, Hermansson K. ReaxFF Force-Field for Ceria Bulk, Surfaces, and Nanoparticles. The Journal of Physical Chemistry C [Internet]. 2015;119(24):13598–609. Available from: https://doi.org/10.1021/acs.jpcc.5b01597 doi:10.1021/acs.jpcc.5b01597 [2] Broqvist P, Kullgren J, Wolf MJ, Duin ACT van, Hermansson K. LAMMPS ReaxFF potential for Ce-O systems developed by Broqvist et al. (2015) v000. OpenKIM; 2022. doi:10.25950/a6da26b9 [3] Tadmor EB, Elliott RS, Sethna JP, Miller RE, Becker CA. The potential of atomistic simulations and the Knowledgebase of Interatomic Models. JOM. 2011;63(7):17. doi:10.1007/s11837-011-0102-6 [4] Elliott RS, Tadmor EB. Knowledgebase of Interatomic Models (KIM) Application Programming Interface (API). OpenKIM; 2011. doi:10.25950/ff8f563a Click here to download the above citation in BibTeX format. |
| Funding |
Funder: Vetenskapsrådet Funder: Ångpanneföreningens Forskningsstiftelse Funder: Swedish Foundation for International Cooperation in Research and Higher Education Funder: Göran Gustafssons Stiftelse för Naturvetenskaplig och Medicinsk Forskning Funder: National Strategic e-Science program eSSENCE Award Number: CM1104 Funder: European Cooperation in Science and Technology Award Number: CBET-1033000 Funder: National Science Foundation |
| Short KIM ID
The unique KIM identifier code.
| SM_063950220736_000 |
| Extended KIM ID
The long form of the KIM ID including a human readable prefix (100 characters max), two underscores, and the Short KIM ID. Extended KIM IDs can only contain alpha-numeric characters (letters and digits) and underscores and must begin with a letter.
| Sim_LAMMPS_ReaxFF_BroqvistKullgrenWolf_2015_CeO__SM_063950220736_000 |
| DOI |
10.25950/a6da26b9 https://doi.org/10.25950/a6da26b9 https://commons.datacite.org/doi.org/10.25950/a6da26b9 |
| KIM Item Type | Simulator Model |
| KIM API Version | 2.2 |
| Simulator Name
The name of the simulator as defined in kimspec.edn.
| LAMMPS |
| Potential Type | reax |
| Simulator Potential | reaxff |
| Run Compatibility | portable-models |
BCC Lattice Constant
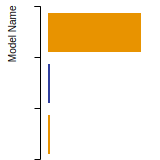
This bar chart plot shows the mono-atomic body-centered cubic (bcc) lattice constant predicted by the current model (shown in the unique color) compared with the predictions for all other models in the OpenKIM Repository that support the species. The vertical bars show the average and standard deviation (one sigma) bounds for all model predictions. Graphs are generated for each species supported by the model.
(No matching species)Cohesive Energy Graph
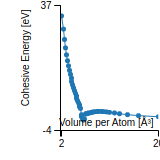
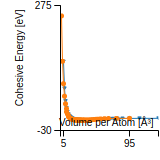
This graph shows the cohesive energy versus volume-per-atom for the current mode for four mono-atomic cubic phases (body-centered cubic (bcc), face-centered cubic (fcc), simple cubic (sc), and diamond). The curve with the lowest minimum is the ground state of the crystal if stable. (The crystal structure is enforced in these calculations, so the phase may not be stable.) Graphs are generated for each species supported by the model.
Diamond Lattice Constant
This bar chart plot shows the mono-atomic face-centered diamond lattice constant predicted by the current model (shown in the unique color) compared with the predictions for all other models in the OpenKIM Repository that support the species. The vertical bars show the average and standard deviation (one sigma) bounds for all model predictions. Graphs are generated for each species supported by the model.
(No matching species)Dislocation Core Energies
This graph shows the dislocation core energy of a cubic crystal at zero temperature and pressure for a specific set of dislocation core cutoff radii. After obtaining the total energy of the system from conjugate gradient minimizations, non-singular, isotropic and anisotropic elasticity are applied to obtain the dislocation core energy for each of these supercells with different dipole distances. Graphs are generated for each species supported by the model.
(No matching species)FCC Elastic Constants
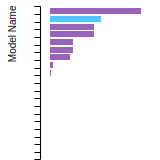
This bar chart plot shows the mono-atomic face-centered cubic (fcc) elastic constants predicted by the current model (shown in blue) compared with the predictions for all other models in the OpenKIM Repository that support the species. The vertical bars show the average and standard deviation (one sigma) bounds for all model predictions. Graphs are generated for each species supported by the model.
FCC Lattice Constant
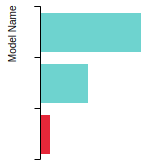
This bar chart plot shows the mono-atomic face-centered cubic (fcc) lattice constant predicted by the current model (shown in red) compared with the predictions for all other models in the OpenKIM Repository that support the species. The vertical bars show the average and standard deviation (one sigma) bounds for all model predictions. Graphs are generated for each species supported by the model.
FCC Stacking Fault Energies
This bar chart plot shows the intrinsic and extrinsic stacking fault energies as well as the unstable stacking and unstable twinning energies for face-centered cubic (fcc) predicted by the current model (shown in blue) compared with the predictions for all other models in the OpenKIM Repository that support the species. The vertical bars show the average and standard deviation (one sigma) bounds for all model predictions. Graphs are generated for each species supported by the model.
(No matching species)FCC Surface Energies
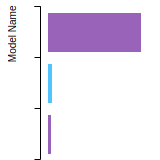
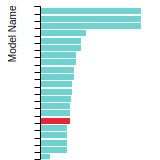
This bar chart plot shows the mono-atomic face-centered cubic (fcc) relaxed surface energies predicted by the current model (shown in blue) compared with the predictions for all other models in the OpenKIM Repository that support the species. The vertical bars show the average and standard deviation (one sigma) bounds for all model predictions. Graphs are generated for each species supported by the model.
SC Lattice Constant
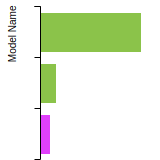
This bar chart plot shows the mono-atomic simple cubic (sc) lattice constant predicted by the current model (shown in the unique color) compared with the predictions for all other models in the OpenKIM Repository that support the species. The vertical bars show the average and standard deviation (one sigma) bounds for all model predictions. Graphs are generated for each species supported by the model.
Cubic Crystal Basic Properties Table
Species: CeSpecies: O
Disclaimer From Model Developer
There is a (false) local minimum occurring for partially reduced ceria at a short Ce-O distance (approx. 1.89 Angstrom). This may (for example) have consequences for dynamic simulations at moderate temperatures. In relevant cases, users are advised to analyze the bond distances from the simulations.
Creators:
Contributor: karls
Publication Year: 2019
DOI: https://doi.org/10.25950/64cb38c5
This Test Driver uses LAMMPS to compute the cohesive energy of a given monoatomic cubic lattice (fcc, bcc, sc, or diamond) at a variety of lattice spacings. The lattice spacings range from a_min (=a_min_frac*a_0) to a_max (=a_max_frac*a_0) where a_0, a_min_frac, and a_max_frac are read from stdin (a_0 is typically approximately equal to the equilibrium lattice constant). The precise scaling and number of lattice spacings sampled between a_min and a_0 (a_0 and a_max) is specified by two additional parameters passed from stdin: N_lower and samplespacing_lower (N_upper and samplespacing_upper). Please see README.txt for further details.
| Test | Test Results | Link to Test Results page | Benchmark time
Usertime multiplied by the Whetstone Benchmark. This number can be used (approximately) to compare the performance of different models independently of the architecture on which the test was run.
Measured in Millions of Whetstone Instructions (MWI) |
|---|---|---|---|
| Cohesive energy versus lattice constant curve for fcc Ce v004 | view | 13185 | |
| Cohesive energy versus lattice constant curve for fcc O v004 | view | 54921 | |
| Cohesive energy versus lattice constant curve for sc Ce v004 | view | 7877 |
Creators:
Contributor: ilia
Publication Year: 2024
DOI: https://doi.org/10.25950/888f9943
Computes the elastic constants for an arbitrary crystal. A robust computational protocol is used, attempting multiple methods and step sizes to achieve an acceptably low error in numerical differentiation and deviation from material symmetry. The crystal structure is specified using the AFLOW prototype designation as part of the Crystal Genome testing framework. In addition, the distance from the obtained elasticity tensor to the nearest isotropic tensor is computed.
| Test | Test Results | Link to Test Results page | Benchmark time
Usertime multiplied by the Whetstone Benchmark. This number can be used (approximately) to compare the performance of different models independently of the architecture on which the test was run.
Measured in Millions of Whetstone Instructions (MWI) |
|---|---|---|---|
| Elastic constants for CeO in AFLOW crystal prototype A2B3_cI80_206_ad_e at zero temperature and pressure v000 | view | 1045765332 | |
| Elastic constants for CeO in AFLOW crystal prototype A2B3_mC30_12_3i_a4i at zero temperature and pressure v000 | view | 314338883 |
Creators: Junhao Li and Ellad Tadmor
Contributor: tadmor
Publication Year: 2019
DOI: https://doi.org/10.25950/5853fb8f
Computes the cubic elastic constants for some common crystal types (fcc, bcc, sc, diamond) by calculating the hessian of the energy density with respect to strain. An estimate of the error associated with the numerical differentiation performed is reported.
| Test | Test Results | Link to Test Results page | Benchmark time
Usertime multiplied by the Whetstone Benchmark. This number can be used (approximately) to compare the performance of different models independently of the architecture on which the test was run.
Measured in Millions of Whetstone Instructions (MWI) |
|---|---|---|---|
| Elastic constants for fcc Ce at zero temperature v006 | view | 51534 | |
| Elastic constants for fcc O at zero temperature v006 | view | 70117 | |
| Elastic constants for sc Ce at zero temperature v006 | view | 8689 |
Creators:
Contributor: ilia
Publication Year: 2024
DOI: https://doi.org/10.25950/2f2c4ad3
Computes the equilibrium crystal structure and energy for an arbitrary crystal at zero temperature and applied stress by performing symmetry-constrained relaxation. The crystal structure is specified using the AFLOW prototype designation. Multiple sets of free parameters corresponding to the crystal prototype may be specified as initial guesses for structure optimization. No guarantee is made regarding the stability of computed equilibria, nor that any are the ground state.
| Test | Test Results | Link to Test Results page | Benchmark time
Usertime multiplied by the Whetstone Benchmark. This number can be used (approximately) to compare the performance of different models independently of the architecture on which the test was run.
Measured in Millions of Whetstone Instructions (MWI) |
|---|---|---|---|
| Equilibrium crystal structure and energy for CeO in AFLOW crystal prototype A2B3_cI80_206_ad_e v002 | view | 928134 |
Creators:
Contributor: ilia
Publication Year: 2025
DOI: https://doi.org/10.25950/866c7cfa
Computes the equilibrium crystal structure and energy for an arbitrary crystal at zero temperature and applied stress by performing symmetry-constrained relaxation. The crystal structure is specified using the AFLOW prototype designation. Multiple sets of free parameters corresponding to the crystal prototype may be specified as initial guesses for structure optimization. No guarantee is made regarding the stability of computed equilibria, nor that any are the ground state.
| Test | Test Results | Link to Test Results page | Benchmark time
Usertime multiplied by the Whetstone Benchmark. This number can be used (approximately) to compare the performance of different models independently of the architecture on which the test was run.
Measured in Millions of Whetstone Instructions (MWI) |
|---|---|---|---|
| Equilibrium crystal structure and energy for CeO in AFLOW crystal prototype A2B3_mC10_12_i_ai v003 | view | 379212 | |
| Equilibrium crystal structure and energy for CeO in AFLOW crystal prototype A2B3_mC30_12_3i_a4i v003 | view | 1225347 | |
| Equilibrium crystal structure and energy for Ce in AFLOW crystal prototype A_cF4_225_a v003 | view | 204259 | |
| Equilibrium crystal structure and energy for Ce in AFLOW crystal prototype A_cI2_229_a v003 | view | 182480 | |
| Equilibrium crystal structure and energy for Ce in AFLOW crystal prototype A_hP2_194_c v003 | view | 185603 | |
| Equilibrium crystal structure and energy for Ce in AFLOW crystal prototype A_hP4_194_ac v003 | view | 147343 |
Creators: Daniel S. Karls and Junhao Li
Contributor: karls
Publication Year: 2019
DOI: https://doi.org/10.25950/2765e3bf
Equilibrium lattice constant and cohesive energy of a cubic lattice at zero temperature and pressure.
| Test | Test Results | Link to Test Results page | Benchmark time
Usertime multiplied by the Whetstone Benchmark. This number can be used (approximately) to compare the performance of different models independently of the architecture on which the test was run.
Measured in Millions of Whetstone Instructions (MWI) |
|---|---|---|---|
| Equilibrium zero-temperature lattice constant for fcc Ce v007 | view | 44540 | |
| Equilibrium zero-temperature lattice constant for fcc O v007 | view | 65964 | |
| Equilibrium zero-temperature lattice constant for sc Ce v007 | view | 6623 |
Creators:
Contributor: mjwen
Publication Year: 2024
DOI: https://doi.org/10.25950/9d9822ec
This Test Driver uses LAMMPS to compute the linear thermal expansion coefficient at a finite temperature under a given pressure for a cubic lattice (fcc, bcc, sc, diamond) of a single given species.
| Test | Test Results | Link to Test Results page | Benchmark time
Usertime multiplied by the Whetstone Benchmark. This number can be used (approximately) to compare the performance of different models independently of the architecture on which the test was run.
Measured in Millions of Whetstone Instructions (MWI) |
|---|---|---|---|
| Linear thermal expansion coefficient of fcc Ce at 293.15 K under a pressure of 0 MPa v002 | view | 14870163 |
Creators: Matt Bierbaum
Contributor: mattbierbaum
Publication Year: 2019
DOI: https://doi.org/10.25950/64f4999b
Calculates the phonon dispersion relations for fcc lattices and records the results as curves.
| Test | Test Results | Link to Test Results page | Benchmark time
Usertime multiplied by the Whetstone Benchmark. This number can be used (approximately) to compare the performance of different models independently of the architecture on which the test was run.
Measured in Millions of Whetstone Instructions (MWI) |
|---|---|---|---|
| Phonon dispersion relations for fcc Ce v004 | view | 160640 |
Creators: Matt Bierbaum
Contributor: mattbierbaum
Publication Year: 2019
DOI: https://doi.org/10.25950/6c43a4e6
Calculates the surface energy of several high symmetry surfaces and produces a broken-bond model fit. In latex form, the fit equations are given by:
E_{FCC} (\vec{n}) = p_1 (4 \left( |x+y| + |x-y| + |x+z| + |x-z| + |z+y| +|z-y|\right)) + p_2 (8 \left( |x| + |y| + |z|\right)) + p_3 (2 ( |x+ 2y + z| + |x+2y-z| + |x-2y + z| + |x-2y-z| + |2x+y+z| + |2x+y-z| +|2x-y+z| +|2x-y-z| +|x+y+2z| +|x+y-2z| +|x-y+2z| +|x-y-2z| ) + c
E_{BCC} (\vec{n}) = p_1 (6 \left( | x+y+z| + |x+y-z| + |-x+y-z| + |x-y+z| \right)) + p_2 (8 \left( |x| + |y| + |z|\right)) + p_3 (4 \left( |x+y| + |x-y| + |x+z| + |x-z| + |z+y| +|z-y|\right)) +c.
In Python, these two fits take the following form:
def BrokenBondFCC(params, index):
import numpy
x, y, z = index
x = x / numpy.sqrt(x**2.+y**2.+z**2.)
y = y / numpy.sqrt(x**2.+y**2.+z**2.)
z = z / numpy.sqrt(x**2.+y**2.+z**2.)
return params[0]*4* (abs(x+y) + abs(x-y) + abs(x+z) + abs(x-z) + abs(z+y) + abs(z-y)) + params[1]*8*(abs(x) + abs(y) + abs(z)) + params[2]*(abs(x+2*y+z) + abs(x+2*y-z) +abs(x-2*y+z) +abs(x-2*y-z) + abs(2*x+y+z) +abs(2*x+y-z) +abs(2*x-y+z) +abs(2*x-y-z) + abs(x+y+2*z) +abs(x+y-2*z) +abs(x-y+2*z) +abs(x-y-2*z))+params[3]
def BrokenBondBCC(params, x, y, z):
import numpy
x, y, z = index
x = x / numpy.sqrt(x**2.+y**2.+z**2.)
y = y / numpy.sqrt(x**2.+y**2.+z**2.)
z = z / numpy.sqrt(x**2.+y**2.+z**2.)
return params[0]*6*(abs(x+y+z) + abs(x-y-z) + abs(x-y+z) + abs(x+y-z)) + params[1]*8*(abs(x) + abs(y) + abs(z)) + params[2]*4* (abs(x+y) + abs(x-y) + abs(x+z) + abs(x-z) + abs(z+y) + abs(z-y)) + params[3]
| Test | Test Results | Link to Test Results page | Benchmark time
Usertime multiplied by the Whetstone Benchmark. This number can be used (approximately) to compare the performance of different models independently of the architecture on which the test was run.
Measured in Millions of Whetstone Instructions (MWI) |
|---|---|---|---|
| Broken-bond fit of high-symmetry surface energies in fcc Ce v004 | view | 1018884 |
| Test | Error Categories | Link to Error page |
|---|---|---|
| Elastic constants for CeO in AFLOW crystal prototype A2B3_mC10_12_i_ai at zero temperature and pressure v000 | other | view |
EquilibriumCrystalStructure__TD_457028483760_003
| Test | Error Categories | Link to Error page |
|---|---|---|
| Equilibrium crystal structure and energy for CeO in AFLOW crystal prototype A2B3_mC10_5_c_ac v003 | other | view |
| Equilibrium crystal structure and energy for Ce in AFLOW crystal prototype A_oC4_63_c v003 | other | view |
| Sim_LAMMPS_ReaxFF_BroqvistKullgrenWolf_2015_CeO__SM_063950220736_000.txz | Tar+XZ | Linux and OS X archive |
| Sim_LAMMPS_ReaxFF_BroqvistKullgrenWolf_2015_CeO__SM_063950220736_000.zip | Zip | Windows archive |
