Interatomic potential for Carbon (C), Silicon (Si), Titanium (Ti). Use this Potential
Citing article:
Current potential: Tersoff_LAMMPS_PlummerTucker_2019_TiSiC__MO_751442731010_000
Deep Citation determination:
Does the citing paper use the current potential to generate results displayed in the paper?
Provide us with identifying information so that we know you are not a bot (you will not be added to a mailing list):
Title
A single sentence description.
Tersoff-style three-body potential for TiSiC developed by Plummer and Tucker (2019) v000
Description
A short description of the Model describing its key features including for example: type of model (pair potential, 3-body potential, EAM, etc.), modeled species (Ac, Ag, ..., Zr), intended purpose, origin, and so on.
This is a bond-order potential for the Ti3SiC2 MAX phase developed within the Tersoff formalism. Parameters were determined by independently considering each interatomic interaction present in the system and fitting them to the relevant structural, elastic, and defect properties for a number of unary, binary, and ternary structures.
Species
The supported atomic species.
C, Si, Ti
Disclaimer
A statement of applicability provided by the contributor, informing users of the intended use of this KIM Item.
This potential was developed for the Ti_3SiC_2 MAX phase.
This Model originally published in [1] is archived in OpenKIM [2-5].
[1] Plummer G, Tucker GJ. Bond-order potentials for the \mathrmTi_3\mathrmAlC_2 and \mathrmTi_3\mathrmSiC_2 MAX phases. Phys Rev B [Internet]. 2019Dec;100(21):214114. Available from: https://link.aps.org/doi/10.1103/PhysRevB.100.214114 doi:10.1103/PhysRevB.100.214114 — (Primary Source) A primary source is a reference directly related to the item documenting its development, as opposed to other sources that are provided as background information.
[2] Plummer G, Tucker GJ. Tersoff-style three-body potential for TiSiC developed by Plummer and Tucker (2019) v000. OpenKIM; 2022. doi:10.25950/9bb5f9f3
[3] Brink T, Thompson AP, Farrell DE, Wen M, Tersoff J, Nord J, et al. Model driver for Tersoff-style potentials ported from LAMMPS v005. OpenKIM; 2021. doi:10.25950/9a7dc96c
[4] Tadmor EB, Elliott RS, Sethna JP, Miller RE, Becker CA. The potential of atomistic simulations and the Knowledgebase of Interatomic Models. JOM. 2011;63(7):17. doi:10.1007/s11837-011-0102-6
This panel presents information regarding the papers that have cited the interatomic potential (IP) whose page you are on.
The OpenKIM machine learning based Deep Citation framework is used to determine whether the citing article actually used the IP in computations (denoted by "USED") or only provides it as a background citation (denoted by "NOT USED"). For more details on Deep Citation and how to work with this panel, click the documentation link at the top of the panel.
The word cloud to the right is generated from the abstracts of IP principle source(s) (given below in "How to Cite") and the citing articles that were determined to have used the IP in order to provide users with a quick sense of the types of physical phenomena to which this IP is applied.
The bar chart shows the number of articles that cited the IP per year. Each bar is divided into green (articles that USED the IP) and blue (articles that did NOT USE the IP).
Users are encouraged to correct Deep Citation errors in determination by clicking the speech icon next to a citing article and providing updated information. This will be integrated into the next Deep Citation learning cycle, which occurs on a regular basis.
This panel provides information on past usage of this interatomic potential (IP) powered by the OpenKIM Deep Citation framework. The word cloud indicates typical applications of the potential. The bar chart shows citations per year of this IP (bars are divided into articles that used the IP (green) and those that did not (blue)). The complete list of articles that cited this IP is provided below along with the Deep Citation determination on usage. See the Deep Citation documentation for more information.
11 Citations (10 used)
Help us to determine which of the papers that cite this potential actually used it to perform calculations. If you know, click the .
USED (low confidence) J. Gruber, G. Plummer, and G. Tucker, “Bending the Rules: Strain Accommodation in Layered Crystalline Solids Through Nanoscale Buckling Over Dislocations,” SSRN Electronic Journal. 2023. link Times cited: 0
USED (low confidence) K. Sudhakar, G. Plummer, G. Tucker, and M. Barsoum, “Boundaries; kink versus ripplocation in graphite, MAX phases and other layered solids,” Carbon. 2023. link Times cited: 0
USED (low confidence) M. M. Hassan, J. Islam, W. R. Sajal, M. A.-A. B. Shuvo, and S. Goni, “Temperature, Strain Rate, and Point Vacancy Dependent Anisotropic Mechanical Behaviors of Titanium Carbide (Ti3C2) MXene: A Molecular Dynamics Study,” Materials Today Communications. 2023. link Times cited: 0
USED (low confidence) P. Istomin, E. I. Istomina, A. Nadutkin, and V. Grass, “Synthesis and crystal structure of a novel quaternary Zr3TiSiC3 MAX phase,” Ceramics International. 2023. link Times cited: 0
USED (low confidence) L. Safina and E. A. Rozhnova, “MOLECULAR DYNAMICS SIMULATION OF THE DEFORMATION BEHAVIOR OF THE GRAPHENE/Al COMPOSITE,” Journal of Structural Chemistry. 2023. link Times cited: 2
USED (low confidence) B. Waters, D. S. Karls, I. Nikiforov, R. Elliott, E. Tadmor, and B. Runnels, “Automated determination of grain boundary energy and potential-dependence using the OpenKIM framework,” Computational Materials Science. 2022. link Times cited: 5
USED (low confidence) G. Plummer, G. Tucker, M. Barsoum, and C. Weinberger, “Basal Dislocations in MAX Phases: Core Structure and Mobility,” Materialia. 2021. link Times cited: 10
USED (low confidence) Y. Cao, C. Guo, D. Wu, and Y. Zou, “Synthesis and corrosion resistance of solid solution Ti3(Al1−xSix)C2,” Journal of Alloys and Compounds. 2021. link Times cited: 10
USED (low confidence) G. Plummer et al., “On the origin of kinking in layered crystalline solids,” Materials Today. 2021. link Times cited: 23
USED (low confidence) Z. Jianrong et al., “First-principles study of the vacancy and layer defects in Ti3SiC2,” International Journal of Modern Physics B. 2020. link Times cited: 2
Abstract: First-principles calculations are performed to study the eff… read more
Abstract: First-principles calculations are performed to study the effects of defect on the structure and electronic properties of Ti3SiC2. The calculations show that the formation energy of Si vacancy is mi... read less
NOT USED (low confidence) L. Zhang et al., “Combined experimental and first-principles studies of structural and physical properties of β-Ti3SiC2,” Journal of Applied Physics. 2020. link Times cited: 1
Abstract: MAX phase materials have shown a series of interesting, even… read more
Abstract: MAX phase materials have shown a series of interesting, even sometimes unusual, properties and exhibited combined attributes of both metals and ceramics, which are due to their “layered ternary transition metal carbides” structures. In the process of studying the multistage phase transformation of 312-MAX phase materials, we found that there were some confusions and mistakes when describing the crystal structures of the β-phase in the existing literature. In order to clarify their structural and physical properties, the β-phase Ti3SiC2 materials have been prepared by using 500 keV He2+-ion irradiation-induced phase transformation and examined by first-principles calculations and Rietveld analysis of grazing incidence x-ray diffraction patterns. Two accurate descriptions of the β-Ti3SiC2 structure are given here. In order to avoid confusion again, it is recommended to use one of the two descriptions uniformly. In addition, some physical properties parameters of β-Ti3SiC2 have been calculated and compared, which also confirmed the correctness of the structure description. Finally, the vacancy formation energies of β-Ti3SiC2 have been predicted and discussed in detail from the points of phase stability and transformation for the first time. read less
The long form of the KIM ID including a human readable prefix (100 characters max), two underscores, and the Short KIM ID. Extended KIM IDs can only contain alpha-numeric characters (letters and digits) and underscores and must begin with a letter.
Specifies whether this is a Portable Model (software implementation of an interatomic model); Portable Model with parameter file (parameter file to be read in by a Model Driver); Model Driver (software implementation of an interatomic model that reads in parameters).
The letter grade A was assigned because the normalized error in the computation was 4.61463e-10 compared with a machine precision of 2.22045e-16. The letter grade was based on 'score=log10(error/eps)', with ranges A=[0, 7.5], B=(7.5, 10.0], C=(10.0, 12.5], D=(12.5, 15.0), F>15.0. 'A' is the best grade, and 'F' indicates failure.
vc-forces-numerical-derivative
consistency
Forces computed by the model agree with numerical derivatives of the energy; see full description.
The model is C^1 continuous. This means that the model has continuous energy and continuous first derivative.
vc-dimer-continuity-c1
informational
The energy versus separation relation of a pair of atoms is C1 continuous (i.e. the function and its first derivative are continuous); see full description.
Model energy and forces are invariant with respect to rigid-body motion (translation and rotation) for all configurations the model was able to compute.
vc-objectivity
informational
Total energy is unchanged and forces transform correctly under rigid-body translation and rotation; see full description.
All threads give identical results for tested case. Model appears to be thread-safe.
vc-thread-safe
mandatory
The model returns the same energy and forces when computed in serial and when using parallel threads for a set of configurations. Note that this is not a guarantee of thread safety; see full description.
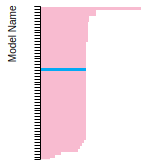
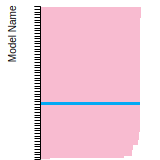
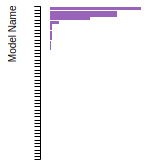
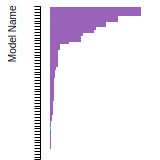
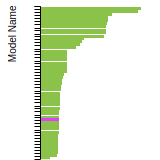
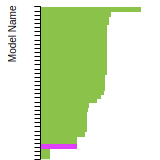
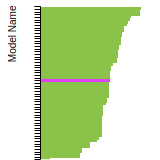
This bar chart plot shows the mono-atomic body-centered cubic (bcc) lattice constant predicted by the current model (shown in the unique color) compared with the predictions for all other models in the OpenKIM Repository that support the species. The vertical bars show the average and standard deviation (one sigma) bounds for all model predictions. Graphs are generated for each species supported by the model.
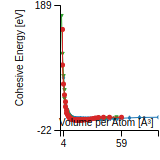
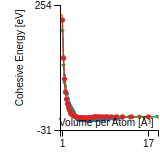
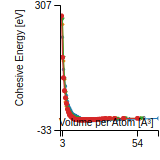
This graph shows the cohesive energy versus volume-per-atom for the current mode for four mono-atomic cubic phases (body-centered cubic (bcc), face-centered cubic (fcc), simple cubic (sc), and diamond). The curve with the lowest minimum is the ground state of the crystal if stable. (The crystal structure is enforced in these calculations, so the phase may not be stable.) Graphs are generated for each species supported by the model.
This bar chart plot shows the mono-atomic face-centered diamond lattice constant predicted by the current model (shown in the unique color) compared with the predictions for all other models in the OpenKIM Repository that support the species. The vertical bars show the average and standard deviation (one sigma) bounds for all model predictions. Graphs are generated for each species supported by the model.
This graph shows the dislocation core energy of a cubic crystal at zero temperature and pressure for a specific set of dislocation core cutoff radii. After obtaining the total energy of the system from conjugate gradient minimizations, non-singular, isotropic and anisotropic elasticity are applied to obtain the dislocation core energy for each of these supercells with different dipole distances. Graphs are generated for each species supported by the model.
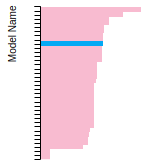
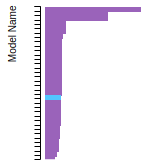
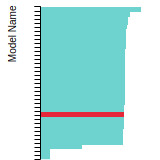
This bar chart plot shows the mono-atomic face-centered cubic (fcc) elastic constants predicted by the current model (shown in blue) compared with the predictions for all other models in the OpenKIM Repository that support the species. The vertical bars show the average and standard deviation (one sigma) bounds for all model predictions. Graphs are generated for each species supported by the model.
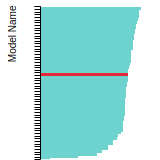
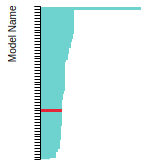
This bar chart plot shows the mono-atomic face-centered cubic (fcc) lattice constant predicted by the current model (shown in red) compared with the predictions for all other models in the OpenKIM Repository that support the species. The vertical bars show the average and standard deviation (one sigma) bounds for all model predictions. Graphs are generated for each species supported by the model.
This bar chart plot shows the intrinsic and extrinsic stacking fault energies as well as the unstable stacking and unstable twinning energies for face-centered cubic (fcc) predicted by the current model (shown in blue) compared with the predictions for all other models in the OpenKIM Repository that support the species. The vertical bars show the average and standard deviation (one sigma) bounds for all model predictions. Graphs are generated for each species supported by the model.
This bar chart plot shows the mono-atomic face-centered cubic (fcc) relaxed surface energies predicted by the current model (shown in blue) compared with the predictions for all other models in the OpenKIM Repository that support the species. The vertical bars show the average and standard deviation (one sigma) bounds for all model predictions. Graphs are generated for each species supported by the model.
This bar chart plot shows the mono-atomic simple cubic (sc) lattice constant predicted by the current model (shown in the unique color) compared with the predictions for all other models in the OpenKIM Repository that support the species. The vertical bars show the average and standard deviation (one sigma) bounds for all model predictions. Graphs are generated for each species supported by the model.
Given an xyz file corresponding to a finite cluster of atoms, this Test Driver computes the total potential energy and atomic forces on the configuration. The positions are then relaxed using conjugate gradient minimization and the final positions and forces are recorded. These results are primarily of interest for training machine-learning algorithms.
Test
Test Results
Link to Test Results page
Benchmark time
Usertime multiplied by the Whetstone Benchmark. This number can be used (approximately) to compare the performance of different models independently of the architecture on which the test was run.
Measured in Millions of Whetstone Instructions (MWI)
This Test Driver uses LAMMPS to compute the cohesive energy of a given monoatomic cubic lattice (fcc, bcc, sc, or diamond) at a variety of lattice spacings. The lattice spacings range from a_min (=a_min_frac*a_0) to a_max (=a_max_frac*a_0) where a_0, a_min_frac, and a_max_frac are read from stdin (a_0 is typically approximately equal to the equilibrium lattice constant). The precise scaling and number of lattice spacings sampled between a_min and a_0 (a_0 and a_max) is specified by two additional parameters passed from stdin: N_lower and samplespacing_lower (N_upper and samplespacing_upper). Please see README.txt for further details.
Test
Test Results
Link to Test Results page
Benchmark time
Usertime multiplied by the Whetstone Benchmark. This number can be used (approximately) to compare the performance of different models independently of the architecture on which the test was run.
Measured in Millions of Whetstone Instructions (MWI)
Computes the elastic constants for an arbitrary crystal. A robust computational protocol is used, attempting multiple methods and step sizes to achieve an acceptably low error in numerical differentiation and deviation from material symmetry. The crystal structure is specified using the AFLOW prototype designation as part of the Crystal Genome testing framework. In addition, the distance from the obtained elasticity tensor to the nearest isotropic tensor is computed.
Test
Test Results
Link to Test Results page
Benchmark time
Usertime multiplied by the Whetstone Benchmark. This number can be used (approximately) to compare the performance of different models independently of the architecture on which the test was run.
Measured in Millions of Whetstone Instructions (MWI)
Computes the cubic elastic constants for some common crystal types (fcc, bcc, sc, diamond) by calculating the hessian of the energy density with respect to strain. An estimate of the error associated with the numerical differentiation performed is reported.
Test
Test Results
Link to Test Results page
Benchmark time
Usertime multiplied by the Whetstone Benchmark. This number can be used (approximately) to compare the performance of different models independently of the architecture on which the test was run.
Measured in Millions of Whetstone Instructions (MWI)
Computes the equilibrium crystal structure and energy for an arbitrary crystal at zero temperature and applied stress by performing symmetry-constrained relaxation. The crystal structure is specified using the AFLOW prototype designation. Multiple sets of free parameters corresponding to the crystal prototype may be specified as initial guesses for structure optimization. No guarantee is made regarding the stability of computed equilibria, nor that any are the ground state.
Test
Test Results
Link to Test Results page
Benchmark time
Usertime multiplied by the Whetstone Benchmark. This number can be used (approximately) to compare the performance of different models independently of the architecture on which the test was run.
Measured in Millions of Whetstone Instructions (MWI)
Given atomic species and structure type (graphene-like, 2H, or 1T) of a 2D hexagonal monolayer crystal, as well as an initial guess at the lattice spacing, this Test Driver calculates the equilibrium lattice spacing and cohesive energy using Polak-Ribiere conjugate gradient minimization in LAMMPS
Test
Test Results
Link to Test Results page
Benchmark time
Usertime multiplied by the Whetstone Benchmark. This number can be used (approximately) to compare the performance of different models independently of the architecture on which the test was run.
Measured in Millions of Whetstone Instructions (MWI)
Equilibrium lattice constant and cohesive energy of a cubic lattice at zero temperature and pressure.
Test
Test Results
Link to Test Results page
Benchmark time
Usertime multiplied by the Whetstone Benchmark. This number can be used (approximately) to compare the performance of different models independently of the architecture on which the test was run.
Measured in Millions of Whetstone Instructions (MWI)
Calculates lattice constant of hexagonal bulk structures at zero temperature and pressure by using simplex minimization to minimize the potential energy.
Test
Test Results
Link to Test Results page
Benchmark time
Usertime multiplied by the Whetstone Benchmark. This number can be used (approximately) to compare the performance of different models independently of the architecture on which the test was run.
Measured in Millions of Whetstone Instructions (MWI)
This Test Driver uses LAMMPS to compute the linear thermal expansion coefficient at a finite temperature under a given pressure for a cubic lattice (fcc, bcc, sc, diamond) of a single given species.
Test
Test Results
Link to Test Results page
Benchmark time
Usertime multiplied by the Whetstone Benchmark. This number can be used (approximately) to compare the performance of different models independently of the architecture on which the test was run.
Measured in Millions of Whetstone Instructions (MWI)
Given an extended xyz file corresponding to a non-orthogonal periodic box of atoms, use LAMMPS to compute the total potential energy and atomic forces.
Test
Test Results
Link to Test Results page
Benchmark time
Usertime multiplied by the Whetstone Benchmark. This number can be used (approximately) to compare the performance of different models independently of the architecture on which the test was run.
Measured in Millions of Whetstone Instructions (MWI)
Computes the monovacancy formation energy and relaxation volume for cubic and hcp monoatomic crystals.
Test
Test Results
Link to Test Results page
Benchmark time
Usertime multiplied by the Whetstone Benchmark. This number can be used (approximately) to compare the performance of different models independently of the architecture on which the test was run.
Measured in Millions of Whetstone Instructions (MWI)
Computes the monovacancy formation and migration energies for cubic and hcp monoatomic crystals.
Test
Test Results
Link to Test Results page
Benchmark time
Usertime multiplied by the Whetstone Benchmark. This number can be used (approximately) to compare the performance of different models independently of the architecture on which the test was run.
Measured in Millions of Whetstone Instructions (MWI)
 Tersoff_LAMMPS_PlummerTucker_2019_TiSiC__MO_751442731010_000