 SNAP_LiChenZheng_2019_NbTaWMo__MO_560387080449_000
Use this Potential
| Title
A single sentence description.
|
A spectral neighbor analysis potential for Nb-Mo-Ta-W developed by Xiangguo Li (2019) v000 |
|---|---|
| Description
A short description of the Model describing its key features including for example: type of model (pair potential, 3-body potential, EAM, etc.), modeled species (Ac, Ag, ..., Zr), intended purpose, origin, and so on.
|
A spectral neighbor analysis potential for Nb-Mo-Ta-W chemistries. The potential is trained against diverse and large materials data, including undistorted ground state structures for Nb, Mo, Ta, W; distorted structures constructed by applying different strains to a bulk supercell; surface structures of elemental structures; solid solution random binary structures; special quasi-random structures for ternary and quaternary systems; ab-initio molecular dynamics (AIMD) simulated random structures at different temperatures for elementary bulk and special quasi-random structures. The potential gives accurate predictions of structural energies, forces, elasticity, lattice parameters, free energies, melting point, surface energies, generalized stacking fault energies, dislocation core structures, critical resolved shear stress of screw and edge dislocations. It can also successfully predict the short-range order and segregation effects in the multi-principal element NbMoTaW alloy. |
| Species
The supported atomic species.
| Mo, Nb, Ta, W |
| Disclaimer
A statement of applicability provided by the contributor, informing users of the intended use of this KIM Item.
|
This potential is designed for Nb-Mo-Ta-W chemistries, including the elementary, binary, ternary and quaternary systems. The potential was trained using LAMMPS version 17Nov2016. Newer LAMMPS may see energy differences, but the relative values should remain to be the same. |
| Content Other Locations | https://arxiv.org/abs/1912.01789 |
| Contributor |
Xiangguo Li |
| Maintainer |
Xiangguo Li |
| Developer |
Hui Zheng Xiangguo Li Chi Chen Ong, Shyue Ping |
| Published on KIM | 2020 |
| How to Cite |
This Model originally published in [1] is archived in OpenKIM [2-5]. [1] Li X-G, Chen C, Zheng H, Zuo Y, Ong SP. Complex strengthening mechanisms in the NbMoTaW multi-principal element alloy. npj Computational Materials. 2020;6(1). doi:10.1038/s41524-020-0339-0 — (Primary Source) A primary source is a reference directly related to the item documenting its development, as opposed to other sources that are provided as background information. [2] Zheng H, Li X, Chen C, Ong SP. A spectral neighbor analysis potential for Nb-Mo-Ta-W developed by Xiangguo Li (2019) v000. OpenKIM; 2020. doi:10.25950/c34c3362 [3] Afshar Y, Thompson AP, Swiler LP, Trott CR, Foiles SM, Tucker GJ. Spectral neighbor analysis potential (SNAP) model driver v000. OpenKIM; 2019. doi:10.25950/f4fae493 [4] Tadmor EB, Elliott RS, Sethna JP, Miller RE, Becker CA. The potential of atomistic simulations and the Knowledgebase of Interatomic Models. JOM. 2011;63(7):17. doi:10.1007/s11837-011-0102-6 [5] Elliott RS, Tadmor EB. Knowledgebase of Interatomic Models (KIM) Application Programming Interface (API). OpenKIM; 2011. doi:10.25950/ff8f563a Click here to download the above citation in BibTeX format. |
| Citations
This panel presents information regarding the papers that have cited the interatomic potential (IP) whose page you are on. The OpenKIM machine learning based Deep Citation framework is used to determine whether the citing article actually used the IP in computations (denoted by "USED") or only provides it as a background citation (denoted by "NOT USED"). For more details on Deep Citation and how to work with this panel, click the documentation link at the top of the panel. The word cloud to the right is generated from the abstracts of IP principle source(s) (given below in "How to Cite") and the citing articles that were determined to have used the IP in order to provide users with a quick sense of the types of physical phenomena to which this IP is applied. The bar chart shows the number of articles that cited the IP per year. Each bar is divided into green (articles that USED the IP) and blue (articles that did NOT USE the IP). Users are encouraged to correct Deep Citation errors in determination by clicking the speech icon next to a citing article and providing updated information. This will be integrated into the next Deep Citation learning cycle, which occurs on a regular basis. OpenKIM acknowledges the support of the Allen Institute for AI through the Semantic Scholar project for providing citation information and full text of articles when available, which are used to train the Deep Citation ML algorithm. |
This panel provides information on past usage of this interatomic potential (IP) powered by the OpenKIM Deep Citation framework. The word cloud indicates typical applications of the potential. The bar chart shows citations per year of this IP (bars are divided into articles that used the IP (green) and those that did not (blue)). The complete list of articles that cited this IP is provided below along with the Deep Citation determination on usage. See the Deep Citation documentation for more information. 
99 Citations (61 used)
Help us to determine which of the papers that cite this potential actually used it to perform calculations. If you know, click the .
USED (definite) S. He, X.-Z. Zhou, D. Mordehai, and J. Marian, “Thermal Super-Jogs Control High-Temperature Strength in Nb-Mo-Ta-W Alloys,” SSRN Electronic Journal. 2022. link Times cited: 0 Abstract: Refractory multi-element alloys (RMEA) with body-centered cu… read more USED (high confidence) I. Geiger, J. Luo, E. Lavernia, P. Cao, D. Apelian, and T. Rupert, “Influence of chemistry and structure on interfacial segregation in NbMoTaW with high-throughput atomistic simulations,” Journal of Applied Physics. 2022. link Times cited: 4 Abstract: Refractory multi-principal element alloys exhibiting promisi… read more USED (high confidence) T. Lee et al., “Atomic-scale origin of the low grain-boundary resistance in perovskite solid electrolyte Li0.375Sr0.4375Ta0.75Zr0.25O3,” Nature Communications. 2022. link Times cited: 9 USED (high confidence) H. Zheng et al., “Multi-scale investigation of short-range order and dislocation glide in MoNbTi and TaNbTi multi-principal element alloys,” npj Computational Materials. 2022. link Times cited: 8 USED (high confidence) X. Wang, F. Maresca, and P. Cao, “The Hierarchical Energy Landscape of Screw Dislocation Motion in Refractory High-entropy Alloys,” Acta Materialia. 2022. link Times cited: 18 USED (high confidence) W. Jian, Y. Su, S. Xu, W. Ji, and I. Beyerlein, “Effect of interface structure on dislocation glide behavior in nanolaminates,” Journal of Materials Research. 2021. link Times cited: 6 Abstract: The ultra-high strength of nanolaminates arises from the eff… read more USED (low confidence) X. Zhou, S. He, and J. Marian, “Temperature dependence of the strength of Nb-Mo-Ta-W alloys due to screw dislocations,” Scripta Materialia. 2024. link Times cited: 0 USED (low confidence) C. Hu, R. Dingreville, and B. L. Boyce, “Computational modeling of grain boundary segregation: A review,” Computational Materials Science. 2024. link Times cited: 0 USED (low confidence) D. Hua et al., “Revealing the deformation mechanisms of <110> symmetric tilt grain boundaries in CoCrNi medium-entropy alloy,” International Journal of Plasticity. 2023. link Times cited: 0 USED (low confidence) S. Shuang, Y. Liang, X. Zhang, F. Yuan, G. Kang, and X. Zhang, “Impact of local chemical ordering on deformation mechanisms in single-crystalline CuNiCoFe high-entropy alloys: a molecular dynamics study,” Modelling and Simulation in Materials Science and Engineering. 2023. link Times cited: 0 Abstract: High-entropy alloys (HEAs), composed of multiple constituent… read more USED (low confidence) X.-T. Li, X. Tang, and Y.-F. Guo, “Inhibition effect of segregation and chemical order on grain boundary migration in NbMoTaW multi-principal element alloy,” Scripta Materialia. 2023. link Times cited: 0 USED (low confidence) H. Umashankar, D. Scheiber, V. Razumovskiy, and M. Militzer, “Modeling solute-grain boundary interactions in a bcc Ti-Mo alloy using density functional theory,” Computational Materials Science. 2023. link Times cited: 1 USED (low confidence) S. Chen et al., “Crack Tip Dislocation Activity in Refractory High-Entropy Alloys,” International Journal of Mechanical Sciences. 2023. link Times cited: 0 USED (low confidence) A. A. Mamun, S. Xu, X.-G. Li, and Y. Su, “Comparing interatomic potentials in calculating basic structural parameters and Peierls stress in tungsten-based random binary alloys,” Physica Scripta. 2023. link Times cited: 0 Abstract: The field of machine learning-based interatomic potentials (… read more USED (low confidence) Y.-F. Wu, W. Yu, and S. Shen, “Developing an analytical bond-order potential for Hf/Nb/Ta/Zr/C system using machine learning global optimization,” Ceramics International. 2023. link Times cited: 0 USED (low confidence) A. Chen, Y. Pan, J. Dai, W. Fu, and X. Song, “Theoretical study on the element distribution characteristics and the effects of oxygen in TiZrHfNb high entropy alloys,” Materials Today Communications. 2023. link Times cited: 1 USED (low confidence) P. Ouyang et al., “Atomic Local Ordering and Alloying Effects on the Mg3(Sb1-xBix)2 Thermoelectric Material.,” ACS applied materials & interfaces. 2023. link Times cited: 1 Abstract: Mg3(Sb1-xBix)2 alloy has been extensively studied in the las… read more USED (low confidence) S. Lyu, W. Li, Y. Xia, Y. Chen, and A. Ngan, “Effects of chemical randomness on strength contributors and dislocation behaviors in a bcc multiprincipal element alloy,” Physical Review Materials. 2023. link Times cited: 0 USED (low confidence) Y. Chen, X. Liao, R. Qiu, L. Liu, W. Hu, and H. Deng, “Primary radiation damage in tungsten-based high-entropy alloy: Interatomic potential and collision cascade simulations,” Journal of Nuclear Materials. 2023. link Times cited: 1 USED (low confidence) W. Chen, L. Li, Q. Zhu, and H. Zhuang, “Chemical short-range order in complex concentrated alloys,” MRS Bulletin. 2023. link Times cited: 1 Abstract: Complex concentrated alloys (CCAs) have drawn immense attent… read more USED (low confidence) Y.-F. Wu, W. Yu, and S. Shen, “Developing a variable charge potential for Hf/Nb/Ta/Ti/Zr/O system via machine learning global optimization,” Materials & Design. 2023. link Times cited: 1 USED (low confidence) R. Zhao et al., “Development of a Neuroevolution Machine Learning Potential of Pd-Cu-Ni-P Alloys,” SSRN Electronic Journal. 2023. link Times cited: 2 USED (low confidence) W. Yuxiang, K. Lingchao, C. Yongxiong, T. Yonggang, and L. Xiubing, “Femtosecond laser melting NbMoTaW refractory high entropy alloy: A micro-scale thermodynamic simulation,” Applied Surface Science. 2023. link Times cited: 3 USED (low confidence) S. Chen et al., “Short-range ordering alters the dislocation nucleation and propagation in refractory high-entropy alloys,” Materials Today. 2023. link Times cited: 6 USED (low confidence) A. Ferrari, F. Körmann, M. Asta, and J. Neugebauer, “Simulating short-range order in compositionally complex materials,” Nature Computational Science. 2023. link Times cited: 5 USED (low confidence) J. Mo, Y. Wan, Z. Zhang, B. Shen, and X. Liang, “The structure and mechanical properties of NbHfTaW refractory high-entropy alloy: A combined theoretical and experimental study,” International Journal of Refractory Metals and Hard Materials. 2023. link Times cited: 2 USED (low confidence) I. Lobzenko, Y. Shiihara, H. Mori, and T. Tsuru, “Influence of group IV element on basic mechanical properties of BCC medium-entropy alloys using machine-learning potentials,” Computational Materials Science. 2023. link Times cited: 1 USED (low confidence) Y.-J. Hu, “First-principles approaches and models for crystal defect energetics in metallic alloys,” Computational Materials Science. 2023. link Times cited: 4 USED (low confidence) S. Xu, W. Jian, and I. Beyerlein, “Ideal simple shear strengths of two HfNbTaTi-based quinary refractory multi-principal element alloys,” APL Materials. 2022. link Times cited: 4 Abstract: Atomistic simulations are employed to investigate chemical s… read more USED (low confidence) S. He, X. Zhou, D. Mordehai, and J. Marian, “Thermal super-jogs control high-temperature strength plateau in Nb-Mo-Ta-W alloys,” Acta Materialia. 2022. link Times cited: 4 USED (low confidence) S. Rao, C. Woodward, and B. Akdim, “Solid solution softening and hardening in binary BCC alloys,” Acta Materialia. 2022. link Times cited: 8 USED (low confidence) M. L. H. Chandrappa, J. Qi, C. Chen, S. Banerjee, and S. Ong, “Thermodynamics and Kinetics of the Cathode–Electrolyte Interface in All-Solid-State Li–S Batteries,” Journal of the American Chemical Society. 2022. link Times cited: 9 Abstract: Lithium–sulfur batteries (LSBs) are among the most promising… read more USED (low confidence) J. F. Q. Rodrigues, V. Coluci, M. del Grosso, G. da Silva Padilha, W. R. Osório, and A. D. Bortolozo, “Modeling and characterization of MoNbTiW refractory multi-principal element alloy,” Journal of Alloys and Compounds. 2022. link Times cited: 1 USED (low confidence) M. Pozuelo and J. Marian, “Microscale Deformation Controlled by Compositional Fluctuations in Equiatomic Nb-Mo-Ta-W Alloys,” SSRN Electronic Journal. 2022. link Times cited: 5 USED (low confidence) X. Zhou, S. He, and J. Marian, “Vacancy Energetics and Diffusivities in the Equiatomic Multielement Nb-Mo-Ta-W Alloy,” Materials. 2022. link Times cited: 6 Abstract: In this work, we study vacancy energetics in the equiatomic … read more USED (low confidence) X. Zhang et al., “Design of NbNiTaTi refractory high-entropy alloy via NiTi eutectic phase,” Journal of Alloys and Compounds. 2022. link Times cited: 5 USED (low confidence) D. Yang, B. Chen, S. Li, X. Ding, and J. Sun, “Effect of local lattice distortion on the core structure of edge dislocation in NbMoTaW multi-principal element alloys and the subsystems,” Materials Science and Engineering: A. 2022. link Times cited: 4 USED (low confidence) P. A. Santos-Flórez et al., “Short-range order and its impacts on the BCC MoNbTaW multi-principal element alloy by the machine-learning potential,” Acta Materialia. 2022. link Times cited: 1 USED (low confidence) B. Jiao et al., “New insights into the recrystallization behavior of large-size Mo-3Nb single crystal based on multi-scale characterization,” Journal of Materials Research and Technology. 2022. link Times cited: 1 USED (low confidence) X. Liu et al., “Atomistic understanding of incipient plasticity in BCC refractory high entropy alloys,” Journal of Alloys and Compounds. 2022. link Times cited: 16 USED (low confidence) Z. Fan, B. Xing, and P. Cao, “Predicting path-dependent diffusion barrier spectra in vast compositional space of multi-principal element alloys via convolutional neural networks,” Acta Materialia. 2022. link Times cited: 9 USED (low confidence) B. Xing, X. Wang, W. Bowman, and P. Cao, “Short-range order localizing diffusion in multi-principal element alloys,” Scripta Materialia. 2022. link Times cited: 25 USED (low confidence) F. Z. Dai, B. Wen, Y. Sun, Y. Ren, H. Xiang, and Y. Zhou, “Grain boundary segregation induced strong UHTCs at elevated temperatures: a universal mechanism from conventional UHTCs to high entropy UHTCs,” Journal of Materials Science & Technology. 2022. link Times cited: 12 USED (low confidence) S. Xu, J. Y. Cheng, Z. Li, N. Mara, and I. Beyerlein, “Phase-field modeling of the interactions between an edge dislocation and an array of obstacles,” Computer Methods in Applied Mechanics and Engineering. 2022. link Times cited: 10 USED (low confidence) S. Xu, S. Chavoshi, and Y. Su, “On calculations of basic structural parameters in multi-principal element alloys using small atomistic models,” Computational Materials Science. 2022. link Times cited: 9 USED (low confidence) T. Li, J. Miao, Y. Lu, T. Wang, and T. Li, “Effect of Zr on the as-cast microstructure and mechanical properties of lightweight Ti2VNbMoZrx refractory high-entropy alloys,” International Journal of Refractory Metals and Hard Materials. 2022. link Times cited: 25 USED (low confidence) J. Startt, A. Kustas, J. Pegues, P. Yang, and R. Dingreville, “Compositional effects on the mechanical and thermal properties of MoNbTaTi refractory complex concentrated alloys,” Materials & Design. 2022. link Times cited: 7 USED (low confidence) B. Zhang, J. Ding, and E. Ma, “Chemical short-range order in body-centered-cubic TiZrHfNb high-entropy alloys,” Applied Physics Letters. 2021. link Times cited: 14 USED (low confidence) R. Romero, S. Xu, W. Jian, I. Beyerlein, and C. Ramana, “Atomistic simulations of the local slip resistances in four refractory multi-principal element alloys,” International Journal of Plasticity. 2021. link Times cited: 23 USED (low confidence) D. E. Farache, J. C. Verduzco, Z. D. McClure, S. Desai, and A. Strachan, “Active learning and molecular dynamics simulations to find high melting temperature alloys,” Computational Materials Science. 2021. link Times cited: 9 USED (low confidence) N. K. Aragon, S. Yin, H. Lim, and I. Ryu, “Temperature dependent plasticity in BCC micropillars,” Materialia. 2021. link Times cited: 3 USED (low confidence) R. Eleti, N. Stepanov, N. Yurchenko, D. Klimenko, and S. Zherebtsov, “Plastic deformation of solid-solution strengthened Hf-Nb-Ta-Ti-Zr body-centered cubic medium/high-entropy alloys,” Scripta Materialia. 2021. link Times cited: 32 USED (low confidence) X. Wang, S. Xu, W. Jian, X.-G. Li, Y. Su, and I. Beyerlein, “Generalized stacking fault energies and Peierls stresses in refractory body-centered cubic metals from machine learning-based interatomic potentials,” Computational Materials Science. 2021. link Times cited: 30 USED (low confidence) M. Klimova, D. Shaysultanov, A. Semenyuk, S. Zherebtsov, G. Salishchev, and N. Stepanov, “Effect of nitrogen on mechanical properties of CoCrFeMnNi high entropy alloy at room and cryogenic temperatures,” Journal of Alloys and Compounds. 2020. link Times cited: 66 USED (low confidence) W. Jian, S. Xu, and I. Beyerlein, “On the significance of model design in atomistic calculations of the Peierls stress in Nb,” Computational Materials Science. 2020. link Times cited: 15 USED (low confidence) L. Smith, Y. Su, S. Xu, A. Hunter, and I. Beyerlein, “The effect of local chemical ordering on Frank-Read source activation in a refractory multi-principal element alloy,” International Journal of Plasticity. 2020. link Times cited: 43 USED (low confidence) A. Natarajan, P. Dolin, and A. V. der Ven, “Crystallography, thermodynamics and phase transitions in refractory binary alloys,” Acta Materialia. 2020. link Times cited: 26 USED (low confidence) S. Xu, A. A. Mamun, S. Mu, and Y. Su, “Uniaxial deformation of nanowires in 16 refractory multi-principal element alloys,” Journal of Alloys and Compounds. 2023. link Times cited: 1 USED (low confidence) F. Wang et al., “Atomic-scale simulations in multi-component alloys and compounds: A review on advances in interatomic potential,” Journal of Materials Science & Technology. 2023. link Times cited: 9 USED (low confidence) X. Liu et al., “A statistics-based study and machine-learning of stacking fault energies in HEAs,” Journal of Alloys and Compounds. 2023. link Times cited: 0 USED (low confidence) S. Xu, Y. Su, W. Jian, and I. Beyerlein, “Local slip resistances in equal-molar MoNbTi multi-principal element alloy,” Acta Materialia. 2021. link Times cited: 48 NOT USED (low confidence) M. Hodapp, “Machine learning is funny but physics makes the money: How machine-learning potentials can advance computer-aided materials design in metallurgy,” Computational Materials Science. 2024. link Times cited: 0 NOT USED (low confidence) M. L. Taheri et al., “Understanding and leveraging short-range order in compositionally complex alloys,” MRS Bulletin. 2023. link Times cited: 0 NOT USED (low confidence) M. C. Barry, J. R. Gissinger, M. Chandross, K. Wise, S. Kalidindi, and S. Kumar, “Voxelized atomic structure framework for materials design and discovery,” Computational Materials Science. 2023. link Times cited: 0 NOT USED (low confidence) S. Röcken and J. Zavadlav, “Accurate machine learning force fields via experimental and simulation data fusion,” ArXiv. 2023. link Times cited: 0 Abstract: Machine Learning (ML)-based force fields are attracting ever… read more NOT USED (low confidence) A. Anand, S.-J. Liu, and C. V. Singh, “Recent advances in computational design of structural multi-principal element alloys,” iScience. 2023. link Times cited: 1 NOT USED (low confidence) Z. Ma and Z. Pan, “Efficient machine learning of solute segregation energy based on physics-informed features,” Scientific Reports. 2023. link Times cited: 0 NOT USED (low confidence) V. Sotskov, E. Podryabinkin, and A. Shapeev, “A machine-learning potential-based generative algorithm for on-lattice crystal structure prediction,” Journal of Materials Research. 2023. link Times cited: 1 Abstract: We propose a method for crystal structure prediction based o… read more NOT USED (low confidence) K. Elder, J. Berry, B. Bocklund, S. McCall, A. Perron, and J. McKeown, “Computational discovery of ultra-strong, stable, and lightweight refractory multi-principal element alloys. Part I: design principles and rapid down-selection,” npj Computational Materials. 2023. link Times cited: 0 NOT USED (low confidence) W. Ji and M. Wu, “Retainable short-range order effects on the strength and toughness of NbMoTaW refractory high-entropy alloys,” Intermetallics. 2022. link Times cited: 2 NOT USED (low confidence) X. Liu, J. Zhang, and Z. Pei, “Machine Learning for High-entropy Alloys: Progress, Challenges and Opportunities,” Progress in Materials Science. 2022. link Times cited: 41 NOT USED (low confidence) J. Byggmästar, K. Nordlund, and F. Djurabekova, “Simple machine-learned interatomic potentials for complex alloys,” Physical Review Materials. 2022. link Times cited: 5 Abstract: Developing data-driven machine-learning interatomic potentia… read more NOT USED (low confidence) A. Pandey, J. Gigax, and R. Pokharel, “Machine Learning Interatomic Potential for High-Throughput Screening of High-Entropy Alloys,” JOM. 2022. link Times cited: 1 NOT USED (low confidence) E. Huang et al., “Machine-learning and high-throughput studies for high-entropy materials,” Materials Science and Engineering: R: Reports. 2022. link Times cited: 39 NOT USED (low confidence) S. Zhao, “Application of machine learning in understanding the irradiation damage mechanism of high-entropy materials,” Journal of Nuclear Materials. 2021. link Times cited: 14 NOT USED (low confidence) G. Hart, T. Mueller, C. Toher, and S. Curtarolo, “Machine learning for alloys,” Nature Reviews Materials. 2021. link Times cited: 169 NOT USED (low confidence) H. Yanxon, D. Zagaceta, B. Tang, D. Matteson, and Q. Zhu, “PyXtal_FF: a python library for automated force field generation,” Machine Learning: Science and Technology. 2020. link Times cited: 15 Abstract: We present PyXtal_FF—a package based on Python programming l… read more NOT USED (low confidence) H. Inui, K. Kishida, and Z. Chen, “Recent Progress in Our Understanding of Phase Stability, Atomic Structures and Mechanical and Functional Properties of High-Entropy Alloys,” MATERIALS TRANSACTIONS. 2022. link Times cited: 13 Abstract: This paper reviews a current trend and recent progress in re… read more NOT USED (high confidence) M. Minotakis, H. Rossignol, M. Cobelli, and S. Sanvito, “Machine-learning surrogate model for accelerating the search of stable ternary alloys,” Physical Review Materials. 2023. link Times cited: 1 Abstract: The prediction of phase diagrams in the search for new phase… read more NOT USED (high confidence) X.-G. Li, S. Xu, Q. Zhang, S. Liu, and J. Shuai, “Complex strengthening mechanisms in nanocrystalline Ni-Mo alloys revealed by a machine-learning interatomic potential,” Journal of Alloys and Compounds. 2023. link Times cited: 2 NOT USED (high confidence) B. Waters, D. S. Karls, I. Nikiforov, R. Elliott, E. Tadmor, and B. Runnels, “Automated determination of grain boundary energy and potential-dependence using the OpenKIM framework,” Computational Materials Science. 2022. link Times cited: 5 NOT USED (high confidence) X. Wang, N.-D. Tran, S. Zeng, C. Hou, Y. Chen, and J. Ni, “Element-wise representations with ECNet for material property prediction and applications in high-entropy alloys,” npj Computational Materials. 2022. link Times cited: 2 NOT USED (high confidence) C. D. Woodgate and J. Staunton, “Short-range order and compositional phase stability in refractory high-entropy alloys via first-principles theory and atomistic modeling: NbMoTa, NbMoTaW, and VNbMoTaW,” Physical Review Materials. 2022. link Times cited: 4 Abstract: Using an all-electron, first principles, Landau-type theory,… read more NOT USED (high confidence) I. Novikov, O. Kovalyova, A. Shapeev, and M. Hodapp, “AI-accelerated materials informatics method for the discovery of ductile alloys,” Journal of Materials Research. 2022. link Times cited: 3 Abstract: In computational materials science, a common means for predi… read more NOT USED (high confidence) R. Wang et al., “Classical and machine learning interatomic potentials for BCC vanadium,” Physical Review Materials. 2022. link Times cited: 3 Abstract: BCC transition metals (TMs) exhibit complex temperature and … read more NOT USED (high confidence) D. Aksoy et al., “Chemical order transitions within extended interfacial segregation zones in NbMoTaW,” Journal of Applied Physics. 2022. link Times cited: 2 Abstract: Interfacial segregation and chemical short-range ordering in… read more NOT USED (high confidence) C. Liu et al., “Medical high-entropy alloy: Outstanding mechanical properties and superb biological compatibility,” Frontiers in Bioengineering and Biotechnology. 2022. link Times cited: 5 Abstract: Medical metal implants are required to have excellent mechan… read more NOT USED (high confidence) D. Marchand and W. Curtin, “Machine learning for metallurgy IV: A neural network potential for Al-Cu-Mg and Al-Cu-Mg-Zn,” Physical Review Materials. 2022. link Times cited: 7 NOT USED (high confidence) X. Zhou and J. Marian, “Temperature and Stress Dependence of Screw Dislocation Mobility in Nb-V-Ta Alloys Using Kinetic Monte Carlo Simulations,” Frontiers in Materials. 2021. link Times cited: 4 Abstract: In this work we present simulations of thermally-activated s… read more NOT USED (high confidence) H. Zhuang, “Sudoku-Inspired High-Shannon-Entropy Alloys,” Acta Materialia. 2021. link Times cited: 5 NOT USED (high confidence) S. Yin et al., “Atomistic simulations of dislocation mobility in refractory high-entropy alloys and the effect of chemical short-range order,” Nature Communications. 2021. link Times cited: 121 NOT USED (high confidence) J. Byggmästar, K. Nordlund, and F. Djurabekova, “Modeling refractory high-entropy alloys with efficient machine-learned interatomic potentials: Defects and segregation,” Physical Review B. 2021. link Times cited: 32 Abstract: We develop a fast and accurate machine-learned interatomic p… read more NOT USED (high confidence) G. Nikoulis, J. Byggmästar, J. Kioseoglou, K. Nordlund, and F. Djurabekova, “Machine-learning interatomic potential for W–Mo alloys,” Journal of Physics: Condensed Matter. 2021. link Times cited: 9 Abstract: In this work, we develop a machine-learning interatomic pote… read more NOT USED (high confidence) Z. Leong, U. Ramamurty, and T. L. Tan, “Microstructural and compositional design principles for Mo-V-Nb-Ti-Zr multi-principal element alloys: a high-throughput first-principles study,” Acta Materialia. 2021. link Times cited: 13 NOT USED (high confidence) N. Birbilis, S. Choudhary, J. Scully, and M. Taheri, “A perspective on corrosion of multi-principal element alloys,” npj Materials Degradation. 2021. link Times cited: 49 NOT USED (high confidence) J. Qi et al., “Bridging the gap between simulated and experimental ionic conductivities in lithium superionic conductors,” Materials Today Physics. 2021. link Times cited: 33 NOT USED (high confidence) S. Nikolov et al., “Data-driven magneto-elastic predictions with scalable classical spin-lattice dynamics,” npj Computational Materials. 2021. link Times cited: 25 NOT USED (high confidence) X. Liu, J. Zhang, J. Yin, S. Bi, M. Eisenbach, and Y. Wang, “Monte Carlo simulation of order-disorder transition in refractory high entropy alloys: A data-driven approach,” Computational Materials Science. 2020. link Times cited: 35 NOT USED (high confidence) Y.-J. Hu, A. Sundar, S. Ogata, and L. Qi, “Screening of generalized stacking fault energies, surface energies and intrinsic ductile potency of refractory multicomponent alloys,” Acta Materialia. 2020. link Times cited: 41 |
| Funding | Not available |
| Short KIM ID
The unique KIM identifier code.
| MO_560387080449_000 |
| Extended KIM ID
The long form of the KIM ID including a human readable prefix (100 characters max), two underscores, and the Short KIM ID. Extended KIM IDs can only contain alpha-numeric characters (letters and digits) and underscores and must begin with a letter.
| SNAP_LiChenZheng_2019_NbTaWMo__MO_560387080449_000 |
| DOI |
10.25950/c34c3362 https://doi.org/10.25950/c34c3362 https://commons.datacite.org/doi.org/10.25950/c34c3362 |
| KIM Item Type
Specifies whether this is a Portable Model (software implementation of an interatomic model); Portable Model with parameter file (parameter file to be read in by a Model Driver); Model Driver (software implementation of an interatomic model that reads in parameters).
| Portable Model using Model Driver SNAP__MD_536750310735_000 |
| Driver | SNAP__MD_536750310735_000 |
| KIM API Version | 2.0 |
| Potential Type | snap |
| Grade | Name | Category | Brief Description | Full Results | Aux File(s) |
|---|---|---|---|---|---|
| P | vc-species-supported-as-stated | mandatory | The model supports all species it claims to support; see full description. |
Results | Files |
| P | vc-periodicity-support | mandatory | Periodic boundary conditions are handled correctly; see full description. |
Results | Files |
| P | vc-permutation-symmetry | mandatory | Total energy and forces are unchanged when swapping atoms of the same species; see full description. |
Results | Files |
| A | vc-forces-numerical-derivative | consistency | Forces computed by the model agree with numerical derivatives of the energy; see full description. |
Results | Files |
| P | vc-dimer-continuity-c1 | informational | The energy versus separation relation of a pair of atoms is C1 continuous (i.e. the function and its first derivative are continuous); see full description. |
Results | Files |
| P | vc-objectivity | informational | Total energy is unchanged and forces transform correctly under rigid-body translation and rotation; see full description. |
Results | Files |
| P | vc-inversion-symmetry | informational | Total energy is unchanged and forces change sign when inverting a configuration through the origin; see full description. |
Results | Files |
| P | vc-memory-leak | informational | The model code does not have memory leaks (i.e. it releases all allocated memory at the end); see full description. |
Results | Files |
| P | vc-thread-safe | mandatory | The model returns the same energy and forces when computed in serial and when using parallel threads for a set of configurations. Note that this is not a guarantee of thread safety; see full description. |
Results | Files |
| N/A | vc-unit-conversion | mandatory | The model is able to correctly convert its energy and/or forces to different unit sets; see full description. |
Results | Files |
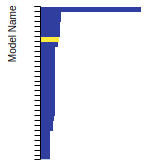
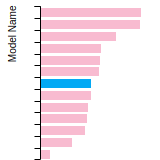
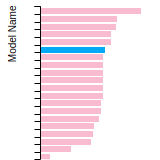
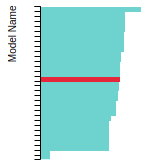
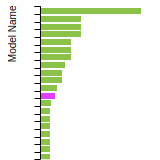
BCC Lattice Constant
This bar chart plot shows the mono-atomic body-centered cubic (bcc) lattice constant predicted by the current model (shown in the unique color) compared with the predictions for all other models in the OpenKIM Repository that support the species. The vertical bars show the average and standard deviation (one sigma) bounds for all model predictions. Graphs are generated for each species supported by the model.
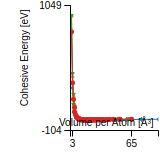
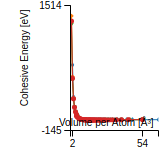
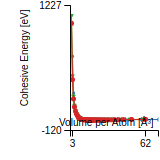
Cohesive Energy Graph
This graph shows the cohesive energy versus volume-per-atom for the current mode for four mono-atomic cubic phases (body-centered cubic (bcc), face-centered cubic (fcc), simple cubic (sc), and diamond). The curve with the lowest minimum is the ground state of the crystal if stable. (The crystal structure is enforced in these calculations, so the phase may not be stable.) Graphs are generated for each species supported by the model.

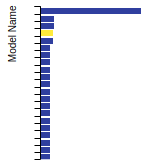
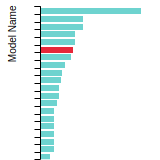
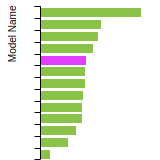
Diamond Lattice Constant
This bar chart plot shows the mono-atomic face-centered diamond lattice constant predicted by the current model (shown in the unique color) compared with the predictions for all other models in the OpenKIM Repository that support the species. The vertical bars show the average and standard deviation (one sigma) bounds for all model predictions. Graphs are generated for each species supported by the model.


Dislocation Core Energies
This graph shows the dislocation core energy of a cubic crystal at zero temperature and pressure for a specific set of dislocation core cutoff radii. After obtaining the total energy of the system from conjugate gradient minimizations, non-singular, isotropic and anisotropic elasticity are applied to obtain the dislocation core energy for each of these supercells with different dipole distances. Graphs are generated for each species supported by the model.
(No matching species)FCC Elastic Constants
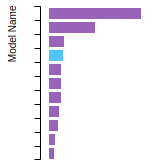
This bar chart plot shows the mono-atomic face-centered cubic (fcc) elastic constants predicted by the current model (shown in blue) compared with the predictions for all other models in the OpenKIM Repository that support the species. The vertical bars show the average and standard deviation (one sigma) bounds for all model predictions. Graphs are generated for each species supported by the model.
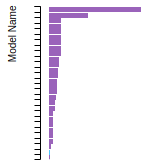

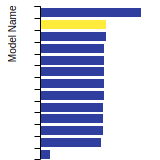
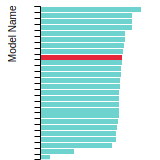
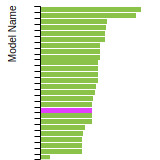
FCC Lattice Constant
This bar chart plot shows the mono-atomic face-centered cubic (fcc) lattice constant predicted by the current model (shown in red) compared with the predictions for all other models in the OpenKIM Repository that support the species. The vertical bars show the average and standard deviation (one sigma) bounds for all model predictions. Graphs are generated for each species supported by the model.
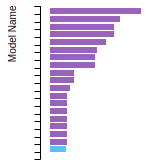
FCC Stacking Fault Energies
This bar chart plot shows the intrinsic and extrinsic stacking fault energies as well as the unstable stacking and unstable twinning energies for face-centered cubic (fcc) predicted by the current model (shown in blue) compared with the predictions for all other models in the OpenKIM Repository that support the species. The vertical bars show the average and standard deviation (one sigma) bounds for all model predictions. Graphs are generated for each species supported by the model.
(No matching species)FCC Surface Energies
This bar chart plot shows the mono-atomic face-centered cubic (fcc) relaxed surface energies predicted by the current model (shown in blue) compared with the predictions for all other models in the OpenKIM Repository that support the species. The vertical bars show the average and standard deviation (one sigma) bounds for all model predictions. Graphs are generated for each species supported by the model.
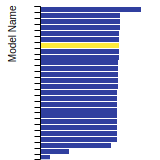
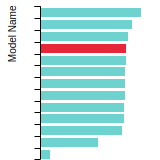
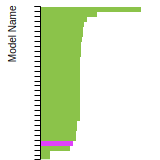
(No matching species)SC Lattice Constant
This bar chart plot shows the mono-atomic simple cubic (sc) lattice constant predicted by the current model (shown in the unique color) compared with the predictions for all other models in the OpenKIM Repository that support the species. The vertical bars show the average and standard deviation (one sigma) bounds for all model predictions. Graphs are generated for each species supported by the model.
Cubic Crystal Basic Properties Table
Species: MoSpecies: Nb
Species: Ta
Species: W
Disclaimer From Model Developer
This potential is designed for Nb-Mo-Ta-W chemistries, including the elementary, binary, ternary and quaternary systems. The potential was trained using LAMMPS version 17Nov2016. Newer LAMMPS may see energy differences, but the relative values should remain to be the same.
Creators:
Contributor: karls
Publication Year: 2019
DOI: https://doi.org/10.25950/64cb38c5
This Test Driver uses LAMMPS to compute the cohesive energy of a given monoatomic cubic lattice (fcc, bcc, sc, or diamond) at a variety of lattice spacings. The lattice spacings range from a_min (=a_min_frac*a_0) to a_max (=a_max_frac*a_0) where a_0, a_min_frac, and a_max_frac are read from stdin (a_0 is typically approximately equal to the equilibrium lattice constant). The precise scaling and number of lattice spacings sampled between a_min and a_0 (a_0 and a_max) is specified by two additional parameters passed from stdin: N_lower and samplespacing_lower (N_upper and samplespacing_upper). Please see README.txt for further details.
Creators: Junhao Li and Ellad Tadmor
Contributor: tadmor
Publication Year: 2019
DOI: https://doi.org/10.25950/5853fb8f
Computes the cubic elastic constants for some common crystal types (fcc, bcc, sc, diamond) by calculating the hessian of the energy density with respect to strain. An estimate of the error associated with the numerical differentiation performed is reported.
Creators:
Contributor: ilia
Publication Year: 2025
DOI: https://doi.org/10.25950/866c7cfa
Computes the equilibrium crystal structure and energy for an arbitrary crystal at zero temperature and applied stress by performing symmetry-constrained relaxation. The crystal structure is specified using the AFLOW prototype designation. Multiple sets of free parameters corresponding to the crystal prototype may be specified as initial guesses for structure optimization. No guarantee is made regarding the stability of computed equilibria, nor that any are the ground state.
Creators: Brandon Runnels
Contributor: brunnels
Publication Year: 2019
DOI: https://doi.org/10.25950/4723cee7
Computes grain boundary energy for a range of tilt angles given a crystal structure, tilt axis, and material.
| Test | Test Results | Link to Test Results page | Benchmark time
Usertime multiplied by the Whetstone Benchmark. This number can be used (approximately) to compare the performance of different models independently of the architecture on which the test was run.
Measured in Millions of Whetstone Instructions (MWI) |
|---|---|---|---|
| Relaxed energy as a function of tilt angle for a 110 symmetric tilt grain boundary in bcc Mo v000 | view | 288223656 | |
| Relaxed energy as a function of tilt angle for a 112 symmetric tilt grain boundary in bcc Mo v000 | view | 561591535 |
Creators:
Contributor: brunnels
Publication Year: 2022
DOI: https://doi.org/10.25950/2c59c9d6
Computes grain boundary energy for a range of tilt angles given a crystal structure, tilt axis, and material.
| Test | Test Results | Link to Test Results page | Benchmark time
Usertime multiplied by the Whetstone Benchmark. This number can be used (approximately) to compare the performance of different models independently of the architecture on which the test was run.
Measured in Millions of Whetstone Instructions (MWI) |
|---|---|---|---|
| Relaxed energy as a function of tilt angle for a 100 symmetric tilt grain boundary in bcc Mo v001 | view | 311243079 | |
| Relaxed energy as a function of tilt angle for a 111 symmetric tilt grain boundary in bcc Mo v001 | view | 525966027 |
Creators: Daniel S. Karls and Junhao Li
Contributor: karls
Publication Year: 2019
DOI: https://doi.org/10.25950/2765e3bf
Equilibrium lattice constant and cohesive energy of a cubic lattice at zero temperature and pressure.
Creators: Daniel S. Karls and Junhao Li
Contributor: karls
Publication Year: 2019
DOI: https://doi.org/10.25950/c339ca32
Calculates lattice constant of hexagonal bulk structures at zero temperature and pressure by using simplex minimization to minimize the potential energy.
| Test | Test Results | Link to Test Results page | Benchmark time
Usertime multiplied by the Whetstone Benchmark. This number can be used (approximately) to compare the performance of different models independently of the architecture on which the test was run.
Measured in Millions of Whetstone Instructions (MWI) |
|---|---|---|---|
| Equilibrium lattice constants for hcp Mo v005 | view | 32677 | |
| Equilibrium lattice constants for hcp Nb v005 | view | 36061 | |
| Equilibrium lattice constants for hcp Ta v005 | view | 30453 | |
| Equilibrium lattice constants for hcp W v005 | view | 32427 |
Creators:
Contributor: mjwen
Publication Year: 2024
DOI: https://doi.org/10.25950/9d9822ec
This Test Driver uses LAMMPS to compute the linear thermal expansion coefficient at a finite temperature under a given pressure for a cubic lattice (fcc, bcc, sc, diamond) of a single given species.
| Test | Test Results | Link to Test Results page | Benchmark time
Usertime multiplied by the Whetstone Benchmark. This number can be used (approximately) to compare the performance of different models independently of the architecture on which the test was run.
Measured in Millions of Whetstone Instructions (MWI) |
|---|---|---|---|
| Linear thermal expansion coefficient of bcc Mo at 293.15 K under a pressure of 0 MPa v002 | view | 12900928 | |
| Linear thermal expansion coefficient of bcc Ta at 293.15 K under a pressure of 0 MPa v002 | view | 9863748 | |
| Linear thermal expansion coefficient of bcc W at 293.15 K under a pressure of 0 MPa v002 | view | 8366105 |
Creators: Matt Bierbaum
Contributor: mattbierbaum
Publication Year: 2019
DOI: https://doi.org/10.25950/6c43a4e6
Calculates the surface energy of several high symmetry surfaces and produces a broken-bond model fit. In latex form, the fit equations are given by:
E_{FCC} (\vec{n}) = p_1 (4 \left( |x+y| + |x-y| + |x+z| + |x-z| + |z+y| +|z-y|\right)) + p_2 (8 \left( |x| + |y| + |z|\right)) + p_3 (2 ( |x+ 2y + z| + |x+2y-z| + |x-2y + z| + |x-2y-z| + |2x+y+z| + |2x+y-z| +|2x-y+z| +|2x-y-z| +|x+y+2z| +|x+y-2z| +|x-y+2z| +|x-y-2z| ) + c
E_{BCC} (\vec{n}) = p_1 (6 \left( | x+y+z| + |x+y-z| + |-x+y-z| + |x-y+z| \right)) + p_2 (8 \left( |x| + |y| + |z|\right)) + p_3 (4 \left( |x+y| + |x-y| + |x+z| + |x-z| + |z+y| +|z-y|\right)) +c.
In Python, these two fits take the following form:
def BrokenBondFCC(params, index):
import numpy
x, y, z = index
x = x / numpy.sqrt(x**2.+y**2.+z**2.)
y = y / numpy.sqrt(x**2.+y**2.+z**2.)
z = z / numpy.sqrt(x**2.+y**2.+z**2.)
return params[0]*4* (abs(x+y) + abs(x-y) + abs(x+z) + abs(x-z) + abs(z+y) + abs(z-y)) + params[1]*8*(abs(x) + abs(y) + abs(z)) + params[2]*(abs(x+2*y+z) + abs(x+2*y-z) +abs(x-2*y+z) +abs(x-2*y-z) + abs(2*x+y+z) +abs(2*x+y-z) +abs(2*x-y+z) +abs(2*x-y-z) + abs(x+y+2*z) +abs(x+y-2*z) +abs(x-y+2*z) +abs(x-y-2*z))+params[3]
def BrokenBondBCC(params, x, y, z):
import numpy
x, y, z = index
x = x / numpy.sqrt(x**2.+y**2.+z**2.)
y = y / numpy.sqrt(x**2.+y**2.+z**2.)
z = z / numpy.sqrt(x**2.+y**2.+z**2.)
return params[0]*6*(abs(x+y+z) + abs(x-y-z) + abs(x-y+z) + abs(x+y-z)) + params[1]*8*(abs(x) + abs(y) + abs(z)) + params[2]*4* (abs(x+y) + abs(x-y) + abs(x+z) + abs(x-z) + abs(z+y) + abs(z-y)) + params[3]
| Test | Test Results | Link to Test Results page | Benchmark time
Usertime multiplied by the Whetstone Benchmark. This number can be used (approximately) to compare the performance of different models independently of the architecture on which the test was run.
Measured in Millions of Whetstone Instructions (MWI) |
|---|---|---|---|
| Broken-bond fit of high-symmetry surface energies in bcc Mo v004 | view | 157245 | |
| Broken-bond fit of high-symmetry surface energies in bcc Nb v004 | view | 224855 | |
| Broken-bond fit of high-symmetry surface energies in bcc Ta v004 | view | 142301 | |
| Broken-bond fit of high-symmetry surface energies in bcc W v004 | view | 129174 |
Creators:
Contributor: efuem
Publication Year: 2023
DOI: https://doi.org/10.25950/c27ba3cd
Computes the monovacancy formation and migration energies for cubic and hcp monoatomic crystals.
| Test | Test Results | Link to Test Results page | Benchmark time
Usertime multiplied by the Whetstone Benchmark. This number can be used (approximately) to compare the performance of different models independently of the architecture on which the test was run.
Measured in Millions of Whetstone Instructions (MWI) |
|---|---|---|---|
| Vacancy formation and migration energy for bcc Mo | view | 2573036 | |
| Vacancy formation and migration energy for bcc Nb | view | 7168502 | |
| Vacancy formation and migration energy for bcc W | view | 2220247 |
ElasticConstantsCubic__TD_011862047401_006
| Test | Error Categories | Link to Error page |
|---|---|---|
| Elastic constants for diamond Mo at zero temperature v001 | other | view |
| Elastic constants for diamond Nb at zero temperature v001 | other | view |
| Elastic constants for diamond Ta at zero temperature v001 | other | view |
ElasticConstantsHexagonal__TD_612503193866_004
| Test | Error Categories | Link to Error page |
|---|---|---|
| Elastic constants for hcp Mo at zero temperature v004 | other | view |
| Elastic constants for hcp Nb at zero temperature v004 | other | view |
| Elastic constants for hcp Ta at zero temperature v004 | other | view |
| Elastic constants for hcp W at zero temperature v004 | other | view |
EquilibriumCrystalStructure__TD_457028483760_003
| Test | Error Categories | Link to Error page |
|---|---|---|
| Equilibrium crystal structure and energy for Ta in AFLOW crystal prototype A_tP22_81_g5h v003 | other | view |
| Equilibrium crystal structure and energy for Ta in AFLOW crystal prototype A_tP30_113_c3e2f v003 | other | view |
GrainBoundaryCubicCrystalSymmetricTiltRelaxedEnergyVsAngle__TD_410381120771_003
| Test | Error Categories | Link to Error page |
|---|---|---|
| Relaxed energy as a function of tilt angle for a 110 symmetric tilt grain boundary in bcc Mo v001 | other | view |
| Relaxed energy as a function of tilt angle for a 112 symmetric tilt grain boundary in bcc Mo v001 | other | view |
VacancyFormationEnergyRelaxationVolume__TD_647413317626_001
| Test | Error Categories | Link to Error page |
|---|---|---|
| Monovacancy formation energy and relaxation volume for bcc Mo | other | view |
| Monovacancy formation energy and relaxation volume for bcc Nb | other | view |
| Monovacancy formation energy and relaxation volume for bcc W | other | view |
No Driver
| Verification Check | Error Categories | Link to Error page |
|---|---|---|
| MemoryLeak__VC_561022993723_004 | other | view |
| SNAP_LiChenZheng_2019_NbTaWMo__MO_560387080449_000.txz | Tar+XZ | Linux and OS X archive |
| SNAP_LiChenZheng_2019_NbTaWMo__MO_560387080449_000.zip | Zip | Windows archive |
This Model requires a Model Driver. Archives for the Model Driver SNAP__MD_536750310735_000 appear below.
| SNAP__MD_536750310735_000.txz | Tar+XZ | Linux and OS X archive |
| SNAP__MD_536750310735_000.zip | Zip | Windows archive |