Citations
This panel presents information regarding the papers that have cited the interatomic potential (IP) whose page you are on.
The OpenKIM machine learning based Deep Citation framework is used to determine whether the citing article actually used the IP in computations (denoted by "USED") or only provides it as a background citation (denoted by "NOT USED"). For more details on Deep Citation and how to work with this panel, click the documentation link at the top of the panel.
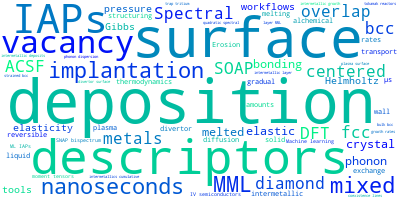
The word cloud to the right is generated from the abstracts of IP principle source(s) (given below in "How to Cite") and the citing articles that were determined to have used the IP in order to provide users with a quick sense of the types of physical phenomena to which this IP is applied.
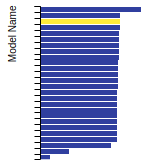
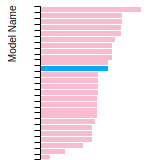
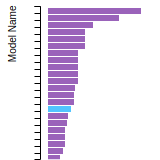
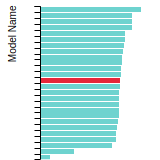
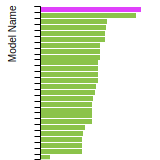
The bar chart shows the number of articles that cited the IP per year. Each bar is divided into green (articles that USED the IP) and blue (articles that did NOT USE the IP).
Users are encouraged to correct Deep Citation errors in determination by clicking the speech icon next to a citing article and providing updated information. This will be integrated into the next Deep Citation learning cycle, which occurs on a regular basis.
OpenKIM acknowledges the support of the Allen Institute for AI through the Semantic Scholar project for providing citation information and full text of articles when available, which are used to train the Deep Citation ML algorithm.
|
This panel provides information on past usage of this interatomic potential (IP) powered by the OpenKIM Deep Citation framework. The word cloud indicates typical applications of the potential. The bar chart shows citations per year of this IP (bars are divided into articles that used the IP (green) and those that did not (blue)). The complete list of articles that cited this IP is provided below along with the Deep Citation determination on usage. See the Deep Citation documentation for more information.
350 Citations (7 used)
Help us to determine which of the papers that cite this potential actually used it to perform calculations. If you know, click the .
USED (high confidence) B. Waters, D. S. Karls, I. Nikiforov, R. Elliott, E. Tadmor, and B. Runnels, “Automated determination of grain boundary energy and potential-dependence using the OpenKIM framework,” Computational Materials Science. 2022. link Times cited: 5 USED (high confidence) T. Lee et al., “Atomic-scale origin of the low grain-boundary resistance in perovskite solid electrolyte Li0.375Sr0.4375Ta0.75Zr0.25O3,” Nature Communications. 2022. link Times cited: 9 USED (high confidence) H. Zheng et al., “Multi-scale investigation of short-range order and dislocation glide in MoNbTi and TaNbTi multi-principal element alloys,” npj Computational Materials. 2022. link Times cited: 8 USED (high confidence) S. Xie, M. Rupp, and R. Hennig, “Ultra-fast interpretable machine-learning potentials,” npj Computational Materials. 2021. link Times cited: 9 USED (high confidence) A. Shapeev, D. Bocharov, and A. Kuzmin, “Validation of moment tensor potentials for fcc and bcc metals using EXAFS spectra,” Computational Materials Science. 2021. link Times cited: 6 USED (high confidence) S. Menon, Y. Lysogorskiy, J. Rogal, and R. Drautz, “Automated free-energy calculation from atomistic simulations,” Physical Review Materials. 2021. link Times cited: 5 Abstract: We devise automated workflows for the calculation of Helmhol… read moreAbstract: We devise automated workflows for the calculation of Helmholtz and Gibbs free energies and their temperature and pressure dependence and provide the corresponding computational tools. We employ non-equilibrium thermodynamics for evaluating the free energy of solid and liquid phases at a given temperature and reversible scaling for computing free energies over a wide range of temperatures, including the direct integration of PT coexistence lines. By changing the chemistry and the interatomic potential, alchemical and upscaling free energy calculations are possible. Several examples illustrate the accuracy and efficiency of our implementation. read less USED (high confidence) M. Cusentino, M. A. Wood, and A. Thompson, “Beryllium-driven structural evolution at the divertor surface,” Nuclear Fusion. 2021. link Times cited: 4 Abstract: Erosion of the beryllium first wall material in tokamak reac… read moreAbstract: Erosion of the beryllium first wall material in tokamak reactors has been shown to result in transport and deposition on the tungsten divertor. Experimental studies of beryllium implantation in tungsten indicate that mixed W–Be intermetallic deposits can form, which have lower melting temperatures than tungsten and can trap tritium at higher rates. To better understand the formation and growth rate of these intermetallics, cumulative molecular dynamics (MD) simulations of both high and low energy beryllium deposition in tungsten were performed. In both cases, a W–Be mixed material layer (MML) emerged at the surface within several nanoseconds, either through energetic implantation or a thermally-activated exchange mechanism, respectively. While some ordering of the material into intermetallics occurred, fully ordered structures did not emerge from the deposition simulations. Targeted MD simulations of the MML to further study the rate of Be diffusion and intermetallic growth rates indicate that for both cases, the gradual re-structuring of the material into an ordered intermetallic layer is beyond accessible MD time scales(⩽1 μs). However, the rapid formation of the MML within nanoseconds indicates that beryllium deposition can influence other plasma species interactions at the surface and begin to alter the tungsten material properties. Therefore, beryllium deposition on the divertor surface, even in small amounts, is likely to cause significant changes in plasma-surface interactions and will need to be considered in future studies. read less NOT USED (low confidence) P.-A. Geslin, “Modeling of solid solution strengthening in FCC alloys: Atomistic simulations, statistical models and elastic continuous approaches,” Computational Materials Science. 2024. link Times cited: 0 NOT USED (low confidence) M. Hodapp, “Machine learning is funny but physics makes the money: How machine-learning potentials can advance computer-aided materials design in metallurgy,” Computational Materials Science. 2024. link Times cited: 0 NOT USED (low confidence) H. Mei, L. Cheng, L. Chen, F. Wang, J. Li, and L. Kong, “Development of machine learning interatomic potential for zinc,” Computational Materials Science. 2024. link Times cited: 0 NOT USED (low confidence) K. Tolborg and A. Walsh, “Low-Cost Vibrational Free Energies in Solid Solutions with Machine Learning Force Fields.,” The journal of physical chemistry letters. 2023. link Times cited: 0 Abstract: The rational design of alloys and solid solutions relies on … read moreAbstract: The rational design of alloys and solid solutions relies on accurate computational predictions of phase diagrams. The cluster expansion method has proven to be a valuable tool for studying disordered crystals. However, the effects of vibrational entropy are commonly neglected due to the computational cost. Here, we devise a method for including the vibrational free energy in cluster expansions with a low computational cost by fitting a machine learning force field (MLFF) to the relaxation trajectories available from cluster expansion construction. We demonstrate our method for two (pseudo)binary systems, Na1-xKxCl and Ag1-xPdx, for which accurate phonon dispersions and vibrational free energies are derived from the MLFF. For both systems, the inclusion of vibrational effects results in significantly better agreement with miscibility gaps in experimental phase diagrams. This methodology can allow routine inclusion of vibrational effects in calculated phase diagrams and thus more accurate predictions of properties and stability for mixtures of materials. read less NOT USED (low confidence) T. W. Ko and S. Ong, “Recent advances and outstanding challenges for machine learning interatomic potentials,” Nature Computational Science. 2023. link Times cited: 0 NOT USED (low confidence) Z. Chen, M. Berrens, K.-T. Chan, Z. Fan, and D. Donadio, “Thermodynamics of Water and Ice from a Fast and Scalable First-Principles Neuroevolution Potential,” Journal of Chemical & Engineering Data. 2023. link Times cited: 0 NOT USED (low confidence) V. Eyert, J. Wormald, W. A. Curtin, and E. Wimmer, “Machine-learned interatomic potentials: Recent developments and prospective applications,” Journal of Materials Research. 2023. link Times cited: 0 NOT USED (low confidence) M. Nagini and B. S. Murty, “Advanced High-Entropy Alloys: A Next Generation Materials,” Transactions of the Indian National Academy of Engineering. 2023. link Times cited: 0 NOT USED (low confidence) A. Merchant, S. Batzner, S. Schoenholz, M. Aykol, G. Cheon, and E. D. Cubuk, “Scaling deep learning for materials discovery,” Nature. 2023. link Times cited: 6 NOT USED (low confidence) M. Ghosh, S. Chowdhury, A. Majumdar, and D. Jana, “Stone–Wales Decorated Phagraphene: A Potential Candidate for Supercapacitor Electrodes and Thermal Transport,” ACS Applied Electronic Materials. 2023. link Times cited: 0 NOT USED (low confidence) J. Xia, Y. Zhang, and B. Jiang, “Accuracy Assessment of Atomistic Neural Network Potentials: The Impact of Cutoff Radius and Message Passing.,” The journal of physical chemistry. A. 2023. link Times cited: 0 Abstract: Atomistic neural network potentials have achieved great succ… read moreAbstract: Atomistic neural network potentials have achieved great success in accelerating atomistic simulations in complicated systems in recent years. They are typically based on the atomic decomposition of total properties, truncating the interatomic correlations to a local environment within a given cutoff radius. A more recently developed message passing (MP) neural network framework can, in principle, incorporate nonlocal effects through iteratively correlating some atoms outside the cutoff sphere with atoms inside, a process referred to as MP. However, how the model accuracy depends on the cutoff radius and the MP process has rarely been discussed. In this work, we investigate this dependence using a recursively embedded atom neural network method that possesses both local and MP features, in two representative systems: liquid H2O and solid Al2O3. We focus on how these settings influence predictions for structural and vibrational properties, namely, radial distribution functions (RDFs) and vibrational density of states (VDOSs). We find that while MP lowers test errors of energy and forces in general, it may not improve the prediction for RDFs and/or VDOSs if direct interatomic correlations in the local environment are insufficiently described. A cutoff radius exceeding the first neighbor shell is necessary, beyond which involving MP quickly enhances the model accuracy until convergence. This is a potentially more efficient way to increase the model accuracy than directly increasing the cutoff radius, especially with more memory savings in the GPU implementation. Our findings also suggest that using the mean test error as the measure of the model accuracy alone is inadequate. read less NOT USED (low confidence) Q. Peng, X. Yuan, S. Zhao, and X.-J. Chen, “Lattice Thermal Conductivity of Mg3(Bi,Sb)2 Nanocomposites: A First-Principles Study,” Nanomaterials. 2023. link Times cited: 0 Abstract: Mg3(BixSb1−x)2 (0 ≤ x ≤ 1) nanocomposites are a highly appea… read moreAbstract: Mg3(BixSb1−x)2 (0 ≤ x ≤ 1) nanocomposites are a highly appealing class of thermoelectric materials that hold great potential for solid-state cooling applications. Tuning of the lattice thermal conductivity is crucial for improving the thermoelectric properties of these materials. Hereby, we investigated the lattice thermal conductivity of Mg3(BixSb1−x)2 nanocomposites with varying Bi content (x = 0.0, 0.25, 0.5, 0.75, and 1.0) using first-principles calculations. This study reveals that the lattice thermal conductivity follows a classical inverse temperature-dependent relationship. There is a significant decrease in the lattice thermal conductivity when the Bi content increases from 0 to 0.25 or decreases from 1.0 to 0.75 at 300 K. In contrast, when the Bi content increases from 0.25 to 0.75, the lattice thermal conductivity experiences a gradual decrease and reaches a plateau. For the nanohybrids (x = 0.25, 0.5, and 0.75), the distribution patterns of the phonon group velocity and phonon lifetime are similar, with consistent distribution intervals. Consequently, the change in lattice thermal conductivity is not pronounced. However, the phonon group speed and phonon lifetime are generally lower compared to those of the pristine components with x = 0 and x = 1.0. Our results suggest that the lattice thermal conductivity is sensitive to impurities but not to concentrations. This research provides valuable theoretical insights for adjusting the lattice thermal conductivity of Mg3(BixSb1−x)2 nanocomposites. read less NOT USED (low confidence) J.-R. Hill and W. Mannstadt, “Machine-learned potentials for eucryptite: A systematic comparison,” Journal of Materials Research. 2023. link Times cited: 1 NOT USED (low confidence) E. Cho, W.-J. Son, E. Cho, I. Jang, D. S. Kim, and K. Min, “Atomistic insights into adhesion characteristics of tungsten on titanium nitride using steered molecular dynamics with machine learning interatomic potential,” Scientific Reports. 2023. link Times cited: 0 NOT USED (low confidence) X. Lian and M. Salanne, “Capturing the interactions in the BaSnF4 ionic conductor: Comparison between a machine-learning potential and a polarizable force field.,” The Journal of chemical physics. 2023. link Times cited: 0 Abstract: BaSnF4 is a prospective solid state electrolyte for fluoride… read moreAbstract: BaSnF4 is a prospective solid state electrolyte for fluoride ion batteries. However, the diffusion mechanism of the fluoride ions remains difficult to study, both in experiments and in simulations. In principle, ab initio molecular dynamics could allow to fill this gap, but this method remains very costly from the computational point of view. Using machine learning potentials is a promising method that can potentially address the accuracy issues of classical empirical potentials while maintaining high efficiency. In this work, we fitted a dipole polarizable ion model and trained machine learning potential for BaSnF4 and made comprehensive comparisons on the ease of training, accuracy and efficiency. We also compared the results with the case of a simpler ionic system (NaF). We show that contrarily to the latter, for BaSnF4 the machine learning potential offers much higher versatility. The current work lays foundations for the investigation of fluoride ion mobility in BaSnF4 and provides insight on the choice of methods for atomistic simulations. read less NOT USED (low confidence) J. A. Dawson, “Going against the Grain: Atomistic Modeling of Grain Boundaries in Solid Electrolytes for Solid-State Batteries,” ACS Materials Au. 2023. link Times cited: 1 NOT USED (low confidence) J. A. Vita and D. Trinkle, “Spline-based neural network interatomic potentials: blending classical and machine learning models,” ArXiv. 2023. link Times cited: 0 Abstract: While machine learning (ML) interatomic potentials (IPs) are… read moreAbstract: While machine learning (ML) interatomic potentials (IPs) are able to achieve accuracies nearing the level of noise inherent in the first-principles data to which they are trained, it remains to be shown if their increased complexities are strictly necessary for constructing high-quality IPs. In this work, we introduce a new MLIP framework which blends the simplicity of spline-based MEAM (s-MEAM) potentials with the flexibility of a neural network (NN) architecture. The proposed framework, which we call the spline-based neural network potential (s-NNP), is a simplified version of the traditional NNP that can be used to describe complex datasets in a computationally efficient manner. We demonstrate how this framework can be used to probe the boundary between classical and ML IPs, highlighting the benefits of key architectural changes. Furthermore, we show that using spline filters for encoding atomic environments results in a readily interpreted embedding layer which can be coupled with modifications to the NN to incorporate expected physical behaviors and improve overall interpretability. Finally, we test the flexibility of the spline filters, observing that they can be shared across multiple chemical systems in order to provide a convenient reference point from which to begin performing cross-system analyses. read less NOT USED (low confidence) D. G. Kizzire et al., “Modified embedded atom method interatomic potential for FCC γ-cerium,” Computational Materials Science. 2023. link Times cited: 0 NOT USED (low confidence) B. Sharma, Y. S. Teh, B. Sadigh, S. Hamel, V. Bulatov, and A. Samanta, “Development of an interatomic potential for the W–Ta system,” Computational Materials Science. 2023. link Times cited: 0 NOT USED (low confidence) H. Mei et al., “Development of Machine Learning and Empirical Interatomic Potentials for the Binary Zr-Sn System,” Journal of Nuclear Materials. 2023. link Times cited: 0 NOT USED (low confidence) G. Ge et al., “Silicon phase transitions in nanoindentation: Advanced molecular dynamics simulations with machine learning phase recognition,” Acta Materialia. 2023. link Times cited: 0 NOT USED (low confidence) N. Fedik et al., “Synergy of semiempirical models and machine learning in computational chemistry.,” The Journal of chemical physics. 2023. link Times cited: 1 Abstract: Catalyzed by enormous success in the industrial sector, many… read moreAbstract: Catalyzed by enormous success in the industrial sector, many research programs have been exploring data-driven, machine learning approaches. Performance can be poor when the model is extrapolated to new regions of chemical space, e.g., new bonding types, new many-body interactions. Another important limitation is the spatial locality assumption in model architecture, and this limitation cannot be overcome with larger or more diverse datasets. The outlined challenges are primarily associated with the lack of electronic structure information in surrogate models such as interatomic potentials. Given the fast development of machine learning and computational chemistry methods, we expect some limitations of surrogate models to be addressed in the near future; nevertheless spatial locality assumption will likely remain a limiting factor for their transferability. Here, we suggest focusing on an equally important effort-design of physics-informed models that leverage the domain knowledge and employ machine learning only as a corrective tool. In the context of material science, we will focus on semi-empirical quantum mechanics, using machine learning to predict corrections to the reduced-order Hamiltonian model parameters. The resulting models are broadly applicable, retain the speed of semiempirical chemistry, and frequently achieve accuracy on par with much more expensive ab initio calculations. These early results indicate that future work, in which machine learning and quantum chemistry methods are developed jointly, may provide the best of all worlds for chemistry applications that demand both high accuracy and high numerical efficiency. read less NOT USED (low confidence) W. C. Witt et al., “ACEpotentials.jl: A Julia implementation of the atomic cluster expansion.,” The Journal of chemical physics. 2023. link Times cited: 2 Abstract: We introduce ACEpotentials.jl, a Julia-language software pac… read moreAbstract: We introduce ACEpotentials.jl, a Julia-language software package that constructs interatomic potentials from quantum mechanical reference data using the Atomic Cluster Expansion [R. Drautz, Phys. Rev. B 99, 014104 (2019)]. As the latter provides a complete description of atomic environments, including invariance to overall translation and rotation as well as permutation of like atoms, the resulting potentials are systematically improvable and data efficient. Furthermore, the descriptor's expressiveness enables use of a linear model, facilitating rapid evaluation and straightforward application of Bayesian techniques for active learning. We summarize the capabilities of ACEpotentials.jl and demonstrate its strengths (simplicity, interpretability, robustness, performance) on a selection of prototypical atomistic modelling workflows. read less NOT USED (low confidence) Á. D. Carral, X. Xu, S. Gravelle, A. YazdanYar, S. Schmauder, and M. Fyta, “Stability of Binary Precipitates in Cu-Ni-Si-Cr Alloys Investigated Through Active Learning,” SSRN Electronic Journal. 2023. link Times cited: 0 NOT USED (low confidence) A. Kartamyshev, A. Lipnitskii, V. Maksimenko, A. V. Vyazmin, I. Nelasov, and D. Poletaev, “N-body potential for simulating lattice defects and diffusion in copper,” Computational Materials Science. 2023. link Times cited: 1 NOT USED (low confidence) Z. Yang, X. Li, and W. A. N. G. GAO, “Quantitative prediction of surface energy of high-entropy-alloys based on intrinsic descriptors,” Surfaces and Interfaces. 2023. link Times cited: 0 NOT USED (low confidence) A. A. Mamun, S. Xu, X.-G. Li, and Y. Su, “Comparing interatomic potentials in calculating basic structural parameters and Peierls stress in tungsten-based random binary alloys,” Physica Scripta. 2023. link Times cited: 0 Abstract: The field of machine learning-based interatomic potentials (… read moreAbstract: The field of machine learning-based interatomic potentials (ML-IAPs) has seen increasing development in recent years. In this work, we compare three widely used ML-IAPs–the moment tensor potential (MTP), the spectral neighbor analysis potential (SNAP), and the tabulated Gaussian approximation potential (tabGAP)with a conventional non-ML-IAP, the embedded atom method (EAM) potential. We evaluated these potentials on the basis of their accuracy and efficiency in determining basic structural parameters and Peierls stress under equivalent conditions. Three tungsten (W)-based alloys (Mo-W, Nb-W, and Ta-W) are considered, and their lattice parameter, formation energy, elastic tensor, and Peierls stress of edge dislocation are calculated. Compared with DFT results, MTP demonstrates the highest accuracy in predicting the lattice parameter and the best computational efficiency among the three ML-IAPs, while tabGAP accurately predicts two independent elastic constants, C 11 and C 12. Despite being the slowest, SNAP shows the highest accuracy in predicting the third independent elastic constant C 44 and its Peierls stress value is comparable to that based on MTP. read less NOT USED (low confidence) Y. Lee, J. Timmermann, C. Panosetti, C. Scheurer, and K. Reuter, “Staged Training of Machine-Learning Potentials from Small to Large Surface Unit Cells: Efficient Global Structure Determination of the RuO2(100)-c(2 × 2) Reconstruction and (410) Vicinal,” The Journal of Physical Chemistry C. 2023. link Times cited: 1 NOT USED (low confidence) B. Aroboto, S. Chen, T. Hsu, B. C. Wood, Y. Jiao, and J. Chapman, “Universal and interpretable classification of atomistic structural transitions via unsupervised graph learning,” Applied Physics Letters. 2023. link Times cited: 0 Abstract: Materials processing often occurs under extreme dynamic cond… read moreAbstract: Materials processing often occurs under extreme dynamic conditions leading to a multitude of unique structural environments. These structural environments generally occur at high temperatures and/or high pressures, often under non-equilibrium conditions, which results in drastic changes in the material's structure over time. Computational techniques, such as molecular dynamics simulations, can probe the atomic regime under these extreme conditions. However, characterizing the resulting diverse atomistic structures as a material undergoes extreme changes in its structure has proved challenging due to the inherently non-linear relationship between structures as large-scale changes occur. Here, we introduce SODAS++, a universal graph neural network framework, that can accurately and intuitively quantify the atomistic structural evolution corresponding to the transition between any two arbitrary phases. We showcase SODAS++ for both solid–solid and solid–liquid transitions for systems of increasing geometric and chemical complexity, such as colloidal systems, elemental Al, rutile and amorphous TiO2, and the non-stoichiometric ternary alloy Ag26Au5Cu19. We show that SODAS++ can accurately quantify all transitions in a physically interpretable manner, showcasing the power of unsupervised graph neural network encodings for capturing the complex and non-linear pathway, a material's structure takes as it evolves. read less NOT USED (low confidence) R. Lindsey, S. Bastea, Y. Lyu, S. Hamel, N. Goldman, and L. Fried, “Chemical evolution in nitrogen shocked beyond the molecular stability limit.,” The Journal of chemical physics. 2023. link Times cited: 0 Abstract: Evolution of nitrogen under shock compression up to 100 GPa … read moreAbstract: Evolution of nitrogen under shock compression up to 100 GPa is revisited via molecular dynamics simulations using a machine-learned interatomic potential. The model is shown to be capable of recovering the structure, dynamics, speciation, and kinetics in hot compressed liquid nitrogen predicted by first-principles molecular dynamics, as well as the measured principal shock Hugoniot and double shock experimental data, albeit without shock cooling. Our results indicate that a purely molecular dissociation description of nitrogen chemistry under shock compression provides an incomplete picture and that short oligomers form in non-negligible quantities. This suggests that classical models representing the shock dissociation of nitrogen as a transition to an atomic fluid need to be revised to include reversible polymerization effects. read less NOT USED (low confidence) S. Röcken and J. Zavadlav, “Accurate machine learning force fields via experimental and simulation data fusion,” ArXiv. 2023. link Times cited: 0 Abstract: Machine Learning (ML)-based force fields are attracting ever… read moreAbstract: Machine Learning (ML)-based force fields are attracting ever-increasing interest due to their capacity to span spatiotemporal scales of classical interatomic potentials at quantum-level accuracy. They can be trained based on high-fidelity simulations or experiments, the former being the common case. However, both approaches are impaired by scarce and erroneous data resulting in models that either do not agree with well-known experimental observations or are under-constrained and only reproduce some properties. Here we leverage both Density Functional Theory (DFT) calculations and experimentally measured mechanical properties and lattice parameters to train an ML potential of titanium. We demonstrate that the fused data learning strategy can concurrently satisfy all target objectives, thus resulting in a molecular model of higher accuracy compared to the models trained with a single data source. The inaccuracies of DFT functionals at target experimental properties were corrected, while the investigated off-target properties remained largely unperturbed. Our approach is applicable to any material and can serve as a general strategy to obtain highly accurate ML potentials. read less NOT USED (low confidence) M. Ma’zdziarz, “Transferability of interatomic potentials for germanene (2D germanium),” Journal of Applied Physics. 2023. link Times cited: 0 Abstract: The capacities of various interatomic potentials available f… read moreAbstract: The capacities of various interatomic potentials available for elemental germanium, with the scope to choose the potential suitable for the modeling of germanene (2D germanium) allotropes,f were investigated. Structural and mechanical properties of the flat, low-buckled, trigonal dumbbell, and large honeycomb dumbbell single-layer germanium (germanene) phases, were obtained using the density functional theory and molecular statics computations with Tersoff, modified embedded atom method, Stillinger–Weber, environment-dependent interatomic potential, ReaxFF, and machine-learning-based interatomic potentials. A systematic quantitative comparative study and discussion of the findings are given. read less NOT USED (low confidence) N. A. Akil, “Length dependent thermal conductivity of silicon and copper nanowire: a molecular dynamics study,” Molecular Crystals and Liquid Crystals. 2023. link Times cited: 0 NOT USED (low confidence) L. Li et al., “Atom-centered machine-learning force field package,” Comput. Phys. Commun. 2023. link Times cited: 0 NOT USED (low confidence) C. Guan et al., “Unlocking the Chemical Space in Anti-perovskite Conductors by Incorporating Anion Rotation Dynamics,” Energy Storage Materials. 2023. link Times cited: 1 NOT USED (low confidence) A. Duff, R. Sakidja, H. C. Walker, R. Ewings, and D. Voneshen, “Automated potential development workflow: Application to BaZrO3,” Comput. Phys. Commun. 2023. link Times cited: 0 NOT USED (low confidence) P. Ouyang et al., “Atomic Local Ordering and Alloying Effects on the Mg3(Sb1-xBix)2 Thermoelectric Material.,” ACS applied materials & interfaces. 2023. link Times cited: 1 Abstract: Mg3(Sb1-xBix)2 alloy has been extensively studied in the las… read moreAbstract: Mg3(Sb1-xBix)2 alloy has been extensively studied in the last 5 years due to its exceptional thermoelectric (TE) performance. The absence of accurate force field for inorganic alloy compounds presents great challenges for computational studies. Here, we explore the atomic microstructure, thermal, and elastic properties of the Mg3(Sb1-xBix)2 alloy at different solution concentrations through atomic simulations with a highly accurate machine learning interatomic potential (ML-IAP). We find atomic local ordering in the optimized structure with the Bi-Bi pair inclined to join adjacent layers and Sb-Sb pair preferring to stay within the same layer. The thermal conductivity changes with the solution concentrations can be correctly predicted through ML-IAP-based molecular dynamics simulations. Spectral thermal conductance analysis shows that the continuous movement of low-frequency peak to high frequency is responsible for the reduction of the thermal conductivity upon alloying. Elastic calculations reveal that similar to the thermal conductivity, solid solution alloying can reduce the overall elastic properties at both Mg3Sb2 and Mg3Bi2 ends, while anisotropic behavior is clearly observed with linear interpolation relationship upon alloying along the interlayer direction and nonlinearity along the intralayer direction. Although the atomic local ordering shows little effects on the properties of the Mg3(Sb1-xBix)2 alloy with only two alloying elements, it possesses potential important impacts on multiprincipal element inorganic TE alloys. This work provides a recipe for computational studies on the TE alloy systems and thus can accelerate the discovery and optimization of TE materials with high TE performance. read less NOT USED (low confidence) T. K. Stenczel et al., “Machine-learned acceleration for molecular dynamics in CASTEP.,” The Journal of chemical physics. 2023. link Times cited: 2 Abstract: Machine learning (ML) methods are of rapidly growing interes… read moreAbstract: Machine learning (ML) methods are of rapidly growing interest for materials modeling, and yet, the use of ML interatomic potentials for new systems is often more demanding than that of established density-functional theory (DFT) packages. Here, we describe computational methodology to combine the CASTEP first-principles simulation software with the on-the-fly fitting and evaluation of ML interatomic potential models. Our approach is based on regular checking against DFT reference data, which provides a direct measure of the accuracy of the evolving ML model. We discuss the general framework and the specific solutions implemented, and we present an example application to high-temperature molecular-dynamics simulations of carbon nanostructures. The code is freely available for academic research. read less NOT USED (low confidence) G. Krenzer et al., “Nature of the Superionic Phase Transition of Lithium Nitride from Machine Learning Force Fields,” Chemistry of Materials. 2023. link Times cited: 2 NOT USED (low confidence) D. F. T. du Toit and V. L. Deringer, “Cross-platform hyperparameter optimization for machine learning interatomic potentials.,” The Journal of chemical physics. 2023. link Times cited: 0 Abstract: Machine-learning (ML)-based interatomic potentials are incre… read moreAbstract: Machine-learning (ML)-based interatomic potentials are increasingly popular in material modeling, enabling highly accurate simulations with thousands and millions of atoms. However, the performance of machine-learned potentials depends strongly on the choice of hyperparameters-that is, of those parameters that are set before the model encounters data. This problem is particularly acute where hyperparameters have no intuitive physical interpretation and where the corresponding optimization space is large. Here, we describe an openly available Python package that facilitates hyperparameter optimization across different ML potential fitting frameworks. We discuss methodological aspects relating to the optimization itself and to the selection of validation data, and we show example applications. We expect this package to become part of a wider computational framework to speed up the mainstream adaptation of ML potentials in the physical sciences. read less NOT USED (low confidence) S. Lyu, W. Li, Y. Xia, Y. Chen, and A. Ngan, “Effects of chemical randomness on strength contributors and dislocation behaviors in a bcc multiprincipal element alloy,” Physical Review Materials. 2023. link Times cited: 0 NOT USED (low confidence) Q. Mao, M. Feng, X. Jiang, Y. Ren, K. Luo, and A. V. van Duin, “Classical and reactive molecular dynamics: Principles and applications in combustion and energy systems,” Progress in Energy and Combustion Science. 2023. link Times cited: 10 NOT USED (low confidence) F. Khorobrykh et al., “Cluster structure of ultrahard fullerite revealed by Raman spectroscopy,” Carbon. 2023. link Times cited: 0 NOT USED (low confidence) W. Chen, L. Li, Q. Zhu, and H. Zhuang, “Chemical short-range order in complex concentrated alloys,” MRS Bulletin. 2023. link Times cited: 1 Abstract: Complex concentrated alloys (CCAs) have drawn immense attent… read moreAbstract: Complex concentrated alloys (CCAs) have drawn immense attention from the materials research community and beyond. Because the vast compositional and structural degrees of freedom in CCAs can lead to novel properties (e.g., structural and functional) with a wide range of applications, the structure–property relationships of CCAs are of critical interest. One salient feature in the atomic structures of CCAs is the presence of chemical short-range ordering (CSRO). Understanding the roles of CSRO on properties, especially phase stability, requires joint efforts from experimental and computational approaches. In this article, we first briefly survey the most recent experimental efforts in identifying and characterizing CSRO of various CCAs. We then focus on the theoretical and computational techniques that have been deployed to investigate the CSRO effects. These computational methods include density functional theory (DFT), molecular dynamics (MD), and statistical mechanics methods such as cluster expansions and machine learning methods such as creating transferable interatomic potentials. Finally, we outline the challenges and future directions of CSRO research in CCAs. read less NOT USED (low confidence) J. Broad, R. Wheatley, and R. S. Graham, “Parallel Implementation of Nonadditive Gaussian Process Potentials for Monte Carlo Simulations,” Journal of Chemical Theory and Computation. 2023. link Times cited: 0 Abstract: A strategy is presented to implement Gaussian process potent… read moreAbstract: A strategy is presented to implement Gaussian process potentials in molecular simulations through parallel programming. Attention is focused on the three-body nonadditive energy, though all algorithms extend straightforwardly to the additive energy. The method to distribute pairs and triplets between processes is general to all potentials. Results are presented for a simulation box of argon, including full box and atom displacement calculations, which are relevant to Monte Carlo simulation. Data on speed-up are presented for up to 120 processes across four nodes. A 4-fold speed-up is observed over five processes, extending to 20-fold over 40 processes and 30-fold over 120 processes. read less NOT USED (low confidence) G. Ramanath et al., “Engineering inorganic interfaces using molecular nanolayers,” Applied Physics Letters. 2023. link Times cited: 0 Abstract: Advances in interface science over the last 20 years have de… read moreAbstract: Advances in interface science over the last 20 years have demonstrated the use of molecular nanolayers (MNLs) at inorganic interfaces to access emergent phenomena and enhance a variety of interfacial properties. Here, we capture important aspects of how a MNL can induce multifold enhancements and tune multiple interfacial properties, including chemical stability, fracture energy, thermal and electrical transport, and electronic structure. Key challenges that need to be addressed for the maturation of this emerging field are described and discussed. MNL-induced interfacial engineering has opened up attractive opportunities for designing organic–inorganic hybrid nanomaterials with high interface fractions, where properties are determined predominantly by MNL-induced interfacial effects for applications. read less NOT USED (low confidence) A. Sharma, S. Sharma, and S. Ajori, “Molecular dynamics simulation of the mechanical and thermal properties of phagraphene nanosheets and nanotubes: a review,” Journal of Materials Science. 2023. link Times cited: 0 NOT USED (low confidence) J. A. Vita et al., “ColabFit exchange: Open-access datasets for data-driven interatomic potentials.,” The Journal of chemical physics. 2023. link Times cited: 2 Abstract: Data-driven interatomic potentials (IPs) trained on large co… read moreAbstract: Data-driven interatomic potentials (IPs) trained on large collections of first principles calculations are rapidly becoming essential tools in the fields of computational materials science and chemistry for performing atomic-scale simulations. Despite this, apart from a few notable exceptions, there is a distinct lack of well-organized, public datasets in common formats available for use with IP development. This deficiency precludes the research community from implementing widespread benchmarking, which is essential for gaining insight into model performance and transferability, and also limits the development of more general, or even universal, IPs. To address this issue, we introduce the ColabFit Exchange, the first database providing open access to a large collection of systematically organized datasets from multiple domains that is especially designed for IP development. The ColabFit Exchange is publicly available at https://colabfit.org, providing a web-based interface for exploring, downloading, and contributing datasets. Composed of data collected from the literature or provided by community researchers, the ColabFit Exchange currently (September 2023) consists of 139 datasets spanning nearly 70 000 unique chemistries, and is intended to continuously grow. In addition to outlining the software framework used for constructing and accessing the ColabFit Exchange, we also provide analyses of the data, quantifying the diversity of the database and proposing metrics for assessing the relative diversity of multiple datasets. Finally, we demonstrate an end-to-end IP development pipeline, utilizing datasets from the ColabFit Exchange, fitting tools from the KLIFF software package, and validation tests provided by the OpenKIM framework. read less NOT USED (low confidence) L. Fiedler, N. Modine, K. D. Miller, and A. Cangi, “Machine learning the electronic structure of matter across temperatures,” Physical Review B. 2023. link Times cited: 0 Abstract: We introduce machine learning (ML) models that predict the e… read moreAbstract: We introduce machine learning (ML) models that predict the electronic structure of materials across a wide temperature range. Our models employ neural networks and are trained on density functional theory (DFT) data. Unlike most other ML models that use DFT data, our models directly predict the local density of states (LDOS) of the electronic structure. This provides several advantages, including access to multiple observables such as the electronic density and electronic total free energy. Moreover, our models account for both the electronic and ionic temperatures independently, making them ideal for applications like laser-heating of matter. We validate the efficacy of our LDOS-based models on a metallic test system. They accurately capture energetic effects induced by variations in ionic and electronic temperatures over a broad temperature range, even when trained on a subset of these temperatures. These findings open up exciting opportunities for investigating the electronic structure of materials under both ambient and extreme conditions. read less NOT USED (low confidence) V. Sotskov, E. Podryabinkin, and A. Shapeev, “A machine-learning potential-based generative algorithm for on-lattice crystal structure prediction,” Journal of Materials Research. 2023. link Times cited: 1 Abstract: We propose a method for crystal structure prediction based o… read moreAbstract: We propose a method for crystal structure prediction based on a new structure generation algorithm and on-lattice machine learning interatomic potentials. Our algorithm generates the atomic configurations assigning atomic species to sites of the given lattice, and uses cluster expansion or low-rank potential to evaluate their energy. We demonstrate two benefits of such approach. First, our structure generation algorithm offers a ``smart'' configurational space sampling, targeting low-energy structures which significantly reduces computational costs. Second, the application of machine learning interatomic potentials significantly reduces the number of DFT calculations. We discuss how our algorithm resembles the latent diffusion models for image generation. We demonstrate the efficiency of our method by constructing the convex hull of Nb-Mo-Ta-W system, including binary and ternary Nb-W and Mo-Ta-W subsystems. We found new binary, ternary, and quaternary stable structures that are not reported in the AFLOW database which we choose as our baseline. Due to the computational efficiency of our method we anticipate that it can pave the way towards efficient high-throughput discovery of multicomponent materials. read less NOT USED (low confidence) S. M. Nur, E. L. Valencia, and S. Amaroh, “Analysis of Economic Potential in Stock Zakat in the Indonesian Financial Sector,” Journal International Dakwah and Communication. 2023. link Times cited: 1 Abstract: The aim of this study is to examine the economic potential o… read moreAbstract: The aim of this study is to examine the economic potential of zakat shares within Indonesia's expanding financial sector, as it has the capacity to enhance the well-being of individuals and promote economic growth. This type of zakat is analyzed through analytical and descriptive methods, utilizing secondary data from financial reports and related institutions. Despite low levels of community participation, this research indicates that the potential for zakat shares within Indonesia's financial sector is substantial. Through data analysis, it is evident that zakat shares can contribute to the enhancement of the financial sector by increasing liquidity and investor confidence, as well as promoting more inclusive economic growth and equitable distribution of wealth. Consequently, to provide significant economic benefits for the financial sector as a whole, it is necessary to augment public participation in zakat shares and improve zakat infrastructure. read less NOT USED (low confidence) Y. Luo, J. A. Meziere, G. Samolyuk, G. Hart, M. Daymond, and L. K. B’eland, “A Set of Moment Tensor Potentials for Zirconium with Increasing Complexity.,” Journal of chemical theory and computation. 2023. link Times cited: 0 Abstract: Machine learning force fields (MLFFs) are an increasingly po… read moreAbstract: Machine learning force fields (MLFFs) are an increasingly popular choice for atomistic simulations due to their high fidelity and improvable nature. Here we propose a hybrid small-cell approach that combines attributes of both offline and active learning to systematically expand a quantum-mechanical (QM) database while constructing MLFFs with increasing model complexity. Our MLFFs employ the moment tensor potential formalism. During this process, we quantitatively assessed the structural properties, elastic properties, dimer potential energies, melting temperatures, phase stability, point defect formation energies, point defect migration energies, free surface energies, and generalized stacking fault (GSF) energies of Zr as predicted by our MLFFs. Unsurprisingly, the model complexity has a positive correlation with prediction accuracy. We also find that the MLFFs were able to predict the properties of out-of-sample configurations without directly including these specific configurations in the training dataset. Additionally, we generated 100 MLFFs of high complexity (1513 parameters each) that reached different local optima during training. Their predictions cluster around the benchmark DFT values, but subtle physical features such as the location of local minima on the GSF energy surface are washed out by statistical noise. read less NOT USED (low confidence) M. J. Deck and Y.-Y. Hu, “Leveraging local structural disorder for enhanced ion transport,” Journal of Materials Research. 2023. link Times cited: 2 Abstract: Fast-ion conductors, also known as solid electrolytes, are a… read moreAbstract: Fast-ion conductors, also known as solid electrolytes, are a critical component to the development of high-performance all-solid-state batteries. Conventional lithium solid electrolytes are limited by low ionic conductivity due to high energy barriers for Li^+ transport. Recent advancements in promoting fast-ion transport have been achieved through weakening the interaction of Li-ions with their coordinated anions via the introduction of local disorder on the atomic-, nano-, and meso-scale. Difficulty in the coherent characterization of local-entropy-enhanced ion conductors arises from the modified structural framework, which consists of highly disordered local structures within an ordered long-range network. This review outlines an experimental approach to systematically probe the relation between material structure, ion dynamics, and ion conduction, guided by solid-state NMR. Examples of our work on local-entropy-enhanced ion conductors are highlighted to encourage future studies to further optimize the properties of solid electrolytes for a wide range of technological applications. Graphical abstract read less NOT USED (low confidence) J. Wang et al., “MAGUS: machine learning and graph theory assisted universal structure searcher,” National Science Review. 2023. link Times cited: 6 Abstract: ABSTRACT Crystal structure predictions based on first-princi… read moreAbstract: ABSTRACT Crystal structure predictions based on first-principles calculations have gained great success in materials science and solid state physics. However, the remaining challenges still limit their applications in systems with a large number of atoms, especially the complexity of conformational space and the cost of local optimizations for big systems. Here, we introduce a crystal structure prediction method, MAGUS, based on the evolutionary algorithm, which addresses the above challenges with machine learning and graph theory. Techniques used in the program are summarized in detail and benchmark tests are provided. With intensive tests, we demonstrate that on-the-fly machine-learning potentials can be used to significantly reduce the number of expensive first-principles calculations, and the crystal decomposition based on graph theory can efficiently decrease the required configurations in order to find the target structures. We also summarized the representative applications of this method on several research topics, including unexpected compounds in the interior of planets and their exotic states at high pressure and high temperature (superionic, plastic, partially diffusive state, etc.); new functional materials (superhard, high-energy-density, superconducting, photoelectric materials), etc. These successful applications demonstrated that MAGUS code can help to accelerate the discovery of interesting materials and phenomena, as well as the significant value of crystal structure predictions in general. read less NOT USED (low confidence) P.-Y. Yang, Y.-H. Chiang, C. Pao, and C.-C. Chang, “Hybrid Machine Learning-Enabled Potential Energy Model for Atomistic Simulation of Lithium Intercalation into Graphite from Plating to Overlithiation.,” Journal of chemical theory and computation. 2023. link Times cited: 0 Abstract: Graphite is one of the most widely used negative electrode m… read moreAbstract: Graphite is one of the most widely used negative electrode materials for lithium ion batteries (LIBs). However, because of the rapid growth of demands pursuing higher energy density and charging rates, comprehensive insights into the lithium intercalation and plating processes are critical for further boosting the potential of graphite electrodes. Herein, by utilizing the dihedral-angle-corrected registry-dependent potential (DRIP) (Wen et al., Phys. Rev. B 2018, 98, 235404), the Ziegler-Biersack-Littmark (ZBL) potential (Ziegler and Biersack, Astrophysics, Chemistry, and Condensed Matter; 1985, pp 93-129), and the machine learning-based spectral neighbor analysis (SNAP) potential (Thompson et al., J. Comput, Phys. 2015, 285, 316-330), we have successfully trained a hybrid machine learning-enabled potential energy model capable of simulating a wide spectrum of lithium intercalation scenario from plating to overlithiation. Our extensive atomistic simulations reveal the trapping of intercalated lithium atoms close to the graphite edges due to high hopping barriers, resulting in lithium plating. Furthermore, we report a stable dense graphite intercalation compound (GIC) LiC4 with a theoretical capacity of 558 mAh/g, wherein lithium atoms occupy alternating upper/lower graphene hollow sites with a nearest Li-Li distance of 2.8 Å. Surprisingly, following the same lithium insertion manner would allow the nearest Li-Li distance to be retained until the capacity reaches 845.2 mAh/g, corresponding to a GIC of LiC2.6. Hence, the present study demonstrates that the hybrid machine learning approach could further extend the scope of machine learning energy models, allowing us to investigate the lithium intercalation into graphite over a wide range of intercalation capacity to unveil the underlying mechanisms of lithium plating, diffusion, and discovery of new dense GICs for advanced LIBs with high charging rates and high energy densities. read less NOT USED (low confidence) A. Maltsev, I. Chepkasov, A. Kvashnin, and A. Oganov, “Ionic Conductivity of Lithium Phosphides,” Crystals. 2023. link Times cited: 1 Abstract: We comprehensively study the ionic conductivity in lithium p… read moreAbstract: We comprehensively study the ionic conductivity in lithium phosphides, promising materials for energy storage applications, by using a combination of first-principles computations and machine learning interatomic potentials. Using the quasiharminic approximation, we calculated convex hulls of the Li-P system at various temperatures and the temperature-composition phase diagram was obtained, delineating the stability regions of each phase. The ionic conductivity of stable (Li3P, LiP, Li3P7, Li3P11, LiP7) and metastable (Li4P3, Li5P4, LiP5) compounds was studied as a function of temperature. In some compounds we found have high ionic conductivity at room temperatures (10−3–10−2 S cm−1). Structures with the lowest ionic conductivity are LiP, Li3P11, and LiP7, in which diffusion is negligible in the whole temperature range 300–500 K. In Li3P, Li3P7, and Li4P3, LiP, there is the 3D diffusion of Li atoms, while in Li5P4 the 2D mechanism prevails, and in LiP5 and LiP7 the 1D mechanism was observed. This study may provide insights for the development of Li-P materials in lithium ion and lithium metal battery applications. read less NOT USED (low confidence) Y. Xie, M. Bu, Y. Zhang, and G. Lu, “Effect of composition and temperature on microstructure and thermophysical properties of LiCl-CaCl2 molten salt based on machine learning potentials,” Journal of Molecular Liquids. 2023. link Times cited: 2 NOT USED (low confidence) R. Zhao et al., “Development of a Neuroevolution Machine Learning Potential of Pd-Cu-Ni-P Alloys,” SSRN Electronic Journal. 2023. link Times cited: 2 NOT USED (low confidence) B. Hamilton and T. Germann, “Using limited neural networks to assess relative mechanistic influence on shock heating in granular solids,” Physical Review Materials. 2023. link Times cited: 0 Abstract: The rapid compaction of granular media results in localized … read moreAbstract: The rapid compaction of granular media results in localized heating that can induce chemical reactions, phase transformations, and melting. However, there are numerous mechanisms in play that can be dependent on a variety of microstructural features. Machine learning techniques such as neural networks offer a ubiquitous method to develop models for physical processes. Limiting what kinds of microstructural information is used as input and assessing normalized changes in network error, the relative importance of different mechanisms can be inferred. Here we utilize binned, initial density information as network inputs to predict local shock heating in a granular high explosive trained from large scale, molecular dynamics simulations. The spatial extend of the density field used in the network is altered to assess the importance and relevant length scales of the physical mechanisms in play, where different microstructural features result in different predictive capability. read less NOT USED (low confidence) M. Phuthi et al., “Accurate Surface and Finite Temperature Bulk Properties of Lithium Metal at Large Scales using Machine Learning Interaction Potentials,” ArXiv. 2023. link Times cited: 2 Abstract: The properties of lithium metal are key parameters in the de… read moreAbstract: The properties of lithium metal are key parameters in the design of lithium ion and lithium metal batteries. They are difficult to probe experimentally due to the high reactivity and low melting point of lithium as well as the microscopic scales at which lithium exists in batteries where it is found to have enhanced strength, with implications for dendrite suppression strategies. Computationally, there is a lack of empirical potentials that are consistently quantitatively accurate across all properties and ab-initio calculations are too costly. In this work, we train Machine Learning Interaction Potentials (MLIPs) on Density Functional Theory (DFT) data to state-of-the-art accuracy in reproducing experimental and ab-initio results across a wide range of simulations at large length and time scales. We accurately predict thermodynamic properties, phonon spectra, temperature dependence of elastic constants and various surface properties inaccessible using DFT. We establish that there exists a Bell-Evans-Polanyi relation correlating the self-adsorption energy and the minimum surface diffusion barrier for high Miller index facets. read less NOT USED (low confidence) J. Tang, G. Li, Q. Wang, J. Zheng, L. Cheng, and R. Guo, “Competition between phonon-vacancy and four-phonon scattering in cubic boron arsenide by machine learning interatomic potential,” Physical Review Materials. 2023. link Times cited: 1 NOT USED (low confidence) B. Mortazavi, X. Zhuang, T. Rabczuk, and A. Shapeev, “Atomistic modeling of the mechanical properties: the rise of machine learning interatomic potentials.,” Materials horizons. 2023. link Times cited: 9 Abstract: Since the birth of the concept of machine learning interatom… read moreAbstract: Since the birth of the concept of machine learning interatomic potentials (MLIPs) in 2007, a growing interest has been developed in the replacement of empirical interatomic potentials (EIPs) with MLIPs, in order to conduct more accurate and reliable molecular dynamics calculations. As an exciting novel progress, in the last couple of years the applications of MLIPs have been extended towards the analysis of mechanical and failure responses, providing novel opportunities not heretofore efficiently achievable, neither by EIPs nor by density functional theory (DFT) calculations. In this minireview, we first briefly discuss the basic concepts of MLIPs and outline popular strategies for developing a MLIP. Next, by considering several examples of recent studies, the robustness of MLIPs in the analysis of the mechanical properties will be highlighted, and their advantages over EIP and DFT methods will be emphasized. MLIPs furthermore offer astonishing capabilities to combine the robustness of the DFT method with continuum mechanics, enabling the first-principles multiscale modeling of mechanical properties of nanostructures at the continuum level. Last but not least, the common challenges of MLIP-based molecular dynamics simulations of mechanical properties are outlined and suggestions for future investigations are proposed. read less NOT USED (low confidence) M. S. Nitol, K. Dang, S. Fensin, M. Baskes, D. Dickel, and C. Barrett, “Hybrid interatomic potential for Sn,” Physical Review Materials. 2023. link Times cited: 2 NOT USED (low confidence) H. Yin, “Improved Singum Model Based on Finite Deformation of Crystals with the Thermodynamic Equation of State,” Journal of Engineering Mechanics. 2023. link Times cited: 1 NOT USED (low confidence) X. Tang, Z.-H. Luo, and Y. Cui, “Band Gaps and Optical Properties of RENiO3 upon Strain: Combining First-Principles Calculations and Machine Learning,” Materials. 2023. link Times cited: 0 Abstract: Rare earth nickel-based perovskite oxides (RENiO3) have been… read moreAbstract: Rare earth nickel-based perovskite oxides (RENiO3) have been widely studied over recent decades because of their unique properties. In the synthesis of RENiO3 thin films, a lattice mismatch frequently exists between the substrates and the thin films, which may affect the optical properties of RENiO3. In this paper, the first-principles calculations were employed to study the electronic and optical properties of RENiO3 under strain. The results showed that with the increase in tensile strength, the band gap generally shows a widening trend. For optical properties, the absorption coefficients increase with the enhancement of photon energies in the far-infrared range. The compressive strain increases the light absorption, while the tensile strain suppresses it. For the reflectivity spectrum in the far-infrared range, a minimum reflectivity displays around the photon energy of 0.3 eV. The tensile strain enhances the reflectivity in the range of 0.05–0.3 eV, whereas it decreases it when the photon energies are larger than 0.3 eV. Furthermore, machine learning algorithms were applied and found that the planar epitaxial strain, electronegativity, volume of supercells, and rare earth element ion radius play key roles in the band gaps. Photon energy, electronegativity, band gap, the ionic radius of the rare earth element, and the tolerance factor are key parameters significantly influencing the optical properties. read less NOT USED (low confidence) C. Li, J. C. Verduzco, B. H. Lee, R. J. Appleton, and A. Strachan, “Mapping microstructure to shock-induced temperature fields using deep learning,” npj Computational Materials. 2023. link Times cited: 0 NOT USED (low confidence) S. Bougueroua, M. Bricage, Y. Aboulfath, D. Barth, and M. Gaigeot, “Algorithmic Graph Theory, Reinforcement Learning and Game Theory in MD Simulations: From 3D Structures to Topological 2D-Molecular Graphs (2D-MolGraphs) and Vice Versa,” Molecules. 2023. link Times cited: 1 Abstract: This paper reviews graph-theory-based methods that were rece… read moreAbstract: This paper reviews graph-theory-based methods that were recently developed in our group for post-processing molecular dynamics trajectories. We show that the use of algorithmic graph theory not only provides a direct and fast methodology to identify conformers sampled over time but also allows to follow the interconversions between the conformers through graphs of transitions in time. Examples of gas phase molecules and inhomogeneous aqueous solid interfaces are presented to demonstrate the power of topological 2D graphs and their versatility for post-processing molecular dynamics trajectories. An even more complex challenge is to predict 3D structures from topological 2D graphs. Our first attempts to tackle such a challenge are presented with the development of game theory and reinforcement learning methods for predicting the 3D structure of a gas-phase peptide. read less NOT USED (low confidence) M. Eckhoff and M. Reiher, “Lifelong Machine Learning Potentials,” Journal of Chemical Theory and Computation. 2023. link Times cited: 1 Abstract: Machine learning potentials (MLPs) trained on accurate quant… read moreAbstract: Machine learning potentials (MLPs) trained on accurate quantum chemical data can retain the high accuracy, while inflicting little computational demands. On the downside, they need to be trained for each individual system. In recent years, a vast number of MLPs have been trained from scratch because learning additional data typically requires retraining on all data to not forget previously acquired knowledge. Additionally, most common structural descriptors of MLPs cannot represent efficiently a large number of different chemical elements. In this work, we tackle these problems by introducing element-embracing atom-centered symmetry functions (eeACSFs), which combine structural properties and element information from the periodic table. These eeACSFs are key for our development of a lifelong machine learning potential (lMLP). Uncertainty quantification can be exploited to transgress a fixed, pretrained MLP to arrive at a continuously adapting lMLP, because a predefined level of accuracy can be ensured. To extend the applicability of an lMLP to new systems, we apply continual learning strategies to enable autonomous and on-the-fly training on a continuous stream of new data. For the training of deep neural networks, we propose the continual resilient (CoRe) optimizer and incremental learning strategies relying on rehearsal of data, regularization of parameters, and the architecture of the model. read less NOT USED (low confidence) M. Maździarz, “Transferability of interatomic potentials for silicene,” Beilstein Journal of Nanotechnology. 2023. link Times cited: 1 Abstract: The ability of various interatomic potentials to reproduce t… read moreAbstract: The ability of various interatomic potentials to reproduce the properties of silicene, that is, 2D single-layer silicon, polymorphs was examined. Structural and mechanical properties of flat, low-buckled, trigonal dumbbell, honeycomb dumbbell, and large honeycomb dumbbell silicene phases, were obtained using density functional theory and molecular statics calculations with Tersoff, MEAM, Stillinger–Weber, EDIP, ReaxFF, COMB, and machine-learning-based interatomic potentials. A quantitative systematic comparison and a discussion of the results obtained are reported. read less NOT USED (low confidence) N. Kondratyuk, R. Ryltsev, V. Ankudinov, and N. Chtchelkatchev, “First-principles calculations of the viscosity in multicomponent metallic melts: Al-Cu-Ni as a test case,” Journal of Molecular Liquids. 2023. link Times cited: 4 NOT USED (low confidence) K. Zinovjev, “Electrostatic Embedding of Machine Learning Potentials,” Journal of Chemical Theory and Computation. 2023. link Times cited: 4 Abstract: This work presents a variant of an electrostatic embedding s… read moreAbstract: This work presents a variant of an electrostatic embedding scheme that allows the embedding of arbitrary machine learned potentials trained on molecular systems in vacuo. The scheme is based on physically motivated models of electronic density and polarizability, resulting in a generic model without relying on an exhaustive training set. The scheme only requires in vacuo single point QM calculations to provide training densities and molecular dipolar polarizabilities. As an example, the scheme is applied to create an embedding model for the QM7 data set using Gaussian Process Regression with only 445 reference atomic environments. The model was tested on the SARS-CoV-2 protease complex with PF-00835231, resulting in a predicted embedding energy RMSE of 2 kcal/mol, compared to explicit DFT/MM calculations. read less NOT USED (low confidence) J. Aeschlimann, F. Ducry, C. Weilenmann, J. Leuthold, A. Emboras, and M. Luisier, “Multiscale Modeling of Metal-Oxide-Metal Conductive Bridging Random-Access Memory Cells: From
Ab Initio
to Finite-Element Calculations,” Physical Review Applied. 2023. link Times cited: 0 NOT USED (low confidence) J. A. Vita and D. Schwalbe-Koda, “Data efficiency and extrapolation trends in neural network interatomic potentials,” Machine Learning: Science and Technology. 2023. link Times cited: 1 Abstract: Recently, key architectural advances have been proposed for … read moreAbstract: Recently, key architectural advances have been proposed for neural network interatomic potentials (NNIPs), such as incorporating message-passing networks, equivariance, or many-body expansion terms. Although modern NNIP models exhibit small differences in test accuracy, this metric is still considered the main target when developing new NNIP architectures. In this work, we show how architectural and optimization choices influence the generalization of NNIPs, revealing trends in molecular dynamics (MD) stability, data efficiency, and loss landscapes. Using the 3BPA dataset, we uncover trends in NNIP errors and robustness to noise, showing these metrics are insufficient to predict MD stability in the high-accuracy regime. With a large-scale study on NequIP, MACE, and their optimizers, we show that our metric of loss entropy predicts out-of-distribution error and data efficiency despite being computed only on the training set. This work provides a deep learning justification for probing extrapolation and can inform the development of next-generation NNIPs. read less NOT USED (low confidence) P. Lemos, A. Coogan, Y. Hezaveh, and L. P. Levasseur, “Sampling-Based Accuracy Testing of Posterior Estimators for General Inference,” ArXiv. 2023. link Times cited: 11 Abstract: Parameter inference, i.e. inferring the posterior distributi… read moreAbstract: Parameter inference, i.e. inferring the posterior distribution of the parameters of a statistical model given some data, is a central problem to many scientific disciplines. Generative models can be used as an alternative to Markov Chain Monte Carlo methods for conducting posterior inference, both in likelihood-based and simulation-based problems. However, assessing the accuracy of posteriors encoded in generative models is not straightforward. In this paper, we introduce `Tests of Accuracy with Random Points' (TARP) coverage testing as a method to estimate coverage probabilities of generative posterior estimators. Our method differs from previously-existing coverage-based methods, which require posterior evaluations. We prove that our approach is necessary and sufficient to show that a posterior estimator is accurate. We demonstrate the method on a variety of synthetic examples, and show that TARP can be used to test the results of posterior inference analyses in high-dimensional spaces. We also show that our method can detect inaccurate inferences in cases where existing methods fail. read less NOT USED (low confidence) M. Popov, F. Khorobrykh, S. Klimin, V. Churkin, D. Ovsyannikov, and A. Kvashnin, “Surface Tamm States of 2–5 nm Nanodiamond via Raman Spectroscopy,” Nanomaterials. 2023. link Times cited: 2 Abstract: We observed resonance effects in the Raman scattering of nan… read moreAbstract: We observed resonance effects in the Raman scattering of nanodiamonds with an average size of 2–5 nm excited at a wavelength of 1064 nm (1.16 eV). The resonant Raman spectrum of the 2–5 nm nanodiamonds consists of bands at wavelengths of 1325 and 1600 cm−1, a band at 1100–1250 cm−1, and a plateau in the range from 1420 to 1630 cm−1. When excited away from the resonance (at a wavelength of 405 nm, 3.1 eV), the Raman spectrum consists of only three bands at 1325, 1500, and 1600 cm−1. It is important to note that the additional lines (1500 and 1600 cm−1) belong to the sp3-hybridized carbon bonds. The phonon density of states for the nanodiamonds (~1 nm) was calculated using moment tensor potentials (MTP), a class of machine-learning interatomic potentials. The presence of these modes in agreement with the lattice dynamics indicates the existence of bonds with force constants higher than in single-crystal diamonds. The observed resonant phenomena of the Raman scattering and the increase in the bulk modulus are explained by the presence of Tamm states with an energy of electronic transitions of approximately 1 eV, previously observed on the surface of single-crystal diamonds. read less NOT USED (low confidence) R. Ding et al., “Machine Learning Utilized for the Development of Proton Exchange Membrane Electrolyzers,” SSRN Electronic Journal. 2023. link Times cited: 6 NOT USED (low confidence) D. Vizoso, G. Subhash, K. Rajan, and R. Dingreville, “Connecting Vibrational Spectroscopy to Atomic Structure via Supervised Manifold Learning: Beyond Peak Analysis,” Chemistry of Materials. 2023. link Times cited: 1 Abstract: Vibrational spectroscopy is a nondestructive technique commo… read moreAbstract: Vibrational spectroscopy is a nondestructive technique commonly used in chemical and physical analyses to determine atomic structures and associated properties. However, the evaluation and interpretation of spectroscopic profiles based on human-identifiable peaks can be difficult and convoluted. To address this challenge, we present a reliable protocol based on supervised manifold learning techniques meant to connect vibrational spectra to a variety of complex and diverse atomic structure configurations. As an illustration, we examined a large database of virtual vibrational spectroscopy profiles generated from atomistic simulations for silicon structures subjected to different stress, amorphization, and disordering states. We evaluated representative features in those spectra via various linear and nonlinear dimensionality reduction techniques and used the reduced representation of those features with decision trees to correlate them with structural information unavailable through classical human-identifiable peak analysis. We show that our trained model accurately (over 97% accuracy) and robustly (insensitive to noise) disentangles the contribution from the different material states, hence demonstrating a comprehensive decoding of spectroscopic profiles beyond classical (human-identifiable) peak analysis. read less NOT USED (low confidence) J. Wang, A. A. Panchal, and P. Canepa, “Strategies for fitting accurate machine-learned inter-atomic potentials for solid electrolytes,” Materials Futures. 2023. link Times cited: 3 Abstract: Ion transport in materials is routinely probed through sever… read moreAbstract: Ion transport in materials is routinely probed through several experimental techniques, which introduce variability in reported ionic diffusivities and conductivities. The computational prediction of ionic diffusivities and conductivities helps in identifying good ionic conductors, and suitable solid electrolytes (SEs), thus establishing firm structure-property relationships. Machine-learned potentials are an attractive strategy to extend the capabilities of accurate ab initio molecular dynamics (AIMD) to longer simulations for larger systems, enabling the study of ion transport at lower temperatures. However, machine-learned potentials being in their infancy, critical assessments of their predicting capabilities are rare. Here, we identified the main factors controlling the quality of a machine-learning potential based on the moment tensor potential formulation, when applied to the properties of ion transport in ionic conductors, such as SEs. Our results underline the importance of high-quality and diverse training sets required to fit moment tensor potentials. We highlight the importance of considering intrinsic defects which may occur in SEs. We demonstrate the limitations posed by short-timescale and high-temperature AIMD simulations to predict the room-temperature properties of materials. read less NOT USED (low confidence) S. Bougueroua, Y. Aboulfath, D. Barth, and M. Gaigeot, “Algorithmic graph theory for post-processing molecular dynamics trajectories,” Molecular Physics. 2023. link Times cited: 0 Abstract: This paper reviews some of the graph theory-based methods th… read moreAbstract: This paper reviews some of the graph theory-based methods that were recently developed in our group for post-processing molecular dynamics trajectories. We show that the use of algorithmic graph theory not only provides a direct and fast methodology to identify conformers that are sampled over time, but it also allows to follow in time the interconversions between the conformers through graphs of transitions, also provides statistical characterisations, that would otherwise be hard to obtain. Examples for a gas phase peptide and for the more complex inhomogeneous charged air–liquid water interface are presented in order to demonstrate the power of topological 2D-graphs and their versatility and transferability. GRAPHICAL ABSTRACT read less NOT USED (low confidence) T. Sours and A. Kulkarni, “Predicting Structural Properties of Pure Silica Zeolites Using Deep Neural Network Potentials,” The Journal of Physical Chemistry. C, Nanomaterials and Interfaces. 2023. link Times cited: 5 Abstract: Machine learning potentials (MLPs) capable of accurately des… read moreAbstract: Machine learning potentials (MLPs) capable of accurately describing complex ab initio potential energy surfaces (PESs) have revolutionized the field of multiscale atomistic modeling. In this work, using an extensive density functional theory (DFT) data set (denoted as Si-ZEO22) consisting of 219 unique zeolite topologies (350,000 unique DFT calculations) found in the International Zeolite Association (IZA) database, we have trained a DeePMD-kit MLP to model the dynamics of silica frameworks. The performance of our model is evaluated by calculating various properties that probe the accuracy of the energy and force predictions. This MLP demonstrates impressive agreement with DFT for predicting zeolite structural properties, energy–volume trends, and phonon density of states. Furthermore, our model achieves reasonable predictions for stress–strain relationships without including DFT stress data during training. These results highlight the ability of MLPs to capture the flexibility of zeolite frameworks and motivate further MLP development for nanoporous materials with near-ab initio accuracy. read less NOT USED (low confidence) J. Jiang, L.-C. Xu, F. Li, and J. Shao, “Machine Learning Potential Model Based on Ensemble Bispectrum Feature Selection and Its Applicability Analysis,” Metals. 2023. link Times cited: 2 Abstract: With the continuous improvement of machine learning methods,… read moreAbstract: With the continuous improvement of machine learning methods, building the interatomic machine learning potential (MLP) based on the datasets from quantum mechanics calculations has become an effective technical approach to improving the accuracy of classical molecular dynamics simulation. The Spectral Neighbor Analysis Potential (SNAP) is one of the most commonly used machine learning potentials. It uses the bispectrum to encode the local environment of each atom in the lattice. The hyperparameter jmax controls the mapping complexity and precision between the local environment and the bispectrum descriptor. As the hyperparameter jmax increases, the description will become more accurate, but the number of parameters in the bispectrum descriptor will increase dramatically, increasing the computational complexity. In order to reduce the computational complexity without losing the computational accuracy, this paper proposes a two-level ensemble feature selection method (EFS) for a bispectrum descriptor, combining the perturbation method and the feature selector ensemble strategy. Based on the proposed method, the feature subset is selected from the original dataset of the bispectrum descriptor for building the dimension-reduced MLP. As a method application and validation, the data of Fe, Ni, Cu, Li, Mo, Si, and Ge metal elements are used to train the linear regression model based on SNAP for predicting these metals’ atomic energies and forces them to evaluate the performance of the feature subsets. The experimental results show that, compared to the features of SNAP and qSNAP, the training complexity improvement of our EFS method on the qSNAP feature is more effective than SNAP. Compared with the existing methods, when the feature subset size is 0.7 times that of the original features, the proposed EFS method based on the SSWRP ensemble strategy can achieve the best performance in terms of stability, achieving an average stability of 0.94 across all datasets. The training complexity of the linear regression model is reduced by about half, and the prediction complexity is reduced by about 30%. read less NOT USED (low confidence) A. Seko, “Tutorial: Systematic development of polynomial machine learning potentials for elemental and alloy systems,” Journal of Applied Physics. 2023. link Times cited: 0 Abstract: Machine learning potentials (MLPs) developed from extensive … read moreAbstract: Machine learning potentials (MLPs) developed from extensive datasets constructed from density functional theory calculations have become increasingly appealing to many researchers. This paper presents a framework of polynomial-based MLPs, called polynomial MLPs. The systematic development of accurate and computationally efficient polynomial MLPs for many elemental and binary alloy systems and their predictive powers for various properties are also demonstrated. Consequently, many polynomial MLPs are available in a repository website [A. Seko, Polynomial Machine Learning Potential Repository at Kyoto University, https://sekocha.github.io ]. The repository will help many scientists perform accurate and efficient large-scale atomistic simulations and crystal structure searches. read less NOT USED (low confidence) N. Goldman, L. Fried, R. Lindsey, C. Pham, and R. Dettori, “Enhancing the accuracy of density functional tight binding models through ChIMES many-body interaction potentials.,” The Journal of chemical physics. 2023. link Times cited: 2 Abstract: Semi-empirical quantum models such as Density Functional Tig… read moreAbstract: Semi-empirical quantum models such as Density Functional Tight Binding (DFTB) are attractive methods for obtaining quantum simulation data at longer time and length scales than possible with standard approaches. However, application of these models can require lengthy effort due to the lack of a systematic approach for their development. In this work, we discuss the use of the Chebyshev Interaction Model for Efficient Simulation (ChIMES) to create rapidly parameterized DFTB models, which exhibit strong transferability due to the inclusion of many-body interactions that might otherwise be inaccurate. We apply our modeling approach to silicon polymorphs and review previous work on titanium hydride. We also review the creation of a general purpose DFTB/ChIMES model for organic molecules and compounds that approaches hybrid functional and coupled cluster accuracy with two orders of magnitude fewer parameters than similar neural network approaches. In all cases, DFTB/ChIMES yields similar accuracy to the underlying quantum method with orders of magnitude improvement in computational cost. Our developments provide a way to create computationally efficient and highly accurate simulations over varying extreme thermodynamic conditions, where physical and chemical properties can be difficult to interrogate directly, and there is historically a significant reliance on theoretical approaches for interpretation and validation of experimental results. read less NOT USED (low confidence) S. Takamoto, D. Okanohara, Q. J. Li, and J. Li, “Towards universal neural network interatomic potential,” Journal of Materiomics. 2023. link Times cited: 3 NOT USED (low confidence) G.-H. Lai et al., “The mechanism of external pressure suppressing dendrites growth in Li metal batteries,” Journal of Energy Chemistry. 2023. link Times cited: 4 NOT USED (low confidence) R. Lucrezi, E. Kogler, S. D. Cataldo, M. Aichhorn, L. Boeri, and C. Heil, “Quantum lattice dynamics and their importance in ternary superhydride clathrates,” Communications Physics. 2022. link Times cited: 4 NOT USED (low confidence) H. Deng, J. Comer, and B. Liu, “A high-dimensional neural network potential for molecular dynamics simulations of condensed phase nickel and phase transitions,” Molecular Simulation. 2022. link Times cited: 0 Abstract: ABSTRACT A high-dimensional neural network interatomic poten… read moreAbstract: ABSTRACT A high-dimensional neural network interatomic potential was developed and used in molecular dynamics simulations of condensed phase Ni and Ni systems with liquid–solid phase coexistence. The reference data set was generated by sampling the potential energy surface over a broad temperature-pressure domain using ab initio MD simulations to train a unified potential. Excellent agreement was achieved between bulk face-centred cubic nickel thermal expansion simulations and relevant experimental data. The same potential also yields accurate structures and diffusivities in the liquid state. The phase transition between liquid and solid phases was simulated using the two-phase interface method. The predicted melting point temperature is within a few kelvins of the literature value. The general methodology could be applied to describe crystals with much more complex phase behaviours. read less NOT USED (low confidence) W. Zhang et al., “Revealing Morphology Evolution of Lithium Dendrites by Large‐Scale Simulation Based on Machine Learning Force Field,” Advanced Energy Materials. 2022. link Times cited: 6 Abstract: Solving the dendrite growth problem is critical for the deve… read moreAbstract: Solving the dendrite growth problem is critical for the development of lithium metal anode for high‐capacity batteries. In this work, a machine learning force field model in combination with a self‐consistent continuum solvation model is used to simulate the morphology evolution of dendrites in a working electrolyte environment. The dynamic evolution of the dendrite morphology can be described in two stages. In the first stage, the energy reduction of the surface atoms induces localized reorientation of the originally single‐crystal dendrite and the formation of multiple domains. In the second stage, the energy reduction of internal atoms drives the migration of grain boundaries and the slipping of crystal domains. The results indicate that the formation of multiple domains might help to stabilize the dendrite, as a higher temperature trajectory in a single crystal dendrite without domains shows a higher dendrite collapsing rate. Several possible modes of morphological evolutions are also investigated, including surface diffusion of adatoms and configuration twists from [100] exposed surfaces to [110] exposed surfaces. In summary, reducing the surface and grain boundary energy drives the morphology evolution. Based on the analysis of these driving forces, some guidelines are suggested for designing a more stable lithium metal anode. read less NOT USED (low confidence) M. Chigaev et al., “Lightweight and effective tensor sensitivity for atomistic neural networks.,” The Journal of chemical physics. 2022. link Times cited: 3 Abstract: Atomistic machine learning focuses on the creation of models… read moreAbstract: Atomistic machine learning focuses on the creation of models that obey fundamental symmetries of atomistic configurations, such as permutation, translation, and rotation invariances. In many of these schemes, translation and rotation invariance are achieved by building on scalar invariants, e.g., distances between atom pairs. There is growing interest in molecular representations that work internally with higher rank rotational tensors, e.g., vector displacements between atoms, and tensor products thereof. Here, we present a framework for extending the Hierarchically Interacting Particle Neural Network (HIP-NN) with Tensor Sensitivity information (HIP-NN-TS) from each local atomic environment. Crucially, the method employs a weight tying strategy that allows direct incorporation of many-body information while adding very few model parameters. We show that HIP-NN-TS is more accurate than HIP-NN, with negligible increase in parameter count, for several datasets and network sizes. As the dataset becomes more complex, tensor sensitivities provide greater improvements to model accuracy. In particular, HIP-NN-TS achieves a record mean absolute error of 0.927 kcalmol for conformational energy variation on the challenging COMP6 benchmark, which includes a broad set of organic molecules. We also compare the computational performance of HIP-NN-TS to HIP-NN and other models in the literature. read less NOT USED (low confidence) E. Sikorski, M. Cusentino, M. J. McCarthy, J. Tranchida, M. A. Wood, and A. Thompson, “Machine learned interatomic potential for dispersion strengthened plasma facing components.,” The Journal of chemical physics. 2022. link Times cited: 5 Abstract: Tungsten (W) is a material of choice for the divertor materi… read moreAbstract: Tungsten (W) is a material of choice for the divertor material due to its high melting temperature, thermal conductivity, and sputtering threshold. However, W has a very high brittle-to-ductile transition temperature, and at fusion reactor temperatures (≥1000 K), it may undergo recrystallization and grain growth. Dispersion-strengthening W with zirconium carbide (ZrC) can improve ductility and limit grain growth, but much of the effects of the dispersoids on microstructural evolution and thermomechanical properties at high temperatures are still unknown. We present a machine learned Spectral Neighbor Analysis Potential for W-ZrC that can now be used to study these materials. In order to construct a potential suitable for large-scale atomistic simulations at fusion reactor temperatures, it is necessary to train on ab initio data generated for a diverse set of structures, chemical environments, and temperatures. Further accuracy and stability tests of the potential were achieved using objective functions for both material properties and high temperature stability. Validation of lattice parameters, surface energies, bulk moduli, and thermal expansion is confirmed on the optimized potential. Tensile tests of W/ZrC bicrystals show that although the W(110)-ZrC(111) C-terminated bicrystal has the highest ultimate tensile strength (UTS) at room temperature, observed strength decreases with increasing temperature. At 2500 K, the terminating C layer diffuses into the W, resulting in a weaker W-Zr interface. Meanwhile, the W(110)-ZrC(111) Zr-terminated bicrystal has the highest UTS at 2500 K. read less NOT USED (low confidence) K. Ghorbani, P. Mirchi, S. Arabha, A. Rajabpour, and S. Volz, “Lattice Thermal Conductivity and Elastic Modulus of Xn4 (X=Be, Mg and Pt),” SSRN Electronic Journal. 2022. link Times cited: 2 Abstract: The newly synthesized BeN4 monolayer has introduced a novel … read moreAbstract: The newly synthesized BeN4 monolayer has introduced a novel group of 2D materials called nitrogen-rich 2D materials. In the present study, the anisotropic mechanical and thermal properties of three members of this group, BeN4, MgN4, and PtN4, are investigated. To this end, a machine learning-based interatomic potential (MLIP) is developed on the basis of the moment tensor potential (MTP) method and utilized in classical molecular dynamics (MD) simulation. Mechanical properties are calculated by extracting the stress-strain curve and thermal properties by non-equilibrium molecular dynamics (NEMD) method. Acquired results show the anisotropic elastic modulus and lattice thermal conductivity of these materials. Generally, elastic modulus and thermal conductivity in the armchair direction are higher than in the zigzag direction. Also, the elastic anisotropy is almost constant at every temperature for BeN4 and MgN4, while for PtN4, this parameter is decreased by increasing the temperature. The findings of this research are not only evidence of the application of machine learning in MD simulations, but also provide information on the basic anisotropic mechanical and thermal properties of these newly discovered 2D nanomaterials. read less NOT USED (low confidence) S. Ghosal, N. S. Mondal, S. Chowdhury, and D. Jana, “Two novel phases of germa-graphene: Prediction, electronic and transport applications,” Applied Surface Science. 2022. link Times cited: 2 NOT USED (low confidence) J. D. Morrow, J. L. A. Gardner, and V. L. Deringer, “How to validate machine-learned interatomic potentials.,” The Journal of chemical physics. 2022. link Times cited: 12 Abstract: Machine learning (ML) approaches enable large-scale atomisti… read moreAbstract: Machine learning (ML) approaches enable large-scale atomistic simulations with near-quantum-mechanical accuracy. With the growing availability of these methods, there arises a need for careful validation, particularly for physically agnostic models-that is, for potentials that extract the nature of atomic interactions from reference data. Here, we review the basic principles behind ML potentials and their validation for atomic-scale material modeling. We discuss the best practice in defining error metrics based on numerical performance, as well as physically guided validation. We give specific recommendations that we hope will be useful for the wider community, including those researchers who intend to use ML potentials for materials "off the shelf." read less NOT USED (low confidence) H. Hirai, T. Iizawa, T. Tamura, M. Karasuyama, R. Kobayashi, and T. Hirose, “Machine-learning-based prediction of first-principles XANES spectra for amorphous materials,” Physical Review Materials. 2022. link Times cited: 1 NOT USED (low confidence) X. Chen, D. S. Kim, and J. Lebeau, “A comparison of molecular dynamics potentials used to account for thermal diffuse scattering in multislice simulations.,” Ultramicroscopy. 2022. link Times cited: 1 NOT USED (low confidence) Y. Zhang, Q. Lin, and B. Jiang, “Atomistic neural network representations for chemical dynamics simulations of molecular, condensed phase, and interfacial systems: Efficiency, representability, and generalization,” Wiley Interdisciplinary Reviews: Computational Molecular Science. 2022. link Times cited: 10 Abstract: Machine learning techniques have been widely applied in many… read moreAbstract: Machine learning techniques have been widely applied in many fields of chemistry, physics, biology, and materials science. One of the most fruitful applications is machine learning of the complicated multidimensional function of potential energy or related electronic properties from discrete quantum chemical data. In particular, substantial efforts have been dedicated to developing various atomistic neural network (AtNN) representations, which refer to a family of methods expressing the targeted physical quantity as a sum of atomic components represented by atomic NNs. This class of approaches not only fully preserves the physical symmetry of the system but also scales linearly with respect to the size of a system, enabling accurate and efficient chemical dynamics and spectroscopic simulations in complicated systems and even a number of variably sized systems across the phases. In this review, we discuss different strategies in developing highly efficient and representable AtNN potentials, and in generalizing these scalar AtNN models to learn vectorial and tensorial quantities with the correct rotational equivariance. We also review active learning algorithms to generate practical AtNN models and present selected examples of AtNN applications in gas‐surface systems to demonstrate their capabilities of accurately representing both molecular systems and condensed phase systems. We conclude this review by pointing out remaining challenges for the further development of more reliable, transferable, and scalable AtNN representations in more application scenarios. read less NOT USED (low confidence) R. Yang et al., “Big Data in a Nano World: A Review on Computational, Data-Driven Design of Nanomaterials Structures, Properties, and Synthesis,” ACS Nano. 2022. link Times cited: 10 Abstract: The recent rise of computational, data-driven research has s… read moreAbstract: The recent rise of computational, data-driven research has significant potential to accelerate materials discovery. Automated workflows and materials databases are being rapidly developed, contributing to high-throughput data of bulk materials that are growing in quantity and complexity, allowing for correlation between structural–chemical features and functional properties. In contrast, computational data-driven approaches are still relatively rare for nanomaterials discovery due to the rapid scaling of computational cost for finite systems. However, the distinct behaviors at the nanoscale as compared to the parent bulk materials and the vast tunability space with respect to dimensionality and morphology motivate the development of data sets for nanometric materials. In this review, we discuss the recent progress in data-driven research in two aspects: functional materials design and guided synthesis, including commonly used metrics and approaches for designing materials properties and predicting synthesis routes. More importantly, we discuss the distinct behaviors of materials as a result of nanosizing and the implications for data-driven research. Finally, we share our perspectives on future directions for extending the current data-driven research into the nano realm. read less NOT USED (low confidence) H. Li, W. Zheng, W. Liu, and Q. Zhu, “Intrinsically and extrinsically anisotropic heat transport in bulk materials and nanostructures: A review,” International Journal of Heat and Mass Transfer. 2022. link Times cited: 2 NOT USED (low confidence) Z. Qin, R. Wang, S. Li, T. Wen, B. Yin, and Z. Wu, “MEAM interatomic potential for thermodynamic and mechanical properties of lithium allotropes,” Computational Materials Science. 2022. link Times cited: 4 NOT USED (low confidence) M. Fronzi, R. Amos, R. Kobayashi, N. Matsumura, K. Watanabe, and R. K. Morizawa, “Evaluation of Machine Learning Interatomic Potentials for the Properties of Gold Nanoparticles,” Nanomaterials. 2022. link Times cited: 4 Abstract: We have investigated Machine Learning Interatomic Potentials… read moreAbstract: We have investigated Machine Learning Interatomic Potentials in application to the properties of gold nanoparticles through the DeePMD package, using data generated with the ab-initio VASP program. Benchmarking was carried out on Au20 nanoclusters against ab-initio molecular dynamics simulations and show we can achieve similar accuracy with the machine learned potential at far reduced cost using LAMMPS. We have been able to reproduce structures and heat capacities of several isomeric forms. Comparison of our workflow with similar ML-IP studies is discussed and has identified areas for future improvement. read less NOT USED (low confidence) A. Hernandez and T. Mueller, “Generalizability of Functional Forms for Interatomic Potential Models Discovered by Symbolic Regression,” ArXiv. 2022. link Times cited: 0 Abstract: In recent years there has been great progress in the use of … read moreAbstract: In recent years there has been great progress in the use of machine learning algorithms to develop interatomic potential models. Machine-learned potential models are typically orders of magnitude faster than density functional theory but also orders of magnitude slower than physics-derived models such as the embedded atom method. In our previous work, we used symbolic regression to develop fast, accurate and transferrable interatomic potential models for copper with novel functional forms that resemble those of the embedded atom method. To determine the extent to which the success of these forms was specific to copper, here we explore the generalizability of these models to other face-centered cubic transition metals and analyze their out-of-sample performance on several material properties. We found that these forms work particularly well on elements that are chemically similar to copper. When compared to optimized Sutton-Chen models, which have similar complexity, the functional forms discovered using symbolic regression perform better across all elements considered except gold where they have a similar performance. They perform similarly to a moderately more complex embedded atom form on properties on which they were trained, and they are more accurate on average on other properties. We attribute this improved generalized accuracy to the relative simplicity of the models discovered using symbolic regression. The genetic programming models are found to outperform other models from the literature about 50% of the time in a variety of property predictions, with about 1/10th the model complexity on average. We discuss the implications of these results to the broader application of symbolic regression to the development of new potentials and highlight how models discovered for one element can be used to seed new searches for different elements. read less NOT USED (low confidence) Đ. Dangić, S. Fahy, and I. Savić, “Molecular dynamics simulation of the ferroelectric phase transition in GeTe: Displacive or order-disorder character,” Physical Review B. 2022. link Times cited: 0 NOT USED (low confidence) S. Bac, A. Patra, K. J. Kron, and S. M. Sharada, “Recent Advances toward Efficient Calculation of Higher Nuclear Derivatives in Quantum Chemistry.,” The journal of physical chemistry. A. 2022. link Times cited: 3 Abstract: In this paper, we provide an overview of state-of-the-art te… read moreAbstract: In this paper, we provide an overview of state-of-the-art techniques that are being developed for efficient calculation of second and higher nuclear derivatives of quantum mechanical (QM) energy. Calculations of nuclear Hessians and anharmonic terms incur high costs and memory and scale poorly with system size. Three emerging classes of methods─machine learning (ML), automatic differentiation (AD), and matrix completion (MC)─have demonstrated promise in overcoming these challenges. We illustrate studies that employ unsupervised ML methods to reduce the need for multiple Hessian calculations in dynamics simulations and those that utilize supervised ML to construct approximate potential energy surfaces and estimate Hessians and anharmonic terms at reduced cost. By extension, if electronic structure operations could be written in a manner similar to functions underlying ML methods, rapid differentiation or AD routines can be employed to inexpensively calculate higher arbitrary-order derivatives. While ML approaches are typically black-box, we describe methods such as compressed sensing (CS) and MC, which explicitly leverage problem-specific mathematical properties of higher derivatives such as sparsity and low-rank, to complete higher derivative information using only a small, incomplete sample. The three classes of methods facilitate reliable predictions of observables ranging from infrared spectra to thermal conductivity and constitute a promising way forward in accurately capturing otherwise intractable higher-order responses of QM energy to nuclear perturbations. read less NOT USED (low confidence) G. Jacobson, J. M. Marmolejo-Tejada, and M. A. Mosquera, “Cluster Amplitudes and Their Interplay with Self-Consistency in Density Functional Methods.,” Chemphyschem : a European journal of chemical physics and physical chemistry. 2022. link Times cited: 0 Abstract: Density functional theory (DFT) provides convenient electron… read moreAbstract: Density functional theory (DFT) provides convenient electronic structure methods for the study of molecular systems and materials. Regular Kohn-Sham DFT calculations rely on unitary transformations to determine the ground-state electronic density, ground state energy, and related properties. However, for dissociation of molecular systems into open-shell fragments, due to the self-interaction error present in a large number of density functional approximations, the self-consistent procedure based on the this type of transformation gives rise to the well-known charge delocalization problem. To avoid this issue, we showed previously that the cluster operator of coupled-cluster theory can be utilized within the context of DFT to solve in an alternative and approximate fashion the ground-state self-consistent problem. This work further examines the application of the singles cluster operator to molecular ground state calculations. Two approximations are derived and explored: i), A linearized scheme of the quadratic equation used to determine the cluster amplitudes, and, ii), the effect of carrying the calculations in a non-self-consistent field fashion. These approaches are found to be capable of improving the energy and density of the system and are quite stable in either case. The theoretical framework discussed in this work could be used to describe, with an added flexibility, quantum systems that display challenging features and require expanded theoretical methods. read less NOT USED (low confidence) C. Myung, A. Hajibabaei, J. H. Cha, M. Ha, J. Kim, and K. S. Kim, “Challenges, Opportunities, and Prospects in Metal Halide Perovskites from Theoretical and Machine Learning Perspectives,” Advanced Energy Materials. 2022. link Times cited: 9 Abstract: Metal halide perovskite (MHP) is a promising next generation… read moreAbstract: Metal halide perovskite (MHP) is a promising next generation energy material for various applications, such as solar cells, light emitting diodes, lasers, sensors, and transistors. MHPs show excellent mechanical, dielectric, photovoltaic, photoluminescence, and electronic properties, and such intriguing physical and chemical properties have drawn attention recently. However, there exists a chasm between the successful applications of MHPs and theoretical understandings. The difficulty arises from the intrinsic properties of MHPs, including structural disorder, ionic interactions, nonadiabatic effects, and composition diversity. Machine learning (ML) approaches have shown great promise as a tool to overcome the theoretical obstacles in many fields of science. In this perspective, the pending theoretical challenges from experiments are overviewed and promising ML approaches, including ab initio ML potentials, materials design/optimization models, and data mining strategies are proposed. Possible roles and pipelines of ML frameworks are highlighted to close the gap between experiment and theory in MHPs. read less NOT USED (low confidence) S. Chowdhury, V. Demin, L. Chernozatonskii, and A. Kvashnin, “Ultra-Low Thermal Conductivity of Moiré Diamanes,” Membranes. 2022. link Times cited: 4 Abstract: Ultra-thin diamond membranes, diamanes, are one of the most … read moreAbstract: Ultra-thin diamond membranes, diamanes, are one of the most intriguing quasi-2D films, combining unique mechanical, electronic and optical properties. At present, diamanes have been obtained from bi- or few-layer graphene in AA- and AB-stacking by full hydrogenation or fluorination. Here, we study the thermal conductivity of diamanes obtained from bi-layer graphene with twist angle θ between layers forming a Moiré pattern. The combination of DFT calculations and machine learning interatomic potentials makes it possible to perform calculations of the lattice thermal conductivity of such diamanes with twist angles θ of 13.2∘, 21.8∘ and 27.8∘ using the solution of the phonon Boltzmann transport equation. Obtained results show that Moiré diamanes exhibit a wide variety of thermal properties depending on the twist angle, namely a sharp decrease in thermal conductivity from high for “untwisted” diamanes to ultra-low values when the twist angle tends to 30∘, especially for hydrogenated Moiré diamanes. This effect is associated with high anharmonicity and scattering of phonons related to a strong symmetry breaking of the atomic structure of Moiré diamanes compared with untwisted ones. read less NOT USED (low confidence) M. L. H. Chandrappa, J. Qi, C. Chen, S. Banerjee, and S. Ong, “Thermodynamics and Kinetics of the Cathode–Electrolyte Interface in All-Solid-State Li–S Batteries,” Journal of the American Chemical Society. 2022. link Times cited: 9 Abstract: Lithium–sulfur batteries (LSBs) are among the most promising… read moreAbstract: Lithium–sulfur batteries (LSBs) are among the most promising energy storage technologies due to the low cost and high abundance of S. However, the issue of polysulfide shuttling with its corresponding capacity fading is a major impediment to its commercialization. Replacing traditional liquid electrolytes with solid-state electrolytes (SEs) is a potential solution. Here, we present a comprehensive study of the thermodynamics and kinetics of the cathode–electrolyte interface in all-solid-state LSBs using density functional theory based calculations and a machine learning interatomic potential. We find that among the major solid electrolyte chemistries (oxides, sulfides, nitrides, and halides), sulfide SEs are generally predicted to be the most stable against the S8 cathode, while the other SE chemistries are predicted to be highly electrochemically unstable. If the use of other SE chemistries is desired for other reasons, several binary and ternary sulfides (e.g., LiAlS2, Sc2S3, Y2S3) are predicted to be excellent buffer layers. Finally, an accurate moment tensor potential to study the S8|β-Li3PS4 interface was developed using an active learning approach. Molecular dynamics (MD) simulations of large interface models (>1000s atoms) revealed that the most stable Li3PS4(100) surface tends to form interfaces with S8 with 2D channels and lower activation barriers for Li diffusion. These results provide critical new insights into the cathode–electrolyte interface design for next-generation all-solid-state LSBs. read less NOT USED (low confidence) C. Wang, T. Mueller, and R. Assary, “Ionic Dynamics of the Charge Carrier in Layered Solid Materials for Mg Rechargeable Batteries,” Chemistry of Materials. 2022. link Times cited: 1 NOT USED (low confidence) R. Chahal, S. Roy, M. Brehm, S. Banerjee, V. Bryantsev, and S. T. Lam, “Transferable Deep Learning Potential Reveals Intermediate-Range Ordering Effects in LiF–NaF–ZrF4 Molten Salt,” JACS Au. 2022. link Times cited: 9 Abstract: LiF–NaF–ZrF4 multicomponent molten salts are promising candi… read moreAbstract: LiF–NaF–ZrF4 multicomponent molten salts are promising candidate coolants for advanced clean energy systems owing to their desirable thermophysical and transport properties. However, the complex structures enabling these properties, and their dependence on composition, is scarcely quantified due to limitations in simulating and interpreting experimental spectra of highly disordered, intermediate-ranged structures. Specifically, size-limited ab initio simulations and accuracy-limited classical models used in the past are unable to capture a wide range of fluctuating motifs found in the extended heterogeneous structures of liquid salt. This greatly inhibits our ability to design tailored compositions and materials. Here, accurate, efficient, and transferable machine learning potentials are used to predict structures far beyond the first coordination shell in LiF–NaF–ZrF4. Neural networks trained at only eutectic compositions with 29% and 37% ZrF4 are shown to accurately simulate a wide range of compositions (11–40% ZrF4) with dramatically different coordination chemistries, while showing a remarkable agreement with theoretical and experimental Raman spectra. The theoretical Raman calculations further uncovered the previously unseen shift and flattening of bending band at ∼250 cm–1 which validated the simulated extended-range structures as observed in compositions with higher than 29% ZrF4 content. In such cases, machine learning-based simulations capable of accessing larger time and length scales (beyond 17 Å) were critical for accurately predicting both structure and ionic diffusivities. read less NOT USED (low confidence) L. Wu et al., “Machine learning accelerated carbon neutrality research using big data—from predictive models to interatomic potentials,” Science China Technological Sciences. 2022. link Times cited: 2 NOT USED (low confidence) E. F. Bull-Vulpe, M. Riera, S. Bore, and F. Paesani, “Data-Driven Many-Body Potential Energy Functions for Generic Molecules: Linear Alkanes as a Proof-of-Concept Application.,” Journal of chemical theory and computation. 2022. link Times cited: 7 Abstract: We present a generalization of the many-body energy (MB-nrg)… read moreAbstract: We present a generalization of the many-body energy (MB-nrg) theoretical/computational framework that enables the development of data-driven potential energy functions (PEFs) for generic covalently bonded molecules, with arbitrary quantum mechanical accuracy. The "nearsightedness of electronic matter" is exploited to define monomers as "natural building blocks" on the basis of their distinct chemical identity. The energy of generic molecules is then expressed as a sum of individual many-body energies of incrementally larger subsystems. The MB-nrg PEFs represent the low-order n-body energies, with n = 1-4, using permutationally invariant polynomials derived from electronic structure data carried out at an arbitrary quantum mechanical level of theory, while all higher-order n-body terms (n > 4) are represented by a classical many-body polarization term. As a proof-of-concept application of the general MB-nrg framework, we present MB-nrg PEFs for linear alkanes. The MB-nrg PEFs are shown to accurately reproduce reference energies, harmonic frequencies, and potential energy scans of alkanes, independently of their length. Since, by construction, the MB-nrg framework introduced here can be applied to generic covalently bonded molecules, we envision future computer simulations of complex molecular systems using data-driven MB-nrg PEFs, with arbitrary quantum mechanical accuracy. read less NOT USED (low confidence) H. S. Kouhestani et al., “Prognosis and Health Management (PHM) of Solid-State Batteries: Perspectives, Challenges, and Opportunities,” Energies. 2022. link Times cited: 3 Abstract: Solid-state batteries (SSBs) have proven to have the potenti… read moreAbstract: Solid-state batteries (SSBs) have proven to have the potential to be a proper substitute for conventional lithium-ion batteries due to their promising features. In order for the SSBs to be market-ready, the prognostics and health management (PHM) of battery systems plays a critical role in achieving such a goal. PHM ensures the reliability and availability of batteries during their operational time with acceptable safety margin. In the past two decades, much of the focus has been directed towards the PHM of lithium-ion batteries, while little attention has been given to PHM of solid-state batteries. Hence, this report presents a holistic review of the recent advances and current trends in PHM techniques of solid-state batteries and the associated challenges. For this purpose, notable commonly employed physics-based, data-driven, and hybrid methods are discussed in this report. The goal of this study is to bridge the gap between liquid state and SSBs and present the crucial aspects of SSBs that should be considered in order to have an accurate PHM model. The primary focus is given to the ML-based data-driven methods and the requirements that are needed to be included in the models, including anode, cathode, and electrolyte materials. read less NOT USED (low confidence) X. Liu, J. Zhang, and Z. Pei, “Machine Learning for High-entropy Alloys: Progress, Challenges and Opportunities,” Progress in Materials Science. 2022. link Times cited: 41 NOT USED (low confidence) J. Chen, J. Zhang, Z. Wang, X. Han, and Y. Zhang, “Self-adaptable Materials Structure Descriptor based on Graph Attention Network for Machine Learning,” Materials & Design. 2022. link Times cited: 1 NOT USED (low confidence) D. Aksoy et al., “Chemical order transitions within extended interfacial segregation zones in NbMoTaW,” Journal of Applied Physics. 2022. link Times cited: 2 Abstract: Interfacial segregation and chemical short-range ordering in… read moreAbstract: Interfacial segregation and chemical short-range ordering influence the behavior of grain boundaries in complex concentrated alloys. In this study, we use atomistic modeling of a NbMoTaW refractory complex concentrated alloy to provide insight into the interplay between these two phenomena. Hybrid Monte Carlo and molecular dynamics simulations are performed on columnar grain models to identify equilibrium grain boundary structures. Our results reveal extended near-boundary segregation zones that are much larger than traditional segregation regions, which also exhibit chemical patterning that bridges the interfacial and grain interior regions. Furthermore, structural transitions pertaining to an A2-to-B2 transformation are observed within these extended segregation zones. Both grain size and temperature are found to significantly alter the widths of these regions. An analysis of chemical short-range order indicates that not all pairwise elemental interactions are affected by the presence of a grain boundary equally, as only a subset of elemental clustering types are more likely to reside near certain boundaries. The results emphasize the increased chemical complexity that is associated with near-boundary segregation zones and demonstrate the unique nature of interfacial segregation in complex concentrated alloys. read less NOT USED (low confidence) M. Domina, U. Patil, M. Cobelli, and S. Sanvito, “Cluster expansion constructed over Jacobi-Legendre polynomials for accurate force fields,” Physical Review B. 2022. link Times cited: 2 Abstract: We introduce a compact cluster expansion method, constructed… read moreAbstract: We introduce a compact cluster expansion method, constructed over Jacobi and Legendre polynomials, to generate highly accurate and flexible machine-learning force fields. The constituent many-body contributions are separated, interpretable and adaptable to replicate the physical knowledge of the system. In fact, the flexibility introduced by the use of the Jacobi polynomials allows us to impose, in a natural way, constrains and symmetries to the cluster expansion. This has the effect of reducing the number of parameters needed for the fit and of enforcing desired behaviours of the potential. For instance, we show that our Jacobi-Legendre cluster expansion can be designed to generate potentials with a repulsive tail at short inter-atomic distances, without the need of imposing any external function. Our method is here continuously compared with available machine-learning potential schemes, such as the atomic cluster expansion and potentials built over the bispectrum. As an example we construct a Jacobi-Legendre potential for carbon, by training a slim and accurate model capable of describing crystalline graphite and diamond, as well as liquid and amorphous elemental carbon. read less NOT USED (low confidence) J. Gil and T. Oda, “Accurate and Efficient Calculation of the Solution Enthalpy and Diffusivity of Solutes in Liquid Metals Using Machine Learning Potential.,” Journal of chemical theory and computation. 2022. link Times cited: 0 Abstract: Liquid metals (LMs) have various applications in energy syst… read moreAbstract: Liquid metals (LMs) have various applications in energy systems, such as coolants in advanced nuclear reactors. In addition, room-temperature LMs are attracting attention as flexible components in robotics and electronics and as novel chemical reaction media to form low-dimensional materials. In many of these applications, the capabilities of LMs can be further enhanced if one can better understand and control the chemical reactivity of LMs, which is largely affected by the stability and mobility of solutes in LMs. Here, we propose an automated method using a machine learning moment tensor potential to efficiently calculate the solution enthalpy and diffusivity of solutes in LMs. From several test cases in liquid Na, we demonstrate that the method can achieve an accuracy comparable to that of a direct calculation using first-principles molecular dynamics, while significantly reducing the calculation cost to the order of 1/10 to 1/100. The method is expected to contribute to the advancement of LM chemistry and the development of new LMs. read less NOT USED (low confidence) A. Hegde, E. Weiss, W. Windl, H. Najm, and C. Safta, “Bayesian calibration of interatomic potentials for binary alloys,” Computational Materials Science. 2022. link Times cited: 1 NOT USED (low confidence) S. Sharma et al., “Machine Learning Methods for Multiscale Physics and Urban Engineering Problems,” Entropy. 2022. link Times cited: 0 Abstract: We present an overview of four challenging research areas in… read moreAbstract: We present an overview of four challenging research areas in multiscale physics and engineering as well as four data science topics that may be developed for addressing these challenges. We focus on multiscale spatiotemporal problems in light of the importance of understanding the accompanying scientific processes and engineering ideas, where “multiscale” refers to concurrent, non-trivial and coupled models over scales separated by orders of magnitude in either space, time, energy, momenta, or any other relevant parameter. Specifically, we consider problems where the data may be obtained at various resolutions; analyzing such data and constructing coupled models led to open research questions in various applications of data science. Numeric studies are reported for one of the data science techniques discussed here for illustration, namely, on approximate Bayesian computations. read less NOT USED (low confidence) D. M. Kuntz and A. Wilson, “Machine learning, artificial intelligence, and chemistry: How smart algorithms are reshaping simulation and the laboratory,” Pure and Applied Chemistry. 2022. link Times cited: 6 Abstract: Machine learning and artificial intelligence are increasingl… read moreAbstract: Machine learning and artificial intelligence are increasingly gaining in prominence through image analysis, language processing, and automation, to name a few applications. Machine learning is also making profound changes in chemistry. From revisiting decades-old analytical techniques for the purpose of creating better calibration curves, to assisting and accelerating traditional in silico simulations, to automating entire scientific workflows, to being used as an approach to deduce underlying physics of unexplained chemical phenomena, machine learning and artificial intelligence are reshaping chemistry, accelerating scientific discovery, and yielding new insights. This review provides an overview of machine learning and artificial intelligence from a chemist’s perspective and focuses on a number of examples of the use of these approaches in computational chemistry and in the laboratory. read less NOT USED (low confidence) M. Cioni, D. Polino, D. Rapetti, L. Pesce, M. D. Piane, and G. Pavan, “Innate dynamics and identity crisis of a metal surface unveiled by machine learning of atomic environments.,” The Journal of chemical physics. 2022. link Times cited: 5 Abstract: Metals are traditionally considered hard matter. However, it… read moreAbstract: Metals are traditionally considered hard matter. However, it is well known that their atomic lattices may become dynamic and undergo reconfigurations even well below the melting temperature. The innate atomic dynamics of metals is directly related to their bulk and surface properties. Understanding their complex structural dynamics is, thus, important for many applications but is not easy. Here, we report deep-potential molecular dynamics simulations allowing to resolve at an atomic resolution the complex dynamics of various types of copper (Cu) surfaces, used as an example, near the Hüttig (∼1/3 of melting) temperature. The development of deep neural network potential trained on density functional theory calculations provides a dynamically accurate force field that we use to simulate large atomistic models of different Cu surface types. A combination of high-dimensional structural descriptors and unsupervized machine learning allows identifying and tracking all the atomic environments (AEs) emerging in the surfaces at finite temperatures. We can directly observe how AEs that are non-native in a specific (ideal) surface, but that are, instead, typical of other surface types, continuously emerge/disappear in that surface in relevant regimes in dynamic equilibrium with the native ones. Our analyses allow estimating the lifetime of all the AEs populating these Cu surfaces and to reconstruct their dynamic interconversions networks. This reveals the elusive identity of these metal surfaces, which preserve their identity only in part and in part transform into something else under relevant conditions. This also proposes a concept of "statistical identity" for metal surfaces, which is key to understanding their behaviors and properties. read less NOT USED (low confidence) P. A. Santos-Flórez et al., “Short-range order and its impacts on the BCC MoNbTaW multi-principal element alloy by the machine-learning potential,” Acta Materialia. 2022. link Times cited: 1 NOT USED (low confidence) S. Chowdhury, S. Ghosal, D. Mondal, and D. Jana, “First-principles and machine-learning study of electronic and phonon transport in carbon-based AA-stacked bilayer biphenylene nanosheets,” Journal of Physics and Chemistry of Solids. 2022. link Times cited: 5 NOT USED (low confidence) H. Yin, “A Simplified Continuum Particle Model Bridging Interatomic Potentials and Elasticity of Solids,” Journal of Engineering Mechanics. 2022. link Times cited: 3 NOT USED (low confidence) A. Mirzoev, B. Gelchinski, and A. A. Rempel, “Neural Network Prediction of Interatomic Interaction in Multielement Substances and High-Entropy Alloys: A Review,” Doklady Physical Chemistry. 2022. link Times cited: 2 NOT USED (low confidence) Y. Gao, T. P. Mishra, S. H. Bo, G. Gautam, and P. Canepa, “Design and Characterization of Host Frameworks for Facile Magnesium Transport,” Annual Review of Materials Research. 2022. link Times cited: 9 Abstract: The development of inexpensive batteries based on magnesium … read moreAbstract: The development of inexpensive batteries based on magnesium (Mg) chemistry will contribute remarkably toward developing high-energy-density storage systems that can be used worldwide. Significant challenges remain in developing practical Mg batteries, the chief of which is designing materials that can provide facile transport of Mg. In this review, we cover the experimental and theoretical methods that can be used to quantify Mg mobility in a variety of host frameworks, the specific transport quantities that each technique is designed to measure or calculate, and some practical examples of their applications. We then list the unique challenges faced by different experimental and computational techniques in probing Mg ion transport in materials. This review concludes with an outlook on the directions that the scientific community could soon pursue as we strive to construct a pragmatic Mg battery. Expected final online publication date for the Annual Review of Materials Research, Volume 52 is July 2022. Please see http://www.annualreviews.org/page/journal/pubdates for revised estimates. read less NOT USED (low confidence) Z. Xu and Y. Xia, “Progress, challenges and perspectives of computational studies on glassy superionic conductors for solid-state batteries,” Journal of Materials Chemistry A. 2022. link Times cited: 2 Abstract: Sulfide-based glasses and glass-ceramics showing high ionic … read moreAbstract: Sulfide-based glasses and glass-ceramics showing high ionic conductivities and excellent mechanical properties are considered as promising solid-state electrolytes. Nowadays, the computational material techniques with the advantage of low research cost... read less NOT USED (low confidence) A. Sergeev, A. A. Rulev, Y. O. Kondratyeva, and L. Yashina, “Computational insight into the grain boundary structure and atomic mobility in metallic lithium,” Acta Materialia. 2022. link Times cited: 3 NOT USED (low confidence) D. Morgan, G. Pilania, A. Couet, B. Uberuaga, C. Sun, and J. Li, “Machine learning in nuclear materials research,” Current Opinion in Solid State and Materials Science. 2022. link Times cited: 32 NOT USED (low confidence) P. P. Poier, T. J. Inizan, O. Adjoua, L. Lagardère, and J. P. Piquemal, “Accurate Deep Learning-Aided Density-Free Strategy for Many-Body Dispersion-Corrected Density Functional Theory.,” The journal of physical chemistry letters. 2022. link Times cited: 7 Abstract: Using a deep neuronal network (DNN) model trained on the lar… read moreAbstract: Using a deep neuronal network (DNN) model trained on the large ANI-1 data set of small organic molecules, we propose a transferable density-free many-body dispersion (DNN-MBD) model. The DNN strategy bypasses the explicit Hirshfeld partitioning of the Kohn-Sham electron density required by MBD models to obtain the atom-in-molecules volumes used by the Tkatchenko-Scheffler polarizability rescaling. The resulting DNN-MBD model is trained with minimal basis iterative Stockholder atomic volumes and, coupled to density functional theory (DFT), exhibits comparable (if not greater) accuracy to other approaches based on different partitioning schemes. Implemented in the Tinker-HP package, the DNN-MBD model decreases the overall computational cost compared to MBD models where the explicit density partitioning is performed. Its coupling with the recently introduced Stochastic formulation of the MBD equations (J. Chem. Theory Comput. 2022, 18 (3), 1633-1645) enables large routine dispersion-corrected DFT calculations at preserved accuracy. Furthermore, the DNN electron density-free features extend the MBD model's applicability beyond electronic structure theory within methodologies such as force fields and neural networks. read less NOT USED (low confidence) V. Sharma and D. Datta, “Developing Potential Energy Surfaces for Graphene-based 2D-3D Interfaces from Modified High Dimensional Neural Networks for Applications in Energy Storage,” Journal of Electrochemical Energy Conversion and Storage. 2022. link Times cited: 3 Abstract:
Designing a new heterostructure electrode has many challen… read moreAbstract:
Designing a new heterostructure electrode has many challenges associated with interface engineering. Demanding simulation resources and lack of heterostructure databases continue to be a barrier to understanding the chemistry and mechanics of complex interfaces using simulations. Mixed-dimensional heterostructures composed of two-dimensional (2D) and three-dimensional (3D) materials are undisputed next-generation materials for engineered devices due to their changeable properties. The present work computationally investigates the interface between 2D graphene and 3D tin (Sn) systems with density functional theory (DFT) method. It uses computationally demanding simulation data to develop machine learning (ML) based potential energy surfaces (PES). The approach to developing PES for complex interface systems in the light of limited data and transferability of such models has been discussed. To develop PES for graphene-tin interface systems, high dimensional neural networks (HDNN) are used that rely on atom-centered symmetry function to represent structural information. HDNN are modified to train on the total energies of the interface system rather than atomic energies. The performance of modified HDNN trained on 5789 interface structures of graphene|Sn is tested on new interfaces of the same material pair with varying levels of structural deviations from the training dataset. Root mean squared error (RMSE) for test interfaces fall in the range of 0.01 – 0.45 eV/atom, depending on the structural deviations from the reference training dataset. By avoiding incorrect decomposition of total energy into atomic energies, modified HDNN model is shown to obtain higher accuracy and transferability despite limited dataset. Improved accuracy in ML-based modeling approach promises cost-effective means of designing interfaces in heterostructure energy storage systems with higher cycle life and stability. read less NOT USED (low confidence) Y. Ouyang, C. Yu, J. He, P. Jiang, W. Ren, and J. Chen, “Accurate description of high-order phonon anharmonicity and lattice thermal conductivity from molecular dynamics simulations with machine learning potential,” Physical Review B. 2022. link Times cited: 15 NOT USED (low confidence) T. Wen, L. Zhang, H. Wang, W. E, and D. Srolovitz, “Deep Potentials for Materials Science,” Materials Futures. 2022. link Times cited: 54 Abstract:
To fill the gap between accurate (and expensive) ab initio… read moreAbstract:
To fill the gap between accurate (and expensive) ab initio calculations and efficient atomistic simulations based on empirical interatomic potentials, a new class of descriptions of atomic interactions has emerged and been widely applied; i.e., machine learning potentials (MLPs). One recently developed type of MLP is the Deep Potential (DP) method. In this review, we provide an introduction to DP methods in computational materials science. The theory underlying the DP method is presented along with a step-by-step introduction to their development and use. We also review materials applications of DPs in a wide range of materials systems. The DP Library provides a platform for the development of DPs and a database of extant DPs. We discuss the accuracy and efficiency of DPs compared with ab initio methods and empirical potentials. read less NOT USED (low confidence) T. Feng, B. Yang, and G. Lu, “Investigation on the local structure and properties of molten Li2CO3-K2CO3 binary salts by machine learning potentials,” Journal of Molecular Liquids. 2022. link Times cited: 6 NOT USED (low confidence) C. León and R. Melnik, “Machine Learning for Shape Memory Graphene Nanoribbons and Applications in Biomedical Engineering,” Bioengineering. 2022. link Times cited: 3 Abstract: Shape memory materials have been playing an important role i… read moreAbstract: Shape memory materials have been playing an important role in a wide range of bioengineering applications. At the same time, recent developments of graphene-based nanostructures, such as nanoribbons, have demonstrated that, due to the unique properties of graphene, they can manifest superior electronic, thermal, mechanical, and optical characteristics ideally suited for their potential usage for the next generation of diagnostic devices, drug delivery systems, and other biomedical applications. One of the most intriguing parts of these new developments lies in the fact that certain types of such graphene nanoribbons can exhibit shape memory effects. In this paper, we apply machine learning tools to build an interatomic potential from DFT calculations for highly ordered graphene oxide nanoribbons, a material that had demonstrated shape memory effects with a recovery strain up to 14.5% for 2D layers. The graphene oxide layer can shrink to a metastable phase with lower constant lattice through the application of an electric field, and returns to the initial phase through an external mechanical force. The deformation leads to an electronic rearrangement and induces magnetization around the oxygen atoms. DFT calculations show no magnetization for sufficiently narrow nanoribbons, while the machine learning model can predict the suppression of the metastable phase for the same narrower nanoribbons. We can improve the prediction accuracy by analyzing only the evolution of the metastable phase, where no magnetization is found according to DFT calculations. The model developed here allows also us to study the evolution of the phases for wider nanoribbons, that would be computationally inaccessible through a pure DFT approach. Moreover, we extend our analysis to realistic systems that include vacancies and boron or nitrogen impurities at the oxygen atomic positions. Finally, we provide a brief overview of the current and potential applications of the materials exhibiting shape memory effects in bioengineering and biomedical fields, focusing on data-driven approaches with machine learning interatomic potentials. read less NOT USED (low confidence) M. Ha, A. Hajibabaei, S. Pourasad, and K. S. Kim, “Sparse Gaussian Process Regression-Based Machine Learned First-Principles Force-Fields for Saturated, Olefinic, and Aromatic Hydrocarbons,” ACS Physical Chemistry Au. 2022. link Times cited: 4 Abstract: Universal machine learning (ML) interatomic potentials (IAPs… read moreAbstract: Universal machine learning (ML) interatomic potentials (IAPs) for saturated, olefinic, and aromatic hydrocarbons are generated by using the Sparse Gaussian process regression algorithm. The universal potentials are obtained by combining the potentials for the previously trained alkane/polyene systems and the potentials generated with the presently trained cyclic/aromatic hydrocarbon systems, along with the newly trained cross-terms between the two systems. The ML-IAPs have been trained using the PBE + D3 level of density functional theory for the on-the-fly adaptive sampling of various hydrocarbon molecules and these clusters composed of small molecules. We tested the ML-IAPs and found that they correctly predicted the structures and energies of the β-carotene monomer and dimer. Also, the simulations of liquid ethylene reproduced the molecular volume and the simulations of toluene crystals reproduced higher stability of the α-phase over the β-phase. These ab initio-level force-fields could eventually evolve toward universal organic/polymeric/biomolecular systems. read less NOT USED (low confidence) Q. Chu, K. Luo, and D. Chen, “Exploring Complex Reaction Networks Using Neural Network-Based Molecular Dynamics Simulation.,” The journal of physical chemistry letters. 2022. link Times cited: 8 Abstract: Ab initio molecular dynamics (AIMD) is an established method… read moreAbstract: Ab initio molecular dynamics (AIMD) is an established method for revealing the reactive dynamics of complex systems. However, the high computational cost of AIMD restricts the explorable length and time scales. Here, we develop a fundamentally different approach using molecular dynamics simulations powered by a neural network potential to investigate complex reaction networks. This potential is trained via a workflow combining AIMD and interactive molecular dynamics in virtual reality to accelerate the sampling of rare reactive processes. A panoramic visualization of the complex reaction networks for decomposition of a novel high explosive (ICM-102) is achieved without any predefined reaction coordinates. The study leads to the discovery of new pathways that would be difficult to uncover if established methods were employed. These results highlight the power of neural network-based molecular dynamics simulations in exploring complex reaction mechanisms under extreme conditions at the ab initio level, pushing the limit of theoretical and computational chemistry toward the realism and fidelity of experiments. read less NOT USED (low confidence) C. Chen and S. Ong, “A universal graph deep learning interatomic potential for the periodic table,” Nature Computational Science. 2022. link Times cited: 98 NOT USED (low confidence) B. W. J. Chen, B. Wang, M. Sullivan, A. Borgna, and J. Zhang, “Unraveling the Synergistic Effect of Re and Cs Promoters on Ethylene Epoxidation over Silver Catalysts with Machine Learning-Accelerated First-Principles Simulations,” ACS Catalysis. 2022. link Times cited: 5 NOT USED (low confidence) S. Nikolov, J. Tranchida, K. Ramakrishna, M. Lokamani, A. Cangi, and M. A. Wood, “Dissociating the phononic, magnetic and electronic contributions to thermal conductivity: a computational study in alpha-iron,” Journal of Materials Science. 2022. link Times cited: 7 NOT USED (low confidence) Q. Chu, C. Wang, and D. Chen, “Towards fully ab initio modeling of soot formation in a nanoreactor,” SSRN Electronic Journal. 2022. link Times cited: 4 Abstract: A neural network (NN)-based model is proposed to construct t… read moreAbstract: A neural network (NN)-based model is proposed to construct the potential energy surface of soot formation. Our NN-based model is proven to possess good scalability of O(N) and retain the ab initio accuracy, which allows the investigation of the entire evolution of soot particles with tens of nm from an atomic perspective. A series of NN-based molecular dynamics (NNMD) simulations are performed using a nanoreactor scheme to investigate critical processes in soot formation, acetylene polymerization, and inception of PAH radicals. This shows that NNMD can capture the dynamic process of acetylene polymerization into PAH precursors. The simulation of PAH radicals reveals that physical interaction enhances chemical nucleation, and such enhancement is observed for clusters of π- and σ-radicals, which is distinct from the dimer. We also observed that PAH radicals of ~ 400 Da can produce core-shell soot particles at a flame temperature, with a disordered core and outer shell of stacked PAHs, suggesting a potential physically stabilized soot inception mechanism. read less NOT USED (low confidence) Z. Wei, C. Zhang, Y. Kan, Y. Zhang, and Y. Chen, “Developing machine learning potential for classical molecular dynamics simulation with superior phonon properties,” Computational Materials Science. 2022. link Times cited: 1 NOT USED (low confidence) Y. Wang et al., “Machine-learning interatomic potential for radiation damage effects in bcc-iron,” Computational Materials Science. 2022. link Times cited: 7 NOT USED (low confidence) C. Zhang, L. Tang, Y. Sun, K. Ho, R. Wentzcovitch, and C. Wang, “Deep machine learning potential for atomistic simulation of Fe-Si-O systems under Earth’s outer core conditions,” Physical Review Materials. 2022. link Times cited: 4 Abstract: Using artificial neural-network machine learning (ANN-ML) to… read moreAbstract: Using artificial neural-network machine learning (ANN-ML) to generate interatomic potentials has been demonstrated to be a promising approach to address the long-standing challenge of accuracy versus efficiency in molecular dynamics (MD) simulations. Here, taking the Fe-Si-O system as a prototype, we show that accurate and transferable ANN-ML potentials can be developed for reliable MD simulations of materials at high-pressure and high-temperature conditions of the Earth's outer core. The ANN-ML potential for Fe-Si-O system is trained by fitting to the energies and forces of related binaries and ternary liquid structures at high pressures and temperatures obtained by first-principles calculations based on density functional theory (DFT). We show that the generated ANN-ML potential describes well the structure and dynamics of liquid phases of this complex system. The efficient ANN-ML potential with DFT accuracy provides a promising scheme for accurate atomistic simulations of structures and dynamics of complex Fe-Si-O system in the Earth's outer core. read less NOT USED (low confidence) E. Podryabinkin et al., “Nanohardness from First Principles with Active Learning on Atomic Environments.,” Journal of chemical theory and computation. 2022. link Times cited: 10 Abstract: We propose a methodology for the calculation of nanohardness… read moreAbstract: We propose a methodology for the calculation of nanohardness by atomistic simulations of nanoindentation. The methodology is enabled by machine-learning interatomic potentials fitted on the fly to quantum-mechanical calculations of local fragments of the large nanoindentation simulation. We test our methodology by calculating nanohardness, as a function of load and crystallographic orientation of the surface, of diamond, AlN, SiC, BC2N, and Si and comparing it to the calibrated values of the macro- and microhardness. The observed agreement between the computational and experimental results from the literature provides evidence that our method has sufficient predictive power to open up the possibility of designing materials with exceptional hardness directly from first principles. It will be especially valuable at the nanoscale where the experimental measurements are difficult, while empirical models fitted to macrohardness are, as a rule, inapplicable. read less NOT USED (low confidence) E. Andritsos and K. Rossi, “Accelerating the theoretical study of Li‐polysulfide adsorption on single‐atom catalysts via machine learning approaches,” International Journal of Quantum Chemistry. 2021. link Times cited: 0 Abstract: Li–S batteries are a promising alternative to Li‐ion batteri… read moreAbstract: Li–S batteries are a promising alternative to Li‐ion batteries, offering large energy storage capacity and wide operating temperature range. However, their performance is heavily affected by the Li‐polysulfide (LiPS) shuttling. Computational screening of LiPS adsorption on single‐atom catalyst (SAC) substrates is of great aid to the design of Li–S batteries which are robust against the LiPS shuttling from the cathode to the anode and the electrolyte. To facilitate this process, we develop a machine learning (ML) protocol to accelerate the systematic mapping of dominant local energy minima found with calculations based on the density functional theory (DFT), and, in turn, fast screening of LiPS adsorption properties on SACs. We first validate the approach by probing the potential energy surface for LiPS adsorbed on graphene decorated with a Fe–N4–C SAC. We identify minima whose binding energies are better or on par with the one previously reported in the literature. We then move to analyze the adsorption trends on Zn–N4–C SAC and observe similar adsorption strength and behavior with the Fe–N4–C SAC, highlighting the good predictive power of our protocol. Our approach offers a comprehensive and computationally efficient alternative to conventional approaches studying LiPS adsorption. read less NOT USED (low confidence) Y. Kurniawan et al., “Bayesian, frequentist, and information geometric approaches to parametric uncertainty quantification of classical empirical interatomic potentials.,” The Journal of chemical physics. 2021. link Times cited: 6 Abstract: In this paper, we consider the problem of quantifying parame… read moreAbstract: In this paper, we consider the problem of quantifying parametric uncertainty in classical empirical interatomic potentials (IPs) using both Bayesian (Markov Chain Monte Carlo) and frequentist (profile likelihood) methods. We interface these tools with the Open Knowledgebase of Interatomic Models and study three models based on the Lennard-Jones, Morse, and Stillinger-Weber potentials. We confirm that IPs are typically sloppy, i.e., insensitive to coordinated changes in some parameter combinations. Because the inverse problem in such models is ill-conditioned, parameters are unidentifiable. This presents challenges for traditional statistical methods, as we demonstrate and interpret within both Bayesian and frequentist frameworks. We use information geometry to illuminate the underlying cause of this phenomenon and show that IPs have global properties similar to those of sloppy models from fields, such as systems biology, power systems, and critical phenomena. IPs correspond to bounded manifolds with a hierarchy of widths, leading to low effective dimensionality in the model. We show how information geometry can motivate new, natural parameterizations that improve the stability and interpretation of uncertainty quantification analysis and further suggest simplified, less-sloppy models. read less NOT USED (low confidence) S. Arabha, Z. S. Aghbolagh, K. Ghorbani, S. M. Hatam-Lee, and A. Rajabpour, “Recent advances in lattice thermal conductivity calculation using machine-learning interatomic potentials,” Journal of Applied Physics. 2021. link Times cited: 17 NOT USED (low confidence) O. Tayfuroglu, A. Kocak, and Y. Zorlu, “Development and Application of a Single Neural Network Potential for IRMOF-n (n=1,4,6,7,10).” 2021. link Times cited: 0 Abstract: Metal‑organic frameworks (MOFs) with their exceptional porou… read moreAbstract: Metal‑organic frameworks (MOFs) with their exceptional porous and organized structures have been subject of numerous applications. Predicting macroscopic properties from atomistic simulations require the most accurate force fields, which is still a major problem due to MOFs’ hybrid structures governed by covalent, ionic and dispersion forces. Application of ab‑initio molecular dynamics to such large periodic systems are thus beyond the current computational power. Therefore, alternative strategies must be developed to reduce computational cost without losing reliability. In this work, we describe the construction of a neural network potential (NNP) for IRMOF‑n series (n=1,4,7,10) trained by PBE-D4/def2-TZVP reference data of MOF fragments. We validated the resulting NNP on both fragments and bulk MOF structures by prediction of properties such as equilibrium lattice constants, phonon density of states and linker orientation. The energy and force RMSE values for the fragments are only 0.0017 eV/atom and 0.15 eV/Å, respectively. The NNP predicted equilibrium lattice constants of bulk structures, which are not included in training, are off by only 0.2-2.4% from experimental results. Moreover, our fragment trained NNP greatly predicts phenylene ring torsional energy barrier, equilibrium bond distances and vibrational density of states of bulk MOFs. Furthermore, NNP allows us to investigate unusual behaviors of selected MOFs such as the thermal expansion properties and the effect of mechanical strain on the adsorption of hydrogen and methane molecules. The NNP based molecular dynamics (MD) simulations suggest the IRMOF‑4 and IRMOF‑7 to have positive‑to‑negative thermal expansion coefficients while the rest to have only negative thermal expansion under the studied temperatures of 200 K to 400 K. The deformation of bulk structure by reduction of unit cell volume has shown to increase volumetric methane uptake in IRMOF‑1 but decrease in IRMOF‑7 due to the steric hindrance. read less NOT USED (low confidence) S. Manna, Y. Wang, A. Hernandez, P. Lile, S. Liu, and T. Mueller, “A database of low-energy atomically precise nanoclusters,” Scientific Data. 2021. link Times cited: 9 NOT USED (low confidence) J. A. Vita and D. Trinkle, “Exploring the necessary complexity of interatomic potentials,” Computational Materials Science. 2021. link Times cited: 8 NOT USED (low confidence) G. G. Varenikov, I. Novoselov, and E. Meshkov, “Novel method for automatic search for stable ordered phases in multicomponent systems,” Computational Materials Science. 2021. link Times cited: 2 NOT USED (low confidence) N. S. Mondal, S. Nath, S. Chowdhury, and D. Jana, “Electric field-induced electronic-thermoelectric-optical properties of typical isoelectronic HNC6 monolayers: a theoretical study,” Applied Surface Science. 2021. link Times cited: 2 NOT USED (low confidence) S. Ghosal, S. Chowdhury, and D. Jana, “Impressive Thermoelectric Figure of Merit in Two-Dimensional Tetragonal Pnictogens: a Combined First-Principles and Machine-Learning Approach.,” ACS applied materials & interfaces. 2021. link Times cited: 21 Abstract: Over the past decade, two-dimensional materials have gained … read moreAbstract: Over the past decade, two-dimensional materials have gained a lot of interest due to their fascinating applications in the field of thermoelectricity. In this study, tetragonal monolayers of group-V elements (T-P, T-As, T-Sb, and T-Bi) are systematically analyzed in the framework of density functional theory in combination with the machine-learning approach. The phonon spectra, as well as the strain profile, dictate that these tetragonal structures are geometrically stable as well as they are potential candidates for experimental synthesis. Electronic analysis suggests that tetragonal pnictogens offer a band gap in the semiconducting regime. Thermal transport characteristics are investigated by solving the semiclassical Boltzmann transport equation. Exceptionally low lattice thermal conductivity has been observed as the atomic number increases in the group. The high Seebeck coefficient and electrical conductivity as well as the low thermal conductivity of T-As, T-Sb, and T-Bi lead to the generation of a very high thermoelectric figure of merit as compared to standard thermoelectric materials. Furthermore, the thermoelectric conversion efficiency of these materials has been observed to be much higher, which ensures their implications in thermoelectric device engineering. read less NOT USED (low confidence) J. D. Morrow and V. L. Deringer, “Indirect learning and physically guided validation of interatomic potential models.,” The Journal of chemical physics. 2021. link Times cited: 3 Abstract: Machine learning (ML) based interatomic potentials are emerg… read moreAbstract: Machine learning (ML) based interatomic potentials are emerging tools for material simulations, but require a trade-off between accuracy and speed. Here, we show how one can use one ML potential model to train another: we use an accurate, but more computationally expensive model to generate reference data (locations and labels) for a series of much faster potentials. Without the need for quantum-mechanical reference computations at the secondary stage, extensive reference datasets can be easily generated, and we find that this improves the quality of fast potentials with less flexible functional forms. We apply the technique to disordered silicon, including a simulation of vitrification and polycrystalline grain formation under pressure with a system size of a million atoms. Our work provides conceptual insight into the ML of interatomic potential models and suggests a route toward accelerated simulations of condensed-phase systems. read less NOT USED (low confidence) K. Nguyen-Cong et al., “Billion atom molecular dynamics simulations of carbon at extreme conditions and experimental time and length scales,” SC21: International Conference for High Performance Computing, Networking, Storage and Analysis. 2021. link Times cited: 23 Abstract: Billion atom molecular dynamics (MD) using quantum-accurate … read moreAbstract: Billion atom molecular dynamics (MD) using quantum-accurate machine-learning Spectral Neighbor Analysis Potential (SNAP) observed long-sought high pressure BC8 phase of carbon at extreme pressure (12 Mbar) and temperature (5,000 K). 24-hour, 4650 node production simulation on OLCF Summit demonstrated an unprecedented scaling and unmatched real-world performance of SNAP MD while sampling 1 nanosecond of physical time. Efficient implementation of SNAP force kernel in LAMMPS using the Kokkos CUDA backend on NVIDIA GPUs combined with excellent strong scaling (better than 97% parallel efficiency) enabled a peak computing rate of 50.0 PFLOPs (24.9% of theoretical peak) for a 20 billion atom MD simulation on the full Summit machine (27,900 GPUs). The peak MD performance of 6.21 Matom-steps/node-s is 22.9 times greater than a previous record for quantum-accurate MD. Near perfect weak scaling of SNAP MD highlights its excellent potential to advance the frontier of quantum-accurate MD to trillion atom simulations on upcoming exascale platforms. KEYWORDS molecular dynamics, machine-learning interatomic potentials, car-bon, extreme conditions read less NOT USED (low confidence) A. Hamedani et al., “Primary radiation damage in silicon from the viewpoint of a machine learning interatomic potential,” Physical Review Materials. 2021. link Times cited: 6 NOT USED (low confidence) B. Javvaji, B. Mortazavi, X. Zhuang, and T. Rabczuk, “Exploring tensile piezoelectricity and bending flexoelectricity of diamane monolayers by machine learning,” Carbon. 2021. link Times cited: 10 NOT USED (low confidence) R. Romero, S. Xu, W. Jian, I. Beyerlein, and C. Ramana, “Atomistic simulations of the local slip resistances in four refractory multi-principal element alloys,” International Journal of Plasticity. 2021. link Times cited: 23 NOT USED (low confidence) S. Ono and D. Kobayashi, “Stability of B2 compounds: Role of the M point phonons.” 2021. link Times cited: 0 Abstract:
Although many binary compounds have the B2 (CsCl-type) str… read moreAbstract:
Although many binary compounds have the B2 (CsCl-type) structure in the thermodynamic phase diagram, an origin of the structural stability is not understood well. Here, we focus on 416 compounds in the B2 structure extracted from the Materials Project, and study the dynamical stability of those compounds from first principles. We demonstrate that the B2 phase stability lies in whether the lowest frequency phonon at the M point in the Brillouin zone is endowed with a positive frequency. We show that the interatomic interactions up to the fourth nearest neighbor atoms are necessary for stabilizing such phonon modes, which should determine the minimum cutoff radius for constructing the interatomic potentials of binary compounds with guaranteed accuracy. read less NOT USED (low confidence) D. Yilmaz, W. Woodward, and A. V. van Duin, “Machine Learning-Assisted Hybrid ReaxFF Simulations.,” Journal of chemical theory and computation. 2021. link Times cited: 5 Abstract: We have developed a machine learning (ML)-assisted Hybrid Re… read moreAbstract: We have developed a machine learning (ML)-assisted Hybrid ReaxFF simulation method ("Hybrid/Reax"), which alternates reactive and non-reactive molecular dynamics simulations with the assistance of ML models to simulate phenomena that require longer time scales and/or larger systems than are typically accessible to ReaxFF. Hybrid/Reax uses a specialized tracking tool during the reactive simulations to further accelerate chemical reactions. Non-reactive simulations are used to equilibrate the system after the reactive simulation stage. ML models are used between reactive and non-reactive stages to predict non-reactive force field parameters of the system based on the updated bond topology. Hybrid/Reax simulation cycles can be continued until the desired chemical reactions are observed. As a case study, this method was used to study the cross-linking of a polyethylene (PE) matrix analogue (decane) with the cross-linking agent dicumyl peroxide (DCP). We were able to run relatively long simulations [>20 million molecular dynamics (MD) steps] on a small test system (4660 atoms) to simulate cross-linking reactions of PE in the presence of DCP. Starting with 80 PE molecules, more than half of them cross-linked by the end of the Hybrid/Reax cycles on a single Xeon processor in under 48 h. This simulation would take approximately 1 month if run with pure ReaxFF MD on the same machine. read less NOT USED (low confidence) Y. Guan et al., “Machine Learning in Solid Heterogeneous Catalysis: Recent Developments, Challenges and Perspectives,” Chemical Engineering Science. 2021. link Times cited: 35 NOT USED (low confidence) H. Yang, Y. Zhu, E. Dong, Y. Wu, J. Yang, and W. Zhang, “Dual adaptive sampling and machine learning interatomic potentials for modeling materials with chemical bond hierarchy,” Physical Review B. 2021. link Times cited: 4 Abstract: The development of reliable and flexible machine learning ba… read moreAbstract: The development of reliable and flexible machine learning based interatomic potentials (ML-IPs) is becoming increasingly important in studying the physical properties of complex condensed matter systems. Besides the structure descriptor model for total energy decomposition, the trial-and-error approach used in the design of the training dataset makes the ML-IP hardly improvable and reliable for modeling materials with chemical bond hierarchy. In this work, a dual adaptive sampling (DAS) method with an on the fly ambiguity threshold was developed to automatically generate an effective training dataset covering a wide temperature range or a wide spectrum of thermodynamic conditions. The DAS method consists of an inner loop for exploring the local configuration space and an outer loop for covering a wide temperature range. We validated the developed DAS method by simulating thermal transport of complex materials. The simulation results show that even with a substantially small dataset, our approach not only accurately reproduces the energies and forces but also predicts reliably effective high-order force constants to at least fourth order. The lattice thermal conductivity and its temperature dependence were evaluated using the Green-Kubo simulations with ML-IP for $\mathrm{Co}{\mathrm{Sb}}_{3}$ with up to third-order phonon scattering, and those for ${\mathrm{Mg}}_{3}{\mathrm{Sb}}_{2}$ with up to fourth-order phonon scattering, and all show good agreements with experiments. Our work provides an avenue to effectively construct a training dataset for ML-IP of complex materials with chemical bond hierarchy. read less NOT USED (low confidence) L.-Y. Xue et al., “ReaxFF-MPNN machine learning potential: a combination of reactive force field and message passing neural networks.,” Physical chemistry chemical physics : PCCP. 2021. link Times cited: 3 Abstract: Reactive force field (ReaxFF) is a powerful computational to… read moreAbstract: Reactive force field (ReaxFF) is a powerful computational tool for exploring material properties. In this work, we proposed an enhanced reactive force field model, which uses message passing neural networks (MPNN) to compute the bond order and bond energies. MPNN are a variation of graph neural networks (GNN), which are derived from graph theory. In MPNN or GNN, molecular structures are treated as a graph and atoms and chemical bonds are represented by nodes and edges. The edge states correspond to the bond order in ReaxFF and are updated by message functions according to the message passing algorithms. The results are very encouraging; the investigation of the potential, such as the potential energy surface, reaction energies and equation of state, are greatly improved by this simple improvement. The new potential model, called reactive force field with message passing neural networks (ReaxFF-MPNN), is provided as an interface in an atomic simulation environment (ASE) with which the original ReaxFF and ReaxFF-MPNN potential models can do MD simulations and geometry optimizations within the ASE. Furthermore, machine learning, based on an active learning algorithm and gradient optimizer, is designed to train the model. We found that the active learning machine not only saves the manual work to collect the training data but is also much more effective than the general optimizer. read less NOT USED (low confidence) M. K. Kutzhanov et al., “Al/SiC nanocomposites with enhanced thermomechanical properties obtained from microwave plasma-treated nanopowders,” Materials Science and Engineering A-structural Materials Properties Microstructure and Processing. 2021. link Times cited: 12 NOT USED (low confidence) S. Starikov and D. Smirnova, “Optimized interatomic potential for atomistic simulation of Zr-Nb alloy,” Computational Materials Science. 2021. link Times cited: 15 NOT USED (low confidence) A. Thompson et al., “LAMMPS - A flexible simulation tool for particle-based materials modeling at the atomic, meso, and continuum scales,” Computer Physics Communications. 2021. link Times cited: 2377 NOT USED (low confidence) V. L. Deringer, A. Bartók, N. Bernstein, D. Wilkins, M. Ceriotti, and G. Csányi, “Gaussian Process Regression for Materials and Molecules,” Chemical Reviews. 2021. link Times cited: 316 Abstract: We provide an introduction to Gaussian process regression (G… read moreAbstract: We provide an introduction to Gaussian process regression (GPR) machine-learning methods in computational materials science and chemistry. The focus of the present review is on the regression of atomistic properties: in particular, on the construction of interatomic potentials, or force fields, in the Gaussian Approximation Potential (GAP) framework; beyond this, we also discuss the fitting of arbitrary scalar, vectorial, and tensorial quantities. Methodological aspects of reference data generation, representation, and regression, as well as the question of how a data-driven model may be validated, are reviewed and critically discussed. A survey of applications to a variety of research questions in chemistry and materials science illustrates the rapid growth in the field. A vision is outlined for the development of the methodology in the years to come. read less NOT USED (low confidence) L.-K. Shen, Y. Wang, and W.-J. Lai, “Development of a machine learning potential for the study of crack propagation in titanium,” International Journal of Pressure Vessels and Piping. 2021. link Times cited: 3 NOT USED (low confidence) L. Pereira, “Investigating mechanical properties and thermal conductivity of 2D carbon-based materials by computational experiments,” Computational Materials Science. 2021. link Times cited: 9 NOT USED (low confidence) A. Clark et al., “The Middle Science: Traversing Scale In Complex Many-Body Systems,” ACS Central Science. 2021. link Times cited: 10 Abstract: A roadmap is developed that integrates simulation methodolog… read moreAbstract: A roadmap is developed that integrates simulation methodology and data science methods to target new theories that traverse the multiple length- and time-scale features of many-body phenomena. read less NOT USED (low confidence) B. Mortazavi, M. Silani, E. Podryabinkin, T. Rabczuk, X. Zhuang, and A. Shapeev, “First‐Principles Multiscale Modeling of Mechanical Properties in Graphene/Borophene Heterostructures Empowered by Machine‐Learning Interatomic Potentials,” Advanced Materials. 2021. link Times cited: 121 Abstract: Density functional theory calculations are robust tools to e… read moreAbstract: Density functional theory calculations are robust tools to explore the mechanical properties of pristine structures at their ground state but become exceedingly expensive for large systems at finite temperatures. Classical molecular dynamics (CMD) simulations offer the possibility to study larger systems at elevated temperatures, but they require accurate interatomic potentials. Herein the authors propose the concept of first‐principles multiscale modeling of mechanical properties, where ab initio level of accuracy is hierarchically bridged to explore the mechanical/failure response of macroscopic systems. It is demonstrated that machine‐learning interatomic potentials (MLIPs) fitted to ab initio datasets play a pivotal role in achieving this goal. To practically illustrate this novel possibility, the mechanical/failure response of graphene/borophene coplanar heterostructures is examined. It is shown that MLIPs conveniently outperform popular CMD models for graphene and borophene and they can evaluate the mechanical properties of pristine and heterostructure phases at room temperature. Based on the information provided by the MLIP‐based CMD, continuum models of heterostructures using the finite element method can be constructed. The study highlights that MLIPs were the missing block for conducting first‐principles multiscale modeling, and their employment empowers a straightforward route to bridge ab initio level accuracy and flexibility to explore the mechanical/failure response of nanostructures at continuum scale. read less NOT USED (low confidence) G. Hart, T. Mueller, C. Toher, and S. Curtarolo, “Machine learning for alloys,” Nature Reviews Materials. 2021. link Times cited: 169 NOT USED (low confidence) Z. Zhang and J. Brgoch, “Determining Temperature-Dependent Vickers Hardness with Machine Learning.,” The journal of physical chemistry letters. 2021. link Times cited: 11 Abstract: Assessing the hardness of structural materials at elevated t… read moreAbstract: Assessing the hardness of structural materials at elevated temperatures is experimentally and computationally challenging, yet crucial for their success. In this work, a machine-learning method was developed to determine a material's temperature-dependent hardness based on its chemical composition and crystal structure. A total of 593 Vickers hardness data collected at various temperatures were extracted from the literature and used to train an extreme gradient boosting (XGBoost) machine-learning model. Applying a combination of composition descriptors and smooth overlap of atomic positions (SOAP) structural descriptors to represent these materials resulted in outstanding accuracy (R2 = 0.91; MAE = 2.52 GPa). The model's intrinsic variance was also measured by using a bootstrap aggregating (bagging) method, and the subsequent predictions showed strong agreement with the experimental data. The capability of the trained model was finally verified by demonstrating the model's ability to discriminate polymorphs, separate the properties of similar compositions, and reproduce the high-temperature hardness of several classic structural materials. read less NOT USED (low confidence) N. D. Pasquale, J. Elliott, P. Hadjidoukas, and P. Carbone, “Dynamically Polarizable Force Fields for Surface Simulations via Multi-output Classification Neural Networks.,” Journal of chemical theory and computation. 2021. link Times cited: 10 Abstract: We present a general procedure to introduce electronic polar… read moreAbstract: We present a general procedure to introduce electronic polarization into classical Molecular Dynamics (MD) force fields using a Neural Network (NN) model. We apply this framework to the simulation of a solid-liquid interface where the polarization of the surface is essential to correctly capture the main features of the system. By introducing a multi-input, multi-output NN and treating the surface polarization as a discrete classification problem, we are able to obtain very good accuracy in terms of quality of predictions. Through the definition of a custom loss function we are able to impose a physically motivated constraint within the NN itself making this model extremely versatile, especially in the modeling of different surface charge states. The NN is validated considering the redistribution of electronic charge density within a graphene based electrode in contact with an aqueous electrolyte solution, a system highly relevant to the development of next generation low-cost supercapacitors. We compare the performances of our NN/MD model against Quantum Mechanics/Molecular Dynamics simulations where we obtain a most satisfactory agreement. read less NOT USED (low confidence) S. Ghosal, S. Chowdhury, and D. Jana, “Electronic and thermal transport in novel carbon-based bilayer with tetragonal rings: a combined study using first-principles and machine learning approach.,” Physical chemistry chemical physics : PCCP. 2021. link Times cited: 13 Abstract: In this article, the structural, electronic and thermal tran… read moreAbstract: In this article, the structural, electronic and thermal transport characteristics of bilayer tetragonal graphene (TG) are systematically explored with a combination of first-principles calculations and machine-learning interatomic potential approaches. Optimized ground state geometry of the bilayer TG structure is predicted and examined by employing various stability criteria. Electronic bandstructure analysis confirmed that bilayer TG exhibits a metallic band structure similar to the monolayer T-graphene structure. Thermal transport characteristics of the bilayer TG structure are explored by analysing thermal conductivity, the Seebeck coefficient, and electrical conductivity. The electronic part of the thermal conductivity shows linearly increasing behaviour with temperature, however the lattice part exhibits the opposite character. The lattice thermal conductivity part is investigated in terms of the three phonon scattering rates and weighted phase space. On the other hand, the Seebeck coefficient goes through a transition from negative to positive values with increasing temperature. The Wiedemann-Franz law regarding electrical transport of the bilayer TG is verified and confirms the universal Lorentz number. Specific heat of the bilayer TG structure follows the Debye model at low temperature and constant behaviour at high temperature. Moreover, the Debye temperature of the bilayer TG structure is verified by ab initio calculations as well as fitting the specific heat data using the Debye model. read less NOT USED (low confidence) S. Starikov et al., “Angular-dependent interatomic potential for large-scale atomistic simulation of iron: Development and comprehensive comparison with existing interatomic models,” Physical Review Materials. 2021. link Times cited: 16 Abstract: The development of classical interatomic potential for iron … read moreAbstract: The development of classical interatomic potential for iron is a quite demanding task with a long history background. A new interatomic potential for simulation of iron was created with a focus on description of crystal defects properties. In contrast with previous studies, here the potential development was based on force-matching method that requires only ab initio data as reference values. To verify our model, we studied various features of body-centered-cubic iron including the properties of point defects (vacancy and self-interstitial atom), the Peierls energy barrier for dislocations (screw and mix types), and the formation energies of planar defects (surfaces, grain boundaries, and stacking fault). The verification also implies thorough comparison of a potential with 11 other interatomic potentials reported in literature. This potential correctly reproduces the largest number of iron characteristics which ensures its advantage and wider applicability range compared to the other considered classical potentials. Here application of the model is illustrated by estimation of self-diffusion coefficients and the calculation of fcc lattice properties at high temperature. read less NOT USED (low confidence) K. Bang, B. C. Yeo, D. Kim, S. Han, and H. M. Lee, “Accelerated mapping of electronic density of states patterns of metallic nanoparticles via machine-learning,” Scientific Reports. 2021. link Times cited: 0 NOT USED (low confidence) J. Xu, X. Cao, and P. Hu, “Perspective on computational reaction prediction using machine learning methods in heterogeneous catalysis.,” Physical chemistry chemical physics : PCCP. 2021. link Times cited: 24 Abstract: Heterogeneous catalysis plays a significant role in the mode… read moreAbstract: Heterogeneous catalysis plays a significant role in the modern chemical industry. Towards the rational design of novel catalysts, understanding reactions over surfaces is the most essential aspect. Typical industrial catalytic processes such as syngas conversion and methane utilisation can generate a large reaction network comprising thousands of intermediates and reaction pairs. This complexity not only arises from the permutation of transformations between species but also from the extra reaction channels offered by distinct surface sites. Despite the success in investigating surface reactions at the atomic scale, the huge computational expense of ab initio methods hinders the exploration of such complicated reaction networks. With the proliferation of catalysis studies, machine learning as an emerging tool can take advantage of the accumulated reaction data to emulate the output of ab initio methods towards swift reaction prediction. Here, we briefly summarise the conventional workflow of reaction prediction, including reaction network generation, ab initio thermodynamics and microkinetic modelling. An overview of the frequently used regression models in machine learning is presented. As a promising alternative to full ab initio calculations, machine learning interatomic potentials are highlighted. Furthermore, we survey applications assisted by these methods for accelerating reaction prediction, exploring reaction networks, and computational catalyst design. Finally, we envisage future directions in computationally investigating reactions and implementing machine learning algorithms in heterogeneous catalysis. read less NOT USED (low confidence) X. Wang, S. Xu, W. Jian, X.-G. Li, Y. Su, and I. Beyerlein, “Generalized stacking fault energies and Peierls stresses in refractory body-centered cubic metals from machine learning-based interatomic potentials,” Computational Materials Science. 2021. link Times cited: 30 NOT USED (low confidence) L. Boeri et al., “The 2021 room-temperature superconductivity roadmap,” Journal of Physics: Condensed Matter. 2021. link Times cited: 69 Abstract: Designing materials with advanced functionalities is the mai… read moreAbstract: Designing materials with advanced functionalities is the main focus of contemporary solid-state physics and chemistry. Research efforts worldwide are funneled into a few high-end goals, one of the oldest, and most fascinating of which is the search for an ambient temperature superconductor (A-SC). The reason is clear: superconductivity at ambient conditions implies being able to handle, measure and access a single, coherent, macroscopic quantum mechanical state without the limitations associated with cryogenics and pressurization. This would not only open exciting avenues for fundamental research, but also pave the road for a wide range of technological applications, affecting strategic areas such as energy conservation and climate change. In this roadmap we have collected contributions from many of the main actors working on superconductivity, and asked them to share their personal viewpoint on the field. The hope is that this article will serve not only as an instantaneous picture of the status of research, but also as a true roadmap defining the main long-term theoretical and experimental challenges that lie ahead. Interestingly, although the current research in superconductor design is dominated by conventional (phonon-mediated) superconductors, there seems to be a widespread consensus that achieving A-SC may require different pairing mechanisms. In memoriam, to Neil Ashcroft, who inspired us all. read less NOT USED (low confidence) Y. Zuo et al., “Accelerating materials discovery with Bayesian optimization and graph deep learning,” Materials Today. 2021. link Times cited: 49 NOT USED (low confidence) B. Mortazavi, F. Shojaei, X. Zhuang, and L. Pereira, “First-principles investigation of electronic, optical, mechanical and heat transport properties of pentadiamond: A comparison with diamond,” Carbon Trends. 2021. link Times cited: 13 NOT USED (low confidence) D. Hedman, T. Rothe, G. Johansson, F. Sandin, J. Larsson, and Y. Miyamoto, “Impact of training and validation data on the performance of neural network potentials: A case study on carbon using the CA-9 dataset.” 2021. link Times cited: 3 NOT USED (low confidence) Z. Aitken, V. Sorkin, Z. Yu, S. Chen, Z. Wu, and Y.-W. Zhang, “Modified embedded-atom method potentials for the plasticity and fracture behaviors of unary fcc metals,” Physical Review B. 2021. link Times cited: 5 NOT USED (low confidence) G. Sivaraman et al., “Automated Development of Molten Salt Machine Learning Potentials: Application to LiCl.,” The journal of physical chemistry letters. 2021. link Times cited: 24 Abstract: The in silico modeling of molten salts is critical for emerg… read moreAbstract: The in silico modeling of molten salts is critical for emerging "carbon-free" energy applications but is inhibited by the cost of quantum mechanically treating the high polarizabilities of molten salts. Here, we integrate configurational sampling using classical force fields with active learning to automate and accelerate the generation of Gaussian approximation potentials (GAP) for molten salts. This methodology reduces the number of expensive ab initio evaluations required for training set generation to O(100), enabling the facile parametrization of a molten LiCl GAP model that exhibits a 19 000-fold speedup relative to AIMD. The developed molten LiCl GAP model is applied to sample extended spatiotemporal scales, permitting new physical insights into molten LiCl's coordination structure as well as experimentally validated predictions of structures, densities, self-diffusion constants, and ionic conductivities. The developed methodology significantly lowers the barrier to the in silico understanding and design of molten salts across the periodic table. read less NOT USED (low confidence) K. Shimizu and S. Watanabe, “Applications of Interatomic Potentials Using Neural Network in Materials Science,” The Brain & Neural Networks. 2021. link Times cited: 0 Abstract: 概要 ビッグデータや機械学習の活用が注目を浴びているという点について,著者らが専門とする 物性物理学や材料科学の分野も例… read moreAbstract: 概要 ビッグデータや機械学習の活用が注目を浴びているという点について,著者らが専門とする 物性物理学や材料科学の分野も例外ではない.世界各所でデータベース作成の取り組みが加速 しているが,その背景には,密度汎関数理論に基づく第一原理計算によりミクロな物理量を精 度良く予測可能になったことがある.他方,材料中の欠陥やイオンの挙動,表面や界面で起こ る現象,非晶質材料など,多くの興味ある系での第一原理計算には非常に高い計算コストが必 要となる.この計算コストと精度との両立という問題の解決にも機械学習手法の活用が注目さ れている.著者らは,ニューラルネットワークを用いた機械学習によって原子間の相互作用を 第一原理計算と同等の精度で予測できると期待される,高次元ニューラルネットワークポテン シャルという手法を用いた材料研究を進めてきた.本稿では,著者らの応用事例を中心に,こ のニューラルネットワークポテンシャルを用いた材料科学研究について紹介する. read less NOT USED (low confidence) Y. Lysogorskiy et al., “Performant implementation of the atomic cluster expansion (PACE) and application to copper and silicon,” npj Computational Materials. 2021. link Times cited: 84 NOT USED (low confidence) Q. Tong et al., “Machine learning metadynamics simulation of reconstructive phase transition,” Physical Review B. 2021. link Times cited: 5 Abstract: Simulating reconstructive phase transition requires an accur… read moreAbstract: Simulating reconstructive phase transition requires an accurate description of potential energy surface (PES). Density-functional-theory (DFT) based molecular dynamics can achieve the desired accuracy but it is computationally unfeasible for large systems and/or long simulation times. Here we introduce an approach that combines the metadynamics simulation and machine learning representation of PES at the accuracy close to the DFT calculations, but with the computational cost several orders of magnitude less, and scaling with system size approximately linear. The high accuracy of the method is demonstrated in the simulation of pressure-induced $B4\text{\ensuremath{-}}B1$ phase transition in gallium nitride (GaN). The large-scale simulation using a 4096-atom simulation box reveals the phase transition with excellent detail, revealing different simulated transition paths under particular stress conditions. With well-trained machine learning potentials, this method can be easily applied to all types of systems for accurate scalable simulations of solid-solid reconstructive phase transition. read less NOT USED (low confidence) I. Kruglov, A. Yanilkin, Y. Propad, A. Mazitov, P. Rachitskii, and A. R. Oganov, “Crystal structure prediction at finite temperatures,” npj Computational Materials. 2021. link Times cited: 1 NOT USED (low confidence) F. Musil et al., “Efficient implementation of atom-density representations.,” The Journal of chemical physics. 2021. link Times cited: 37 Abstract: Physically motivated and mathematically robust atom-centered… read moreAbstract: Physically motivated and mathematically robust atom-centered representations of molecular structures are key to the success of modern atomistic machine learning. They lie at the foundation of a wide range of methods to predict the properties of both materials and molecules and to explore and visualize their chemical structures and compositions. Recently, it has become clear that many of the most effective representations share a fundamental formal connection. They can all be expressed as a discretization of n-body correlation functions of the local atom density, suggesting the opportunity of standardizing and, more importantly, optimizing their evaluation. We present an implementation, named librascal, whose modular design lends itself both to developing refinements to the density-based formalism and to rapid prototyping for new developments of rotationally equivariant atomistic representations. As an example, we discuss smooth overlap of atomic position (SOAP) features, perhaps the most widely used member of this family of representations, to show how the expansion of the local density can be optimized for any choice of radial basis sets. We discuss the representation in the context of a kernel ridge regression model, commonly used with SOAP features, and analyze how the computational effort scales for each of the individual steps of the calculation. By applying data reduction techniques in feature space, we show how to reduce the total computational cost by a factor of up to 4 without affecting the model's symmetry properties and without significantly impacting its accuracy. read less NOT USED (low confidence) F. Musil, A. Grisafi, A. P. Bart’ok, C. Ortner, G. Csányi, and M. Ceriotti, “Physics-Inspired Structural Representations for Molecules and Materials.,” Chemical reviews. 2021. link Times cited: 210 Abstract: The first step in the construction of a regression model or … read moreAbstract: The first step in the construction of a regression model or a data-driven analysis, aiming to predict or elucidate the relationship between the atomic-scale structure of matter and its properties, involves transforming the Cartesian coordinates of the atoms into a suitable representation. The development of atomic-scale representations has played, and continues to play, a central role in the success of machine-learning methods for chemistry and materials science. This review summarizes the current understanding of the nature and characteristics of the most commonly used structural and chemical descriptions of atomistic structures, highlighting the deep underlying connections between different frameworks and the ideas that lead to computationally efficient and universally applicable models. It emphasizes the link between properties, structures, their physical chemistry, and their mathematical description, provides examples of recent applications to a diverse set of chemical and materials science problems, and outlines the open questions and the most promising research directions in the field. read less NOT USED (low confidence) J. Ding et al., “Machine learning for molecular thermodynamics,” Chinese Journal of Chemical Engineering. 2021. link Times cited: 16 NOT USED (low confidence) C. Chen, Y. Zuo, W. Ye, X.-G. Li, and S. Ong, “Learning properties of ordered and disordered materials from multi-fidelity data,” Nature Computational Science. 2021. link Times cited: 83 NOT USED (low confidence) S. Watanabe et al., “High-dimensional neural network atomic potentials for examining energy materials: some recent simulations,” Journal of Physics: Energy. 2020. link Times cited: 16 Abstract: Owing to their simultaneous accuracy and computational effic… read moreAbstract: Owing to their simultaneous accuracy and computational efficiency, interatomic potentials machine-learned using first-principles calculation data are promising for investigating phenomena closely related to atomic motion in various energy materials. We have been working with one type of these potentials, high-dimensional (HD) neural network potentials (NNPs), and their applications, but we realized that our current understanding of HD NNPs, e.g. the meaning of the atomic energy mapping, remained insufficient, and that tuning their prediction performance for different target properties/phenomena often requires much trial and error. In this article, we illustrate the usefulness of NNPs through our studies on ion migration and thermal transport in energy and related materials. We also share our experiences with data sampling and training strategies and discuss the meaning of atomic energy mapping in HD NNPs. read less NOT USED (low confidence) M. Babar, H. L. Parks, G. Houchins, and V. Viswanathan, “An accurate machine learning calculator for the lithium-graphite system,” Journal of Physics: Energy. 2020. link Times cited: 10 Abstract: Machine-learning potentials are accelerating the development… read moreAbstract: Machine-learning potentials are accelerating the development of energy materials, especially in identifying phase diagrams and other thermodynamic properties. In this work, we present a neural network potential based on atom-centered symmetry function descriptors to model the energetics of lithium intercalation into graphite. The potential was trained on a dataset of over 9000 diverse lithium–graphite configurations that varied in applied stress and strain, lithium concentration, lithium–carbon and lithium–lithium bond distances, and stacking order to ensure wide sampling of the potential atomic configurations during intercalation. We calculated the energies of these structures using density functional theory (DFT) through the Bayesian error estimation functional with van der Waals correlation exchange-correlation functional, which can accurately describe the van der Waals interactions that are crucial to determining the thermodynamics of this phase space. Bayesian optimization, as implemented in Dragonfly, was used to select optimal set of symmetry function parameters, ultimately resulting in a potential with a prediction error of 8.24 meV atom−1 on unseen test data. The potential can predict energies, structural properties, and elastic constants at an accuracy comparable to other DFT exchange-correlation functionals at a fraction of the computational cost. The accuracy of the potential is also comparable to similar machine-learned potentials describing other systems. We calculate the open circuit voltage with the calculator and find good agreement with experiment, especially in the regime x ≥ 0.3, for x in Li x C6. This study further illustrates the power of machine learning potentials, which promises to revolutionize design and optimization of battery materials. read less NOT USED (low confidence) Y. Ouyang, Z. Zhang, C. Yu, J. He, G. Yan, and J. C. hyperlinks, “Accuracy of Machine Learning Potential for Predictions of Multiple-Target Physical Properties,” Chinese Physics Letters. 2020. link Times cited: 9 NOT USED (low confidence) P. Korotaev and A. Shapeev, “Lattice dynamics of
YbxCo4Sb12
skutterudite by machine-learning interatomic potentials: Effect of filler concentration and disorder,” Physical Review B. 2020. link Times cited: 7 Abstract: Lattice dynamics determines a number of important properties… read moreAbstract: Lattice dynamics determines a number of important properties of solids. While computational methods with predictive power have been developed in this area, the task is still difficult for the complex compounds. We present a method for automatic on-the-fly generation of multicomponent interatomic potentials. The method is based on active learning, which ensures effective extrapolation to new atomic environments. The accuracy is then demonstrated on the example of the Yb-filled skutterudite compound ${\mathrm{Yb}}_{x}{\mathrm{Co}}_{4}{\mathrm{Sb}}_{12}$, which is a family of the promising thermoelectric materials. Atomic displacements, vibrational spectrum, and lattice thermal conductivity were obtained and the effect of the Yb filling and ordering was studied as 700 K. The potential allowed us to reproduce fine features of the vibrational spectrum, as well as the reduction of the lattice thermal conductivity with filling. We found only a small effect of the disorder on the vibrational spectrum and the thermal conductivity. read less NOT USED (low confidence) Y. Shaidu, E. Kucukbenli, R. Lot, F. Pellegrini, E. Kaxiras, and S. de Gironcoli, “A systematic approach to generating accurate neural network potentials: the case of carbon,” npj Computational Materials. 2020. link Times cited: 18 NOT USED (low confidence) R. Batra, L. Song, and R. Ramprasad, “Emerging materials intelligence ecosystems propelled by machine learning,” Nature Reviews Materials. 2020. link Times cited: 121 NOT USED (low confidence) A. L. Ferguson, J. Hachmann, T. F. Miller, and J. Pfaendtner, “The Journal of Physical Chemistry A/B/C Virtual Special Issue on Machine Learning in Physical Chemistry.,” The journal of physical chemistry. B. 2020. link Times cited: 2 Abstract: Physical chemistry stands today at an exciting transition st… read moreAbstract: Physical chemistry stands today at an exciting transition state where the integration of machine learning and data science tools into all corners of the field stands poised to do nothing short of revolutionizing the discipline. These powerful techniques—when appropriately combined with domain knowledge, tools, and expertise—have led to new physical insights, better understanding, accelerated discovery, rational design, and inverse engineering that transcend traditional approaches to materials, molecular, and chemical science and engineering. The primary driver of this trend has been the impressive advances enabled by machine learning, artificial intelligence, and data science tools, ranging from the discovery of novel electronic and optical materials by high-throughput virtual screening, to the massive acceleration of molecular simulations using learned classical force fields with quantum accuracy, to the powering of “self-driving laboratories” for automated chemical discovery. The 2011 White House Materials Genome Initiative (MGI), the 2017 NSF Data-Driven Discovery Science in Chemistry (D3SC) initiative, and the 2019 NSF Big Idea Harnessing the Data Revolution are some of the US federal programs that have provided incentive, attention, momentum, and support to power these advances and help drive the field forward. Necessity is also the mother of invention, and the prevalence of large data sets routinely generated by high-throughput virtual screening or automated experimentation have spurred the need for scalable data science and machine learning techniques to parse, explore, and harness the full power of these voluminous data streams. It bears remembering that physical chemistry is no stranger to machine learning, most visibly in the cheminformatics and quantitative structure property relation (QSPR) work that emerged in the 1980s. Some of the techniques being implemented today are, to some degree, reinventions of these ideas, but others are fundamentally new concepts that have been adopted and adapted from diverse fields including computer vision, manifold learning, and deep learning. This Virtual Special Issue on Machine Learning in Physical Chemistry covering all sections of The Journal of Physical Chemistry A/B/C pays tribute to this development, and the relevance and popularity of this topic is reflected in the depth and breadth of excellent articles in this exciting collection. read less NOT USED (low confidence) A. L. Ferguson, J. Hachmann, T. F. Miller, and J. Pfaendtner, “The Journal of Physical Chemistry A/B/C Virtual Special Issue on Machine Learning in Physical Chemistry.,” The journal of physical chemistry. A. 2020. link Times cited: 2 NOT USED (low confidence) S. Starikov, I. Gordeev, Y. Lysogorskiy, L. Kolotova, and S. Makarov, “Optimized interatomic potential for study of structure and phase transitions in Si-Au and Si-Al systems,” Computational Materials Science. 2020. link Times cited: 19 NOT USED (low confidence) M. Stricker, B. Yin, E. Mak, and W. Curtin, “Machine learning for metallurgy II. A neural-network potential for magnesium,” Physical Review Materials. 2020. link Times cited: 26 Abstract: Interatomic potentials are essential for studying fundamenta… read moreAbstract: Interatomic potentials are essential for studying fundamental mechanisms of deformation and failure in metals and alloys because the relevant defects (dislocations, cracks, etc.) are far above the scales accessible to first-principles studies. Existing potentials for non-fcc metals and nearly all alloys are, however, not sufficiently quantitative for many crucial phenomena. Here machine learning in the Behler-Parrinello neural-network framework is used to create a broadly applicable potential for pure hcp magnesium (Mg). Lightweight Mg and its alloys are technologically important while presenting a diverse range of slip systems and crystal surfaces relevant to both plasticity and fracture that present a significant challenge for any potential. The machine learning potential is trained on first-principles density-functional theory (DFT) computable metallurgically relevant properties and is then shown to well predict metallurgically crucial dislocation and crack structures and competing phenomena. Extensive comparisons to an existing very good modified embedded atom method potential are made. These results demonstrate that a single machine learning potential can represent the wide scope of phenomena required for metallurgical studies. The DFT database is openly available for use in any other machine learning method. The method is naturally extendable to alloys, which are necessary for engineering applications but where ductility and fracture are controlled by complex atomic-scale mechanisms that are not well predicted by existing potentials. read less NOT USED (low confidence) Q. Tong et al., “Combining Machine Learning Potential and Structure Prediction for Accelerated Materials Design and Discovery.,” The journal of physical chemistry letters. 2020. link Times cited: 33 Abstract: Theoretical structure prediction method via quantum mechanic… read moreAbstract: Theoretical structure prediction method via quantum mechanical atomistic simulations such as density functional theory (DFT), solely based on chemical composition, already becomes a routine tool to determine the structures of physical and chemical systems, e.g. solids and clusters. However, the application of DFT to more realistic simulations, to a large extent, is impeded owing to the unfavourable scaling of the computational cost with respective to the system size. During recent years, machine learning potential (MLP) method has been rapidly rising as an accurate and efficient tool for atomistic simulations. In this Perspective, we provide an introduction on the basic principles and advantages for the combination of structure prediction and MLP, as well as challenges and opportunities along this promising direction. read less NOT USED (low confidence) B. Mortazavi, E. Podryabinkin, I. Novikov, T. Rabczuk, X. Zhuang, and A. Shapeev, “Accelerating first-principles estimation of thermal conductivity by machine-learning interatomic potentials: A MTP/ShengBTE solution,” Comput. Phys. Commun. 2020. link Times cited: 90 NOT USED (low confidence) V. L. Deringer, “Modelling and understanding battery materials with machine-learning-driven atomistic simulations,” Journal of Physics: Energy. 2020. link Times cited: 49 Abstract: The realistic computer modelling of battery materials is an … read moreAbstract: The realistic computer modelling of battery materials is an important research goal, with open questions ranging from atomic-scale structure and dynamics to macroscopic phenomena. Quantum-mechanical methods offer high accuracy and predictive power in small-scale atomistic simulations, but they quickly reach their limits when complex electrochemical systems are to be studied—for example, when structural disorder or even fully amorphous phases are present, or when reactions take place at the interface between electrodes and electrolytes. In this Perspective, it is argued that emerging machine learning based interatomic potentials are promising tools for studying battery materials on the atomistic and nanometre length scales, affording quantum-mechanical accuracy yet being many orders of magnitude faster, and thereby extending the capabilities of current battery modelling methodology. Initial applications to solid-state electrolyte and anode materials in lithium-ion batteries are highlighted, and future directions and possible synergies with experiments are discussed. read less NOT USED (low confidence) R. Jinnouchi, K. Miwa, F. Karsai, G. Kresse, and R. Asahi, “On-the-Fly Active Learning of Interatomic Potentials for Large-Scale Atomistic Simulations.,” The journal of physical chemistry letters. 2020. link Times cited: 79 Abstract: The on-the-fly generation of machine-learning force fields b… read moreAbstract: The on-the-fly generation of machine-learning force fields by active-learning schemes attracts a great deal of attention in the community of atomistic simulations. The algorithms allow the machine to self-learn an interatomic potential and construct machine-learned models on the fly during simulations. State-of-the-art query strategies allow the machine to judge whether new structures are out of the training data set or not. Only when the machine judges the necessity of updating the data set with the new structures are first-principles calculations carried out. Otherwise, the yet available machine-learned model is used to update the atomic positions. In this manner, most of the first-principles calculations are bypassed during training, and overall, simulations are accelerated by several orders of magnitude while retaining almost first-principles accuracy. In this Perspective, after describing essential components of the active-learning algorithms, we demonstrate the power of the schemes by presenting recent applications. read less NOT USED (low confidence) E. A. Wu et al., “A Stable Cathode-Solid Electrolyte Composite for Long-Cycle-Life, High Voltage Solid-State Sodium-ion Batteries,” ChemRxiv. 2020. link Times cited: 1 Abstract: Rechargeable
solid-state sodium-ion batteries (SSSBs) hol… read more Abstract: Rechargeable
solid-state sodium-ion batteries (SSSBs) hold great promise for safer and more energy-dense
energy storage. However, the poor electrochemical stability between current sulfide-based
solid electrolytes and high-voltage oxide cathodes has limited their long-term
cycling performance and practicality. Here, we report the discovery of Na3-xY1-xZrxCl6
(NYZC) as an ion conductor that is both electrochemically stable (up to 3.8 V
vs. Na/Na+) and chemically compatible with oxide cathodes. Its high ionic
conductivity of 6.6 x 10⁻⁵ S cm-1 at ambient temperature,
several orders of magnitude higher than oxide coatings, is attributed to
abundant Na vacancies and cooperative MCl6 rotation, resulting in an
extremely low interfacial impedance. A SSSB comprising a NaCrO2+NYZC
composite cathode, Na3PS4 electrolyte, and Na-Sn anode
exhibits an exceptional first-cycle Coulombic efficiency of 97.1% at room
temperature and can cycle over 1000 cycles with 89.3% capacity retention at 40°C. These findings
highlight the immense potential of halide ion conductors for SSSB applications. read less NOT USED (low confidence) R. Zubatyuk, J. S. Smith, B. Nebgen, S. Tretiak, and O. Isayev, “Teaching a neural network to attach and detach electrons from molecules,” Nature Communications. 2020. link Times cited: 46 NOT USED (low confidence) K. Bang, B. C. Yeo, D. Kim, S. Han, and H.-M. Lee, “Accelerated mapping of electronic density of states patterns of metallic nanoparticles via machine-learning,” Scientific Reports. 2020. link Times cited: 10 NOT USED (low confidence) M. Liu and J. Kitchin, “SingleNN: Modified Behler–Parrinello Neural Network with Shared Weights for Atomistic Simulations with Transferability,” Journal of Physical Chemistry C. 2020. link Times cited: 18 Abstract: In this article, we introduce the SingleNN, which is a modif… read moreAbstract: In this article, we introduce the SingleNN, which is a modified version of the Behler–Parrinello Neural Network (BPNN) where the neural networks for the prediction of atomic energy for different el... read less NOT USED (low confidence) S. Tovey et al., “DFT Accurate Interatomic Potential for Molten NaCl from Machine Learning,” The Journal of Physical Chemistry C. 2020. link Times cited: 35 Abstract: Molten alkali chloride salts are a critical component in con… read moreAbstract: Molten alkali chloride salts are a critical component in concentrated solar power and nuclear applications. Despite their ubiquity, the extreme chemical reactivity of molten alkali chlorides at high temperatures has presented a significant challenge in characterizing atomic structures and dynamic properties experimentally. Here we investigate
molten NaCl by performing high temperature molecular dynamics simulations using a Gaussian Approximation Potential (GAP) trained on Density Functional Theory (DFT) datasets. Our GAP model, trained with a meager 1000 atomic configurations, arrives at near DFT accuracy with a mean absolute error of 1.5 meV/atom, thus enabling fast analysis of high temperature salt properties on large length (5000 ion pairs) and time (> 1ns) scales, currently inaccessible to ab initio simulations. Calculated structure factors and diffusion constants from our GAP model simulations show excellent agreement with experiments. Our results indicate that GAP models are able to capture the many-body interactions required to accurately model ionic-systems. read less NOT USED (low confidence) M. Hodapp and A. Shapeev, “In operando active learning of interatomic interaction during large-scale simulations,” Machine Learning: Science and Technology. 2020. link Times cited: 17 Abstract: A well-known drawback of state-of-the-art machine-learning i… read moreAbstract: A well-known drawback of state-of-the-art machine-learning interatomic potentials is their poor ability to extrapolate beyond the training domain. For small-scale problems with tens to hundreds of atoms this can be solved by using active learning which is able to select atomic configurations on which a potential attempts extrapolation and add them to the ab initio-computed training set. In this sense an active learning algorithm can be viewed as an on-the-fly interpolation of an ab initio model. For large-scale problems, possibly involving tens of thousands of atoms, this is not feasible because one cannot afford even a single density functional theory (DFT) computation with such a large number of atoms. This work marks a new milestone toward fully automatic ab initio-accurate large-scale atomistic simulations. We develop an active learning algorithm that identifies local subregions of the simulation region where the potential extrapolates. Then the algorithm constructs periodic configurations out of these local, non-periodic subregions, sufficiently small to be computable with plane-wave DFT codes, in order to obtain accurate ab initio energies. We benchmark our algorithm on the problem of screw dislocation motion in bcc tungsten and show that our algorithm reaches ab initio accuracy, down to typical magnitudes of numerical noise in DFT codes. We show that our algorithm reproduces material properties such as core structure, Peierls barrier, and Peierls stress. This unleashes new capabilities for computational materials science toward applications which have currently been out of scope if approached solely by ab initio methods. read less NOT USED (low confidence) K. Min and E. Cho, “Neural Network Interatomic Potential for Predicting the Formation of Planar Defect in Nanocrystal,” The Journal of Physical Chemistry C. 2020. link Times cited: 4 Abstract: Recent advances in the development of interatomic potential … read moreAbstract: Recent advances in the development of interatomic potential using neural networks have proven that its accuracy reaches that of first-principles calculations but with considerably reduced computati... read less NOT USED (low confidence) C. Scherer, R. Scheid, D. Andrienko, and T. Bereau, “Kernel-Based Machine Learning for Efficient Simulations of Molecular Liquids,” Journal of Chemical Theory and Computation. 2020. link Times cited: 48 Abstract: Current machine learning (ML) models aimed at learning force… read moreAbstract: Current machine learning (ML) models aimed at learning force fields are plagued by their high computational cost at every integration time step. We describe a number of practical and computationally efficient strategies to parametrize traditional force fields for molecular liquids from ML: the particle decomposition ansatz to two- and three-body force fields, the use of kernel-based ML models that incorporate physical symmetries, the incorporation of switching functions close to the cutoff, and the use of covariant meshing to boost the training set size. Results are presented for model molecular liquids: pairwise Lennard-Jones, three-body Stillinger–Weber, and bottom-up coarse-graining of water. Here, covariant meshing proves to be an efficient strategy to learn canonically averaged instantaneous forces. We show that molecular dynamics simulations with tabulated two- and three-body ML potentials are computationally efficient and recover two- and three-body distribution functions. Many-body representations, decomposition, and kernel regression schemes are all implemented in the open-source software package VOTCA. read less NOT USED (low confidence) G. R. Schleder, A. C. Padilha, A. Rocha, G. Dalpian, and A. Fazzio, “Ab Initio Simulations and Materials Chemistry in the Age of Big Data,” Journal of chemical information and modeling. 2020. link Times cited: 26 Abstract: In this perspective article we discuss computational advance… read moreAbstract: In this perspective article we discuss computational advances in the last decades, both in algorithms as well as in technologies, that enabled the development, widespread use, and maturity of simulation methods for molecular and materials systems. Such advances led to the generation of large amounts of data, which required the creation of several computational databases. Within this scenario, with the democratization of data access, the field now encounters several opportunities for data-driven approaches towards chemical and materials problems. Especially, machine learning methods for predictions of novel materials or properties are being increasingly used with great success. However, black-box usage fails in many instances; several technical details require expert knowledge in order to the predictions to be useful, such as with descriptors and algorithm selection. These approaches represent a direction for further developments, notably allowing advances for both developed and emerging countries with modest computational infrastructures. read less NOT USED (low confidence) A. Thorn, J. Rojas-Nunez, S. Hajinazar, S. Baltazar, and A. Kolmogorov, “Toward ab Initio Ground States of Gold Clusters via Neural Network Modeling,” The Journal of Physical Chemistry C. 2019. link Times cited: 17 Abstract: Prescreening candidate structures with reliable classical po… read moreAbstract: Prescreening candidate structures with reliable classical potentials is an effective way to accelerate ab-initio ground state searches. Given the growing popularity of machine learning force fields, surprisingly little work has been dedicated to quantifying their advantages over traditional potentials in global structure optimizations. In this study, we have developed a neural network (NN) model and systematically benchmarked it against a commonly used Gupta potential and an embedded atom model in the search for stable AuN clusters (30≤N≤80). An efficient simultaneous optimization of clusters in the full size range was achieved with our recently introduced multitribe evolutionary algorithm. Density functional theory (DFT) evaluations of candidate configurations identified with the three classical models revealed that the NN structures were lower in energy by at least 10 meV/atom for 30 of the 51 sizes. We also demonstrated that DFT evaluation of all NN-relaxed structures during evolutionary searches resul... read less NOT USED (low confidence) A. Hernandez, A. Balasubramanian, F. Yuan, S. Mason, and T. Mueller, “Fast, accurate, and transferable many-body interatomic potentials by symbolic regression,” npj Computational Materials. 2019. link Times cited: 51 NOT USED (low confidence) Y. Wang et al., “Anisotropic Thermal Transport in Chalcogenide Perovskite CaZrS3 from Machine Learning Interatomic Potential,” Engineered Science. 2023. link Times cited: 0 Abstract: Chalcogenide perovskites are being actively considered for p… read moreAbstract: Chalcogenide perovskites are being actively considered for photovoltaic, optoelectronic, and thermoelectric applications due to their high carrier mobility, strong light absorption, long-term stability, and environment-friendliness. For all these applications, thermal properties play a key role in determining the performance and lifetime of perovskite systems. In this work, we have developed a machine-learning Gaussian approximation potential to study the structural and thermal transport properties of chalcogenide perovskite CaZrS 3 . We show that the GAP achieves a DFT-level accuracy in describing both cubic and orthorhombic CaZrS 3 , with 2-4 orders of magnitude reduced computational cost. Specifically, we applied the GAP to predict the lattice thermal conductivities ( κ L ) and phonon properties of orthorhombic CaZrS 3 from 200 to 900 K by considering four-phonon processes. Compared to its counterpart CaZrSe 3 , the CaZrS 3 exhibits comparably low but relatively more anisotropic κ L mainly due to its strong anharmonicity and anisotropic group velocities. Specifically, its thermal conductivities along the a-and c-axis are close and notably lower than that along the b -axis. Optical phonons contribute as high as nearly half of the total thermal conductivity throughout the entire temperature range. Particularly, we observe non-* read less NOT USED (low confidence) M. Cusentino et al., “Molecular dynamics of high pressure tin phases: Empirical and machine learned interatomic potentials,” SHOCK COMPRESSION OF CONDENSED MATTER - 2022: Proceedings of the Conference of the American Physical Society Topical Group on Shock Compression of Condensed Matter. 2023. link Times cited: 0 NOT USED (low confidence) T. Barnard, S. Steng, J. R. Darby, A. Bartók, A. Broo, and G. Sosso, “Leveraging genetic algorithms to maximise the predictive capabilities of the SOAP descriptor,” Molecular Systems Design & Engineering. 2022. link Times cited: 2 Abstract: The Smooth Overlap of Atomic Positions (SOAP) descriptor rep… read moreAbstract: The Smooth Overlap of Atomic Positions (SOAP) descriptor represents an increasingly common approach to encode local atomic environments in a form readily digestible to machine learning algorithms. The SOAP descriptor... read less NOT USED (high confidence) Y. Liu, X. He, and Y. Mo, “Discrepancies and error evaluation metrics for machine learning interatomic potentials,” npj Computational Materials. 2023. link Times cited: 1 NOT USED (high confidence) H. Chen, Z. Deng, Y. Li, and P. Canepa, “On the Active Components in Crystalline Li–Nb–O and Li–Ta–O Coatings from First Principles,” Chemistry of Materials. 2023. link Times cited: 0 Abstract: Layered-oxide $\mathrm{LiNi_xMn_yCo_{1-x-y}O_2}$ (NMC) posit… read moreAbstract: Layered-oxide $\mathrm{LiNi_xMn_yCo_{1-x-y}O_2}$ (NMC) positive electrodes with high Nickel content, deliver high voltages and energy densities. However, a high nickel content, e.g., $x$ = 0.8 (NMC 811), can lead to high surface reactivity, which can trigger thermal runaway and gas generation. While claimed safer, all-solid-state batteries still suffer from high interfacial resistance. Here, we investigate niobate and tantalate coating materials, which can mitigate the interfacial reactivities in Li-ion and all-solid-state batteries. First-principles calculations reveal the multiphasic nature of Li-Nb-O and Li-Ta-O coatings, containing mixtures of $\mathrm{LiNbO_3}$ and $\mathrm{Li_3NbO_4}$, or of $\mathrm{LiTaO_3}$ and $\mathrm{Li_3TaO_4}$. The concurrence of several phases in Li-Nb-O or Li-Ta-O modulates the type of stable native defects in these coatings. Li-Nb-O and Li-Ta-O coating materials can form favorably lithium vacancies $\mathrm{Vac^{'}_{Li}}$ and antisite defects $\mathrm{Nb^{\bullet \bullet \bullet \bullet}_{Li}}$ ($\mathrm{Ta^{\bullet \bullet \bullet \bullet}_{Li}}$) combined into charge-neutral defect complexes. Even in defective crystalline $\mathrm{LiNbO_3}$ (or $\mathrm{LiTaO_3}$), we reveal poor Li-ion conduction properties. In contrast, $\mathrm{Li_3NbO_4}$ and $\mathrm{Li_3TaO_4}$ that are introduced by high-temperature calcinations can provide adequate Li-ion transport in these coatings. Our in-depth investigation of the structure-property relationships in the important Li-Nb-O and Li-Ta-O coating materials helps to develop more suitable calcination protocols to maximize the functional properties of these niobates and tantalates. read less NOT USED (high confidence) Z. Xu et al., “Machine learning molecular dynamics simulation identifying weakly negative effect of polyanion rotation on Li-ion migration,” npj Computational Materials. 2023. link Times cited: 3 NOT USED (high confidence) A. Rohskopf et al., “Exploring model complexity in machine learned potentials for simulated properties,” Journal of Materials Research. 2023. link Times cited: 1 Abstract: Machine learning (ML) enables the development of interatomic… read moreAbstract: Machine learning (ML) enables the development of interatomic potentials with the accuracy of first principles methods while retaining the speed and parallel efficiency of empirical potentials. While ML potentials traditionally use atom-centered descriptors as inputs, different models such as linear regression and neural networks map descriptors to atomic energies and forces. This begs the question: what is the improvement in accuracy due to model complexity irrespective of descriptors? We curate three datasets to investigate this question in terms of ab initio energy and force errors: (1) solid and liquid silicon, (2) gallium nitride, and (3) the superionic conductor Li$$_{10}$$
10
Ge(PS$$_{6}$$
6
)$$_{2}$$
2
(LGPS). We further investigate how these errors affect simulated properties and verify if the improvement in fitting errors corresponds to measurable improvement in property prediction. By assessing different models, we observe correlations between fitting quantity (e.g. atomic force) error and simulated property error with respect to ab initio values.
Graphical abstract read less NOT USED (high confidence) E. Podryabinkin, K. Garifullin, A. Shapeev, and I. Novikov, “MLIP-3: Active learning on atomic environments with moment tensor potentials.,” The Journal of chemical physics. 2023. link Times cited: 5 Abstract: Nowadays, academic research relies not only on sharing with … read moreAbstract: Nowadays, academic research relies not only on sharing with the academic community the scientific results obtained by research groups while studying certain phenomena but also on sharing computer codes developed within the community. In the field of atomistic modeling, these were software packages for classical atomistic modeling, and later for quantum-mechanical modeling; currently, with the fast growth of the field of machine-learning potentials, the packages implement such potentials. In this paper, we present the MLIP-3 package for constructing moment tensor potentials and performing their active training. This package builds on the MLIP-2 package [Novikov et al., "The MLIP package: moment tensor potentials with MPI and active learning," Mach. Learn.: Sci. Technol., 2(2), 025002 (2020)], however, with a number of improvements, including active learning on atomic neighborhoods of a possibly large atomistic simulation. read less NOT USED (high confidence) A. Rohskopf et al., “FitSNAP: Atomistic machine learning with LAMMPS,” J. Open Source Softw. 2023. link Times cited: 12 NOT USED (high confidence) M. Minotakis, H. Rossignol, M. Cobelli, and S. Sanvito, “Machine-learning surrogate model for accelerating the search of stable ternary alloys,” Physical Review Materials. 2023. link Times cited: 1 Abstract: The prediction of phase diagrams in the search for new phase… read moreAbstract: The prediction of phase diagrams in the search for new phases is a complex and computationally intensive task. Density functional theory provides, in many situations, the desired accuracy, but its throughput becomes prohibitively limited as the number of species involved grows, even when used with local and semi-local functionals. Here, we explore the possibility of integrating machine-learning models in the workflow for the construction of ternary convex hull diagrams. In particular, we train a set of spectral neighbour-analysis potentials (SNAPs) over readily available binary phases and we establish whether this is good enough to predict the energies of novel ternaries. Such a strategy does not require any new calculations specific for the construction of the model, but just avails of data stored in binary-phase-diagram repositories. We find that a so-constructed SNAP is capable of accurate total-energy estimates for ternary phases close to the equilibrium geometry but, in general, is not able to perform atomic relaxation. This is because during a typical relaxation path a given phase traverses regions in the parameter space poorly represented by the training set. Different metrics are then investigated to assess how an unknown structure is well described by a given SNAP model, and we find that the standard deviation of an ensemble of SNAPs provides a fast and non-specie-specific metric. read less NOT USED (high confidence) J. M. Goff, Y. Zhang, C. Negre, A. Rohskopf, and A. Niklasson, “Shadow Molecular Dynamics and Atomic Cluster Expansions for Flexible Charge Models.,” Journal of chemical theory and computation. 2023. link Times cited: 0 Abstract: A shadow molecular dynamics scheme for flexible charge model… read moreAbstract: A shadow molecular dynamics scheme for flexible charge models is presented where the shadow Born-Oppenheimer potential is derived from a coarse-grained approximation of range-separated density functional theory. The interatomic potential, including the atomic electronegativities and the charge-independent short-range part of the potential and force terms, is modeled by the linear atomic cluster expansion (ACE), which provides a computationally efficient alternative to many machine learning methods. The shadow molecular dynamics scheme is based on extended Lagrangian (XL) Born-Oppenheimer molecular dynamics (BOMD) [Eur. Phys. J. B 2021, 94, 164]. XL-BOMD provides stable dynamics while avoiding the costly computational overhead associated with solving an all-to-all system of equations, which normally is required to determine the relaxed electronic ground state prior to each force evaluation. To demonstrate the proposed shadow molecular dynamics scheme for flexible charge models using atomic cluster expansion, we emulate the dynamics generated from self-consistent charge density functional tight-binding (SCC-DFTB) theory using a second-order charge equilibration (QEq) model. The charge-independent potentials and electronegativities of the QEq model are trained for a supercell of uranium oxide (UO2) and a molecular system of liquid water. The combined ACE+XL-QEq molecular dynamics simulations are stable over a wide range of temperatures both for the oxide and for the molecular systems and provide a precise sampling of the Born-Oppenheimer potential energy surfaces. Accurate ground Coulomb energies are produced by the ACE-based electronegativity model during an NVE simulation of UO2, predicted to be within 1 meV of those from SCC-DFTB on average during comparable simulations. read less NOT USED (high confidence) L. Martín‐Encinar, L. Marqués, I. Santos, P. López, and L. Pelaz, “Concurrent Characterization of Surface Diffusion and Intermixing of Ge on Si: A Classical Molecular Dynamics Study,” Advanced Theory and Simulations. 2023. link Times cited: 1 Abstract: The surface diffusion and intermixing of Ge ad‐atoms over Si… read moreAbstract: The surface diffusion and intermixing of Ge ad‐atoms over Si (001) 2 × 1 substrates using classical molecular dynamics (CMD) simulations are characterized here. Several interatomic potentials, parametrizations, and parameter mixing rules are contemplated. A novel simulation scheme is devised to characterize the effective frequency of surface diffusion and intermixing events overcoming the inherent difficulties related to their interdependency in heteroepitaxial systems. The effective energy barriers of these events encompass different atomistic mechanisms weighted by their occurrence probabilities. The overall description of surface diffusion and intermixing based on Stillinger–Weber (SW) potential is in agreement with ab initio calculations and experimental observations, though some atomistic details differ. This study is extended to Si(001) substrates with stressed Ge monolayers grown on top. It is found that Ge ad‐atom dynamics is accelerated with respect to the case of the pure Si substrate and that diffusion across dimer rows is mainly mediated by the atomic exchange of the Ge ad‐atom with a Ge atom on the surface. read less NOT USED (high confidence) Z. Li, X. Tan, Z. Fu, L. Liu, and J.-yue Yang, “Thermal transport across copper-water interfaces according to deep potential molecular dynamics.,” Physical chemistry chemical physics : PCCP. 2023. link Times cited: 1 Abstract: Nanoscale thermal transport at solid-liquid interfaces plays… read moreAbstract: Nanoscale thermal transport at solid-liquid interfaces plays an essential role in many engineering fields. This work performs deep potential molecular dynamics (DPMD) simulations to investigate thermal transport across copper-water interfaces. Unlike traditional classical molecular dynamics (CMD) simulations, we independently train a deep learning potential (DLP) based on density functional theory (DFT) calculations and demonstrated its high computational efficiency and accuracy. The trained DLP predicts radial distribution functions (RDFs), vibrational densities of states (VDOS), density curves, and thermal conductivity of water confined in the nanochannel at a DFT accuracy. The thermal conductivity decreases slightly with an increase in the channel height, while the influence of the cross-sectional area is negligible. Moreover, the predicted interfacial thermal conductance (ITC) across the copper-water interface by DPMD is 2.505 × 10⁸ W m-2 K-1, the same order of magnitude as the CMD and experimental results but with a high computational accuracy. This work seeks to simulate the thermal transport properties of solid-liquid interfaces with DFT accuracy at large-system and long-time scales. read less NOT USED (high confidence) X.-G. Li, S. Xu, Q. Zhang, S. Liu, and J. Shuai, “Complex strengthening mechanisms in nanocrystalline Ni-Mo alloys revealed by a machine-learning interatomic potential,” Journal of Alloys and Compounds. 2023. link Times cited: 2 NOT USED (high confidence) B. Focassio, M. Domina, U. Patil, A. Fazzio, and S. Sanvito, “Linear Jacobi-Legendre expansion of the charge density for machine learning-accelerated electronic structure calculations,” npj Computational Materials. 2023. link Times cited: 2 NOT USED (high confidence) E. Sanscartier, F. Saint-Denis, K.-’E. Bolduc, and N. Mousseau, “Evaluating approaches for on-the-fly machine learning interatomic potentials for activated mechanisms sampling with the activation-relaxation technique nouveau.,” The Journal of chemical physics. 2023. link Times cited: 1 Abstract: In the last few years, much effort has gone into developing … read moreAbstract: In the last few years, much effort has gone into developing general machine-learning potentials capable of describing interactions for a wide range of structures and phases. Yet, as attention turns to more complex materials, including alloys and disordered and heterogeneous systems, the challenge of providing reliable descriptions for all possible environments becomes ever more costly. In this work, we evaluate the benefits of using specific vs general potentials for the study of activated mechanisms in solid-state materials. More specifically, we test three machine-learning fitting approaches using the moment-tensor potential to reproduce a reference potential when exploring the energy landscape around a vacancy in Stillinger-Weber silicon crystal and silicon-germanium zincblende structures using the activation-relaxation technique nouveau (ARTn). We find that a targeted on-the-fly approach specific to and integrated into ARTn generates the highest precision on the energetics and geometry of activated barriers while remaining cost-effective. This approach expands the types of problems that can be addressed with high-accuracy ML potential. read less NOT USED (high confidence) Y. Luo, M. Li, H. Yuan, H. Liu, and Y. Fang, “Predicting lattice thermal conductivity via machine learning: a mini review,” npj Computational Materials. 2023. link Times cited: 11 NOT USED (high confidence) N. Nguyen, “Fast proper orthogonal descriptors for many-body interatomic potentials,” Physical Review B. 2022. link Times cited: 1 Abstract: The development of differentiable invariant descriptors for … read moreAbstract: The development of differentiable invariant descriptors for accurate representations of atomic environments plays a central role in the success of interatomic potentials for chemistry and materials science. We introduce a method to generate fast proper orthogonal descriptors for the construction of many-body interatomic potentials and discuss its relation to exising empirical and machine learning interatomic potentials. A traditional way of implementing the proper orthogonal descriptors has a computational complexity that scales exponentially with the body order in terms of the number of neighbors. We present an algorithm to compute the proper orthogonal descriptors with a computational complexity that scales linearly with the number of neighbors irrespective of the body order. We show that our method can enable a more efficient implementation for a number of existing potentials and provide a scalable systematic framework to construct new many-body potentials. The new potentials are demonstrated on a data set of density functional theory calculations for Tantalum and compared with other interatomic potentials. read less NOT USED (high confidence) J. H. Jung, P. Srinivasan, A. Forslund, and B. Grabowski, “High-accuracy thermodynamic properties to the melting point from ab initio calculations aided by machine-learning potentials,” npj Computational Materials. 2022. link Times cited: 10 NOT USED (high confidence) S. Attarian, D. Morgan, and I. Szlufarska, “Thermophysical properties of FLiBe using moment tensor potentials,” Journal of Molecular Liquids. 2022. link Times cited: 2 NOT USED (high confidence) I. Novikov, O. Kovalyova, A. Shapeev, and M. Hodapp, “AI-accelerated materials informatics method for the discovery of ductile alloys,” Journal of Materials Research. 2022. link Times cited: 3 Abstract: In computational materials science, a common means for predi… read moreAbstract: In computational materials science, a common means for predicting macroscopic (e.g., mechanical) properties of an alloy is to define a model using combinations of descriptors that depend on some material properties (elastic constants, misfit volumes, etc.), representative for the macroscopic behavior. The material properties are usually computed using special quasi-random structures, in tandem with density functional theory (DFT). However, DFT scales cubically with the number of atoms and is thus impractical for a screening over many alloy compositions. Here, we present a novel methodology which combines modeling approaches and machine-learning interatomic potentials. Machine-learning interatomic potentials are orders of magnitude faster than DFT, while achieving similar accuracy, allowing for a predictive and tractable high-throughput screening over the whole alloy space. The proposed methodology is illustrated by predicting the room temperature ductility of the medium-entropy alloy Mo–Nb–Ta. Graphical abstract read less NOT USED (high confidence) H. Wang, X. Pan, Y.-feng Wang, X.-R. Chen, Y.-X. Wang, and H. Geng, “Lattice dynamics and elastic properties of α-U at high-temperature and high-pressure by machine learning potential simulations,” Journal of Nuclear Materials. 2022. link Times cited: 6 NOT USED (high confidence) X. Guo, C. Chen, and S. Ong, “Intercalation Chemistry of the Disordered Rocksalt Li3V2O5 Anode from Cluster Expansions and Machine Learning Interatomic Potentials,” Chemistry of Materials. 2022. link Times cited: 9 Abstract: Disordered rocksalt (DRX) Li3V2O5 is a promising candidate f… read moreAbstract: Disordered rocksalt (DRX) Li3V2O5 is a promising candidate for anode in rechargeable lithium-ion batteries because of its ideal low voltage, high rate capability, and superior cycling stability. Herein, we presents a comprehensive study of intercalation chemistry of the DRX-Li3V2O5 anode using density functional theory calculations combined with machine learning cluster expansions and interatomic potentials. The predicted voltage profile of the disordered Li3V2O5 anode at room temperature based on Monte Carlo simulations with a fitted cluster expansion model is in excellent agreement with experiments. In contrast to previous DFT results, we find that Li ions predominately intercalate into tetrahedral sites during charging, while the majority of Li and V ions at octahedral sites remain stable. In addition, MD simulations with a fitted moment tensor potential attribute the fast-charging capability of DRX-Li3V2O5 to the facile diffusivity of Li+ via tetrahedral - octahedral - tetrahedral pathway. We further suggest tuning the Li:V ratio as a means to trade off increased lithiation capacity and decreased anode voltage in this system. This work provides in-depth insights into the high-performance DRX-Li3V2O5 anode, and paves the way to the discovery of other disordered anode materials. read less NOT USED (high confidence) P. Liu et al., “Combining Machine Learning and Many-Body Calculations: Coverage-Dependent Adsorption of CO on Rh(111).,” Physical review letters. 2022. link Times cited: 6 Abstract: Adsorption of carbon monoxide (CO) on transition-metal surfa… read moreAbstract: Adsorption of carbon monoxide (CO) on transition-metal surfaces is a prototypical process in surface sciences and catalysis. Despite its simplicity, it has posed great challenges to theoretical modeling. Pretty much all existing density functionals fail to accurately describe surface energies and CO adsorption site preference as well as adsorption energies simultaneously. Although the random phase approximation (RPA) cures these density functional theory failures, its large computational cost makes it prohibitive to study the CO adsorption for any but the simplest ordered cases. Here, we address these challenges by developing a machine-learned force field (MLFF) with near RPA accuracy for the prediction of coverage-dependent adsorption of CO on the Rh(111) surface through an efficient on-the-fly active learning procedure and a Δ-machine learning approach. We show that the RPA-derived MLFF is capable to accurately predict the Rh(111) surface energy and CO adsorption site preference as well as adsorption energies at different coverages that are all in good agreement with experiments. Moreover, the coverage-dependent ground-state adsorption patterns and adsorption saturation coverage are identified. read less NOT USED (high confidence) N. Nguyen and A. Rohskopf, “Proper orthogonal descriptors for efficient and accurate interatomic potentials,” J. Comput. Phys. 2022. link Times cited: 6 NOT USED (high confidence) J. Thomas, H. Chen, and C. Ortner, “Body-Ordered Approximations of Atomic Properties,” Archive for Rational Mechanics and Analysis. 2022. link Times cited: 1 NOT USED (high confidence) N. Oinonen, L. Kurki, A. Ilin, and A. Foster, “Molecule graph reconstruction from atomic force microscope images with machine learning,” MRS Bulletin. 2022. link Times cited: 5 Abstract: Despite the success of noncontact atomic force microscopy (A… read moreAbstract: Despite the success of noncontact atomic force microscopy (AFM) in providing atomic-scale insight into the structure and properties of matter on surfaces, the wider applicability of the technique faces challenges in the difficulty of interpreting the measurement data. We tackle this problem by proposing a machine learning model for extracting molecule graphs of samples from AFM images. The predicted graphs contain not only atoms and their bond connections but also their coordinates within the image and elemental identification. The model is shown to be effective on simulated AFM images, but we also highlight some issues with robustness that need to be addressed before generalization to real AFM images. Impact statement Developing better techniques for imaging matter at the atomic scale is important for advancing our fundamental understanding of physics and chemistry as well as providing better tools for materials R&D of nanotechnologies. State-of-the-art high-resolution atomic force microscopy experiments are providing such atomic-resolution imaging for many systems of interest. However, greater automation of processing the measurement data is required in order to eliminate the need for subjective evaluation by human operators, which is unreliable and requires specialized expertise. The ability to convert microscope images into graphs would provide an easily understandable and precise view into the structure of the system under study. Furthermore, a graph consisting of a discrete set of objects, rather than an image that describes a continuous domain, is much more amenable to further processing and analysis using symbolic reasoning based on physically motivated rules. This type of image-to-graph conversion is also relevant to other machine learning tasks such as scene understanding. Graphical abstract read less NOT USED (high confidence) D. Lanzoni, M. Albani, R. Bergamaschini, and F. Montalenti, “Morphological evolution via surface diffusion learned by convolutional, recurrent neural networks: Extrapolation and prediction uncertainty,” Physical Review Materials. 2022. link Times cited: 2 Abstract: We use a Convolutional Recurrent Neural Network approach to … read moreAbstract: We use a Convolutional Recurrent Neural Network approach to learn morphological evolution driven by surface diffusion. To this aim we first produce a training set using phase field simulations. Intentionally, we insert in such a set only relatively simple, isolated shapes. After proper data augmentation, training and validation, the model is shown to correctly predict also the evolution of previously unobserved morphologies and to have learned the correct scaling of the evolution time with size. Importantly, we quantify prediction uncertainties based on a bootstrap-aggregation procedure. The latter proved to be fundamental in pointing out high uncertainties when applying the model to more complex initial conditions (e.g. leading to splitting of high aspect-ratio individual structures). Automatic smart-augmentation of the training set and design of a hybrid simulation method are discussed. read less NOT USED (high confidence) D. Marchand and W. Curtin, “Machine learning for metallurgy IV: A neural network potential for Al-Cu-Mg and Al-Cu-Mg-Zn,” Physical Review Materials. 2022. link Times cited: 7 NOT USED (high confidence) S. Ono and D. Kobayashi, “Role of the M point phonons for the dynamical stability of B2 compounds,” Scientific Reports. 2022. link Times cited: 1 NOT USED (high confidence) J. T. Willman et al., “Machine learning interatomic potential for simulations of carbon at extreme conditions,” Physical Review B. 2022. link Times cited: 10 Abstract: A Spectral Neighbor Analysis (SNAP) machine learning interat… read moreAbstract: A Spectral Neighbor Analysis (SNAP) machine learning interatomic potential (MLIP) has been developed for simulations of carbon at extreme pressures (up to 5 TPa) and temperatures (up to 20,000 K). This was achieved using a large database of experimentally relevant quantum molecular dynamics (QMD) data, training the SNAP potential using a robust machine learning methodology, and performing extensive validation against QMD and experimental data. The resultant carbon MLIP demonstrates unprecedented accuracy and transferability in predicting the carbon phase diagram, melting curves of crystalline phases, and the shock Hugoniot, all within 3% of QMD. By achieving quantum accuracy and efficient implementation on leadership class high performance computing systems, SNAP advances frontiers of classical MD simulations by enabling atomic-scale insights at experimental time and length scales. read less NOT USED (high confidence) M. Li, G. Cao, Y. Luo, C. Sheng, and H. Liu, “Predicting the lattice thermal conductivity of alloyed compounds from the perspective of configurational entropy,” npj Computational Materials. 2022. link Times cited: 3 NOT USED (high confidence) M. J. Waters and J. Rondinelli, “Benchmarking structural evolution methods for training of machine learned interatomic potentials,” Journal of Physics: Condensed Matter. 2022. link Times cited: 1 Abstract: When creating training data for machine-learned interatomic … read moreAbstract: When creating training data for machine-learned interatomic potentials (MLIPs), it is common to create initial structures and evolve them using molecular dynamics (MD) to sample a larger configuration space. We benchmark two other modalities of evolving structures, contour exploration (CE) and dimer-method (DM) searches against MD for their ability to produce diverse and robust density functional theory training data sets for MLIPs. We also discuss the generation of initial structures which are either from known structures or from random structures in detail to further formalize the structure-sourcing processes in the future. The polymorph-rich zirconium-oxygen composition space is used as a rigorous benchmark system for comparing the performance of MLIPs trained on structures generated from these structural evolution methods. Using Behler–Parrinello neural networks as our MLIP models, we find that CE and the DM searches are generally superior to MD in terms of spatial descriptor diversity and statistical accuracy. read less NOT USED (high confidence) B. Klumpers, E. Hensen, and I. Filot, “Lateral Interactions of Dynamic Adlayer Structures from Artificial Neural Networks,” The Journal of Physical Chemistry C. 2022. link Times cited: 4 NOT USED (high confidence) S. Kharabadze, A. Thorn, E. A. Koulakova, and A. N. Kolmogorov, “Prediction of stable Li-Sn compounds: boosting ab initio searches with neural network potentials,” npj Computational Materials. 2022. link Times cited: 7 NOT USED (high confidence) K. Zongo, Béland, and O. ‐ Plamondon, “First-principles database for fitting a machine-learning silicon interatomic force field,” MRS Advances. 2022. link Times cited: 0 Abstract: Data-driven machine learning has emerged to address the limi… read moreAbstract: Data-driven machine learning has emerged to address the limitations of traditional methods when modeling interatomic interactions in materials, such as electronic density functional theory (DFT) and semi-empirical potentials. These machine-learning frameworks involve mathematical models coupled to quantum mechanical data. In the present article, we focus on the moment tensor potential (MTP) machine-learning framework. More specifically, we provide an account of the development of a preliminary MTP for silicon, including details pertaining to the construction of a DFT database. read less NOT USED (high confidence) W. Ye, H. Zheng, C. Chen, and S. Ong, “A Universal Machine Learning Model for Elemental Grain Boundary Energies,” SSRN Electronic Journal. 2022. link Times cited: 8 Abstract: The grain boundary (GB) energy has a profound influence on t… read moreAbstract: The grain boundary (GB) energy has a profound influence on the grain growth and properties of polycrystalline metals. Here, we show that the energy of a GB, normalized by the bulk cohesive energy, can be described purely by four geometric features. By machine learning on a large computed database of 361 small Σ ( Σ < 10) GBs of more than 50 metals, we develop a model that can predict the grain boundary energies to within a mean absolute error of 0.13 J m (cid:0) 2 . More importantly, this universal GB energy model can be extrapolated to the energies of high Σ GBs without loss in accuracy. These results highlight the importance of capturing fundamental scaling physics and domain knowledge in the design of interpretable, extrapolatable machine learning models for ma- terials science. read less NOT USED (high confidence) D. M. de Oca Zapiain, M. Wood, N. Lubbers, C. Z. Pereyra, A. Thompson, and D. Perez, “Training data selection for accuracy and transferability of interatomic potentials,” npj Computational Materials. 2022. link Times cited: 16 NOT USED (high confidence) J. P. Darby, J. Kermode, and G. Csányi, “Compressing local atomic neighbourhood descriptors,” npj Computational Materials. 2021. link Times cited: 22 NOT USED (high confidence) C. Zeni, A. Anelli, A. Glielmo, and K. Rossi, “Exploring the robust extrapolation of high-dimensional machine learning potentials,” Physical Review B. 2021. link Times cited: 9 Abstract: We show that, contrary to popular assumptions, predictions f… read moreAbstract: We show that, contrary to popular assumptions, predictions from machine learning potentials built upon high-dimensional atom-density representations almost exclusively occur in regions of the representation space which lie outside the convex hull defined by the training set points. We then propose a perspective to rationalize the domain of robust extrapolation and accurate prediction of atomistic machine learning potentials in terms of the probability density induced by training points in the representation space. read less NOT USED (high confidence) R. Lot, L. Martin-Samos, S. de Gironcoli, and A. Hémeryck, “Developing a Neural Network potential to investigate interface phenomena in solid-phase epitaxy,” 2021 IEEE 16th Nanotechnology Materials and Devices Conference (NMDC). 2021. link Times cited: 0 Abstract: In this work, we develop a new neural network potential for … read moreAbstract: In this work, we develop a new neural network potential for silicon and perform accurate molecular dynamics simulations of the liquid, amorphous and diamond phases. The potential is tested against several physical properties and the solid phase epitaxy process is simulated. read less NOT USED (high confidence) Z. Chen, F. Bononi, C. A. Sievers, W. Kong, and D. Donadio, “UV-Visible Absorption Spectra of Solvated Molecules by Quantum Chemical Machine Learning.,” Journal of chemical theory and computation. 2021. link Times cited: 6 Abstract: Predicting UV-visible absorption spectra is essential to und… read moreAbstract: Predicting UV-visible absorption spectra is essential to understand photochemical processes and design energy materials. Quantum chemical methods can deliver accurate calculations of UV-visible absorption spectra, but they are computationally expensive, especially for large systems or when one computes line shapes from thermal averages. Here, we present an approach to predict UV-visible absorption spectra of solvated aromatic molecules by quantum chemistry (QC) and machine learning (ML). We show that a ML model, trained on the high-level QC calculation of the excitation energy of a set of aromatic molecules, can accurately predict the line shape of the lowest-energy UV-visible absorption band of several related molecules with less than 0.1 eV deviation with respect to reference experimental spectra. Applying linear decomposition analysis on the excitation energies, we unveil that our ML models probe vertical excitations of these aromatic molecules primarily by learning the atomic environment of their phenyl rings, which align with the physical origin of the π →π* electronic transition. Our study provides an effective workflow that combines ML with quantum chemical methods to accelerate the calculations of UV-visible absorption spectra for various molecular systems. read less NOT USED (high confidence) J. Rogal, “Reaction coordinates in complex systems-a perspective,” The European Physical Journal B. 2021. link Times cited: 18 NOT USED (high confidence) J. Broad, S. Preston, R. Wheatley, and R. S. Graham, “Gaussian process models of potential energy surfaces with boundary optimization.,” The Journal of chemical physics. 2021. link Times cited: 7 Abstract: A strategy is outlined to reduce the number of training poin… read moreAbstract: A strategy is outlined to reduce the number of training points required to model intermolecular potentials using Gaussian processes, without reducing accuracy. An asymptotic function is used at a long range, and the crossover distance between this model and the Gaussian process is learnt from the training data. The results are presented for different implementations of this procedure, known as boundary optimization, across the following dimer systems: CO-Ne, HF-Ne, HF-Na+, CO2-Ne, and (CO2)2. The technique reduces the number of training points, at fixed accuracy, by up to ∼49%, compared to our previous work based on a sequential learning technique. The approach is readily transferable to other statistical methods of prediction or modeling problems. read less NOT USED (high confidence) X. Qian and R. Yang, “Machine learning for predicting thermal transport properties of solids,” Materials Science and Engineering: R: Reports. 2021. link Times cited: 34 NOT USED (high confidence) Y. Wang et al., “Accelerated prediction of atomically precise cluster structures using on-the-fly machine learning,” npj Computational Materials. 2021. link Times cited: 4 NOT USED (high confidence) L. Kahle and F. Zipoli, “Quality of uncertainty estimates from neural network potential ensembles.,” Physical review. E. 2021. link Times cited: 11 Abstract: Neural network potentials (NNPs) combine the computational e… read moreAbstract: Neural network potentials (NNPs) combine the computational efficiency of classical interatomic potentials with the high accuracy and flexibility of the ab initio methods used to create the training set, but can also result in unphysical predictions when employed outside their training set distribution. Estimating the epistemic uncertainty of a NNP is required in active learning or on-the-fly generation of potentials. Inspired from their use in other machine-learning applications, NNP ensembles have been used for uncertainty prediction in several studies, with the caveat that ensembles do not provide a rigorous Bayesian estimate of the uncertainty. To test whether NNP ensembles provide accurate uncertainty estimates, we train such ensembles in four different case studies and compare the predicted uncertainty with the errors on out-of-distribution validation sets. Our results indicate that NNP ensembles are often overconfident, underestimating the uncertainty of the model, and require to be calibrated for each system and architecture. We also provide evidence that Bayesian NNPs, obtained by sampling the posterior distribution of the model parameters using Monte Carlo techniques, can provide better uncertainty estimates. read less NOT USED (high confidence) S. Yin et al., “Atomistic simulations of dislocation mobility in refractory high-entropy alloys and the effect of chemical short-range order,” Nature Communications. 2021. link Times cited: 121 NOT USED (high confidence) M. S. Chen, T. Morawietz, H. Mori, T. Markland, and N. Artrith, “AENET-LAMMPS and AENET-TINKER: Interfaces for accurate and efficient molecular dynamics simulations with machine learning potentials.,” The Journal of chemical physics. 2021. link Times cited: 13 Abstract: Machine-learning potentials (MLPs) trained on data from quan… read moreAbstract: Machine-learning potentials (MLPs) trained on data from quantum-mechanics based first-principles methods can approach the accuracy of the reference method at a fraction of the computational cost. To facilitate efficient MLP-based molecular dynamics and Monte Carlo simulations, an integration of the MLPs with sampling software is needed. Here, we develop two interfaces that link the atomic energy network (ænet) MLP package with the popular sampling packages TINKER and LAMMPS. The three packages, ænet, TINKER, and LAMMPS, are free and open-source software that enable, in combination, accurate simulations of large and complex systems with low computational cost that scales linearly with the number of atoms. Scaling tests show that the parallel efficiency of the ænet-TINKER interface is nearly optimal but is limited to shared-memory systems. The ænet-LAMMPS interface achieves excellent parallel efficiency on highly parallel distributed-memory systems and benefits from the highly optimized neighbor list implemented in LAMMPS. We demonstrate the utility of the two MLP interfaces for two relevant example applications: the investigation of diffusion phenomena in liquid water and the equilibration of nanostructured amorphous battery materials. read less NOT USED (high confidence) M. Hodapp and A. Shapeev, “Machine-learning potentials enable predictive and tractable high-throughput screening of random alloys,” Physical Review Materials. 2021. link Times cited: 7 Abstract: We present an automated procedure for computing stacking fau… read moreAbstract: We present an automated procedure for computing stacking fault energies in random alloys from large-scale simulations using moment tensor potentials (MTPs) with the accuracy of density functional theory (DFT). To that end, we develop an algorithm for training MTPs on random alloys. In the first step, our algorithm constructs a set of ~10000 or more training candidate configurations with 50-100 atoms that are representative for the atomic neighborhoods occurring in the large-scale simulation. In the second step, we use active learning to reduce this set to ~100 most distinct configurations - for which DFT energies and forces are computed and on which the potential is ultimately trained. We validate our algorithm for the MoNbTa medium-entropy alloy by showing that the MTP reproduces the DFT $\frac{1}{4}[111]$ unstable stacking fault energy over the entire compositional space up to a few percent. Contrary to state-of-the-art methods, e.g., the coherent potential approximation (CPA) or special quasi-random structures (SQSs), our algorithm naturally accounts for relaxation, is not limited by DFT cell sizes, and opens opportunities to efficiently investigate follow-up problems, such as chemical ordering. In a broader sense, our algorithm can be easily modified to compute related properties of random alloys, for instance, misfit volumes, or grain boundary energies. Moreover, it forms the basis for an efficient construction of MTPs to be used in large-scale simulations of multicomponent systems. read less NOT USED (high confidence) K. Gubaev et al., “Finite-temperature interplay of structural stability, chemical complexity, and elastic properties of bcc multicomponent alloys from
ab initio
trained machine-learning potentials,” Physical Review Materials. 2021. link Times cited: 13 Abstract: An active learning approach to train machine-learning intera… read moreAbstract: An active learning approach to train machine-learning interatomic potentials (moment tensor potentials) for multicomponent alloys to ab initio data is presented. Employing this approach, the disordered body-centered cubic (bcc) TiZrHfTax system with varying Ta concentration is investigated via molecular dynamics simulations. Our results show a strong interplay between elastic properties and the structural ω phase stability, strongly affecting the mechanical properties. Based on these insights we systematically screen composition space for regimes where elastic constants show little or no temperature dependence (elinvar effect). read less NOT USED (high confidence) J. Thomas, H. Chen, and C. Ortner, “Rigorous body-order approximations of an electronic structure potential energy landscape.” 2021. link Times cited: 4 NOT USED (high confidence) J. Chapman, N. Goldman, and B. Wood, “Efficient and universal characterization of atomic structures through a topological graph order parameter,” npj Computational Materials. 2021. link Times cited: 16 NOT USED (high confidence) H. Guo, Q. Wang, A. Stuke, A. Urban, and N. Artrith, “Accelerated Atomistic Modeling of Solid-State Battery Materials With Machine Learning,” Frontiers in Energy Research. 2021. link Times cited: 26 Abstract: Materials for solid-state batteries often exhibit complex ch… read moreAbstract: Materials for solid-state batteries often exhibit complex chemical compositions, defects, and disorder, making both experimental characterization and direct modeling with first principles methods challenging. Machine learning (ML) has proven versatile for accelerating or circumventing first-principles calculations, thereby facilitating the modeling of materials properties that are otherwise hard to access. ML potentials trained on accurate first principles data enable computationally efficient linear-scaling atomistic simulations with an accuracy close to the reference method. ML-based property-prediction and inverse design techniques are powerful for the computational search for new materials. Here, we give an overview of recent methodological advancements of ML techniques for atomic-scale modeling and materials design. We review applications to materials for solid-state batteries, including electrodes, solid electrolytes, coatings, and the complex interfaces involved. read less NOT USED (high confidence) A. Goscinski, F. Musil, S. Pozdnyakov, and M. Ceriotti, “Optimal radial basis for density-based atomic representations,” The Journal of chemical physics. 2021. link Times cited: 14 Abstract: The input of almost every machine learning algorithm targeti… read moreAbstract: The input of almost every machine learning algorithm targeting the properties of matter at the atomic scale involves a transformation of the list of Cartesian atomic coordinates into a more symmetric representation. Many of the most popular representations can be seen as an expansion of the symmetrized correlations of the atom density and differ mainly by the choice of basis. Considerable effort has been dedicated to the optimization of the basis set, typically driven by heuristic considerations on the behavior of the regression target. Here, we take a different, unsupervised viewpoint, aiming to determine the basis that encodes in the most compact way possible the structural information that is relevant for the dataset at hand. For each training dataset and number of basis functions, one can build a unique basis that is optimal in this sense and can be computed at no additional cost with respect to the primitive basis by approximating it with splines. We demonstrate that this construction yields representations that are accurate and computationally efficient, particularly when working with representations that correspond to high-body order correlations. We present examples that involve both molecular and condensed-phase machine-learning models. read less NOT USED (high confidence) G. Kroes, “Computational approaches to dissociative chemisorption on metals: towards chemical accuracy.,” Physical chemistry chemical physics : PCCP. 2021. link Times cited: 15 Abstract: We review the state-of-the-art in the theory of dissociative… read moreAbstract: We review the state-of-the-art in the theory of dissociative chemisorption (DC) of small gas phase molecules on metal surfaces, which is important to modeling heterogeneous catalysis for practical reasons, and for achieving an understanding of the wealth of experimental information that exists for this topic, for fundamental reasons. We first give a quick overview of the experimental state of the field. Turning to the theory, we address the challenge that barrier heights (Eb, which are not observables) for DC on metals cannot yet be calculated with chemical accuracy, although embedded correlated wave function theory and diffusion Monte-Carlo are moving in this direction. For benchmarking, at present chemically accurate Eb can only be derived from dynamics calculations based on a semi-empirically derived density functional (DF), by computing a sticking curve and demonstrating that it is shifted from the curve measured in a supersonic beam experiment by no more than 1 kcal mol-1. The approach capable of delivering this accuracy is called the specific reaction parameter (SRP) approach to density functional theory (DFT). SRP-DFT relies on DFT and on dynamics calculations, which are most efficiently performed if a potential energy surface (PES) is available. We therefore present a brief review of the DFs that now exist, also considering their performance on databases for Eb for gas phase reactions and DC on metals, and for adsorption to metals. We also consider expressions for SRP-DFs and briefly discuss other electronic structure methods that have addressed the interaction of molecules with metal surfaces. An overview is presented of dynamical models, which make a distinction as to whether or not, and which dissipative channels are modeled, the dissipative channels being surface phonons and electronically non-adiabatic channels such as electron-hole pair excitation. We also discuss the dynamical methods that have been used, such as the quasi-classical trajectory method and quantum dynamical methods like the time-dependent wave packet method and the reaction path Hamiltonian method. Limits on the accuracy of these methods are discussed for DC of diatomic and polyatomic molecules on metal surfaces, paying particular attention to reduced dimensionality approximations that still have to be invoked in wave packet calculations on polyatomic molecules like CH4. We also address the accuracy of fitting methods, such as recent machine learning methods (like neural network methods) and the corrugation reducing procedure. In discussing the calculation of observables we emphasize the importance of modeling the properties of the supersonic beams in simulating the sticking probability curves measured in the associated experiments. We show that chemically accurate barrier heights have now been extracted for DC in 11 molecule-metal surface systems, some of which form the most accurate core of the only existing database of Eb for DC reactions on metal surfaces (SBH10). The SRP-DFs (or candidate SRP-DFs) that have been derived show transferability in many cases, i.e., they have been shown also to yield chemically accurate Eb for chemically related systems. This can in principle be exploited in simulating rates of catalyzed reactions on nano-particles containing facets and edges, as SRP-DFs may be transferable among systems in which a molecule dissociates on low index and stepped surfaces of the same metal. In many instances SRP-DFs have allowed important conclusions regarding the mechanisms underlying observed experimental trends. An important recent observation is that SRP-DFT based on semi-local exchange DFs has so far only been successful for systems for which the difference of the metal work function and the molecule's electron affinity exceeds 7 eV. A main challenge to SRP-DFT is to extend its applicability to the other systems, which involve a range of important DC reactions of e.g. O2, H2O, NH3, CO2, and CH3OH. Recent calculations employing a PES based on a screened hybrid exchange functional suggest that the road to success may be based on using exchange functionals of this category. read less NOT USED (high confidence) M. Uhrin, “Through the eyes of a descriptor: Constructing complete, invertible descriptions of atomic environments,” Physical Review B. 2021. link Times cited: 11 Abstract: In this work we apply methods for describing 3D images to th… read moreAbstract: In this work we apply methods for describing 3D images to the problem of encoding atomic environments in a way that is invariant to rotations, translations, and permutations of the atoms and, crucially, can be decoded back into the original environment modulo global orientation without the need for training a model. From the point of view of decoding, the descriptor is optimally complete and can be extended to arbitrary order, allowing for a systematic convergence of the fidelity of the description. In experiments on molecules ranging from 3 to 29 atoms in size, we demonstrate that positions can be decoded with a 96% success rate and positions plus species with a 60% rate of success, rising to 95% if a second fingerprint is used. In all cases, consistent recovery is observed for molecules with 14 or fewer atoms. Additionally, we evaluate the descriptor’s performance in predicting the energies and forces of bulk iron by means of a neural network model trained on DFT data, achieving root-mean-square deviations of 3.7 meV/atom and 0.19 eV/Å for energies and forces respectively. The combined ability to both decode and make property predictions from a representation that does not need to be learned lays the foundations for a novel way of building generative models that are tasked with solving the inverse problem of predicting atomic arrangements that are statistically likely to have certain desired properties. read less NOT USED (high confidence) G. Sivaraman et al., “Experimentally Driven Automated Machine-Learned Interatomic Potential for a Refractory Oxide.,” Physical review letters. 2021. link Times cited: 12 Abstract: Understanding the structure and properties of refractory oxi… read moreAbstract: Understanding the structure and properties of refractory oxides is critical for high temperature applications. In this work, a combined experimental and simulation approach uses an automated closed loop via an active learner, which is initialized by x-ray and neutron diffraction measurements, and sequentially improves a machine-learning model until the experimentally predetermined phase space is covered. A multiphase potential is generated for a canonical example of the archetypal refractory oxide, HfO_{2}, by drawing a minimum number of training configurations from room temperature to the liquid state at ∼2900 °C. The method significantly reduces model development time and human effort. read less NOT USED (high confidence) A. Mistry, A. Franco, S. J. Cooper, S. Roberts, and V. Viswanathan, “How Machine Learning Will Revolutionize Electrochemical Sciences,” ACS Energy Letters. 2021. link Times cited: 74 Abstract: Electrochemical systems function via interconversion of elec… read moreAbstract: Electrochemical systems function via interconversion of electric charge and chemical species and represent promising technologies for our cleaner, more sustainable future. However, their development time is fundamentally limited by our ability to identify new materials and understand their electrochemical response. To shorten this time frame, we need to switch from the trial-and-error approach of finding useful materials to a more selective process by leveraging model predictions. Machine learning (ML) offers data-driven predictions and can be helpful. Herein we ask if ML can revolutionize the development cycle from decades to a few years. We outline the necessary characteristics of such ML implementations. Instead of enumerating various ML algorithms, we discuss scientific questions about the electrochemical systems to which ML can contribute. read less NOT USED (high confidence) Y. Xie, J. Vandermause, L. Sun, A. Cepellotti, and B. Kozinsky, “Bayesian force fields from active learning for simulation of inter-dimensional transformation of stanene,” npj Computational Materials. 2021. link Times cited: 35 NOT USED (high confidence) G. Imbalzano and M. Ceriotti, “Modeling the Ga/As binary system across temperatures and compositions from first principles,” Physical Review Materials. 2021. link Times cited: 11 Abstract: Materials composed of elements from the third and fifth colu… read moreAbstract: Materials composed of elements from the third and fifth columns of the periodic table display a very rich behavior, with the phase diagram usually containing a metallic liquid phase and a polar semiconducting solid. As a consequence, it is very hard to achieve transferable empirical models of interactions between the atoms that can reliably predict their behavior across the temperature and composition range that is relevant to the study of the synthesis and properties of III/V nanostructures and devices. We present a machine-learning potential trained on density functional theory reference data that provides a general-purpose model for the Ga$_x$As$_{1-x}$ system. We provide a series of stringent tests that showcase the accuracy of the potential, and its applicability across the whole binary phase space, computing with ab initio accuracy a large number of finite-temperature properties as well as the location of phase boundaries. We also show how a committe model can be used to reliably determine the uncertainty induced by the limitations of the ML model on its predictions, to identify regions of phase space that are predicted with insufficient accuracy, and to iteratively refine the training set to achieve consistent, reliable modeling. read less NOT USED (high confidence) A. Erlebach, P. Nachtigall, and L. Grajciar, “Accurate large-scale simulations of siliceous zeolites by neural network potentials,” npj Computational Materials. 2021. link Times cited: 13 NOT USED (high confidence) A. E. Sifain et al., “Predicting phosphorescence energies and inferring wavefunction localization with machine learning,” Chemical Science. 2021. link Times cited: 9 Abstract: Phosphorescence is commonly utilized for applications includ… read moreAbstract: Phosphorescence is commonly utilized for applications including light-emitting diodes and photovoltaics. Machine learning (ML) approaches trained on ab initio datasets of singlet–triplet energy gaps may expedite the discovery of phosphorescent compounds with the desired emission energies. However, we show that standard ML approaches for modeling potential energy surfaces inaccurately predict singlet–triplet energy gaps due to the failure to account for spatial localities of spin transitions. To solve this, we introduce localization layers in a neural network model that weight atomic contributions to the energy gap, thereby allowing the model to isolate the most determinative chemical environments. Trained on the singlet–triplet energy gaps of organic molecules, we apply our method to an out-of-sample test set of large phosphorescent compounds and demonstrate the substantial improvement that localization layers have on predicting their phosphorescence energies. Remarkably, the inferred localization weights have a strong relationship with the ab initio spin density of the singlet–triplet transition, and thus infer localities of the molecule that determine the spin transition, despite the fact that no direct electronic information was provided during training. The use of localization layers is expected to improve the modeling of many localized, non-extensive phenomena and could be implemented in any atom-centered neural network model. read less NOT USED (high confidence) E. A. Wu et al., “A stable cathode-solid electrolyte composite for high-voltage, long-cycle-life solid-state sodium-ion batteries,” Nature Communications. 2021. link Times cited: 73 NOT USED (high confidence) J. Qi et al., “Bridging the gap between simulated and experimental ionic conductivities in lithium superionic conductors,” Materials Today Physics. 2021. link Times cited: 33 NOT USED (high confidence) M. Chowdhury, T. Rice, and M. Oehlschlaeger, “Evaluation of machine learning methods for classification of rotational absorption spectra for gases in the 220–330 GHz range,” Applied Physics B. 2021. link Times cited: 8 NOT USED (high confidence) T. A. Young, T. Johnston-Wood, V. L. Deringer, and F. Duarte, “A transferable active-learning strategy for reactive molecular force fields,” Chemical Science. 2021. link Times cited: 18 Abstract: Predictive molecular simulations require fast, accurate and … read moreAbstract: Predictive molecular simulations require fast, accurate and reactive interatomic potentials. Machine learning offers a promising approach to construct such potentials by fitting energies and forces to high-level quantum-mechanical data, but doing so typically requires considerable human intervention and data volume. Here we show that, by leveraging hierarchical and active learning, accurate Gaussian Approximation Potential (GAP) models can be developed for diverse chemical systems in an autonomous manner, requiring only hundreds to a few thousand energy and gradient evaluations on a reference potential-energy surface. The approach uses separate intra- and inter-molecular fits and employs a prospective error metric to assess the accuracy of the potentials. We demonstrate applications to a range of molecular systems with relevance to computational organic chemistry: ranging from bulk solvents, a solvated metal ion and a metallocage onwards to chemical reactivity, including a bifurcating Diels–Alder reaction in the gas phase and non-equilibrium dynamics (a model SN2 reaction) in explicit solvent. The method provides a route to routinely generating machine-learned force fields for reactive molecular systems. read less NOT USED (high confidence) J. Keith et al., “Combining Machine Learning and Computational Chemistry for Predictive Insights Into Chemical Systems,” Chemical Reviews. 2021. link Times cited: 224 Abstract: Machine learning models are poised to make a transformative … read moreAbstract: Machine learning models are poised to make a transformative impact on chemical sciences by dramatically accelerating computational algorithms and amplifying insights available from computational chemistry methods. However, achieving this requires a confluence and coaction of expertise in computer science and physical sciences. This Review is written for new and experienced researchers working at the intersection of both fields. We first provide concise tutorials of computational chemistry and machine learning methods, showing how insights involving both can be achieved. We follow with a critical review of noteworthy applications that demonstrate how computational chemistry and machine learning can be used together to provide insightful (and useful) predictions in molecular and materials modeling, retrosyntheses, catalysis, and drug design. read less NOT USED (high confidence) Y. Mishin, “Machine-Learning Interatomic Potentials for Materials Science,” Electrical Engineering eJournal. 2021. link Times cited: 103 NOT USED (high confidence) J. F. Rudzinski et al., “Dynamical properties across different coarse-grained models for ionic liquids,” Journal of Physics: Condensed Matter. 2021. link Times cited: 6 Abstract: Room-temperature ionic liquids (RTILs) stand out among molec… read moreAbstract: Room-temperature ionic liquids (RTILs) stand out among molecular liquids for their rich physicochemical characteristics, including structural and dynamic heterogeneity. The significance of electrostatic interactions in RTILs results in long characteristic length- and timescales, and has motivated the development of a number of coarse-grained (CG) simulation models. In this study, we aim to better understand the connection between certain CG parameterization strategies and the dynamical properties and transferability of the resulting models. We systematically compare five CG models: a model largely parameterized from experimental thermodynamic observables; a refinement of this model to increase its structural accuracy; and three models that reproduce a given set of structural distribution functions by construction, with varying intramolecular parameterizations and reference temperatures. All five CG models display limited structural transferability over temperature, and also result in various effective dynamical speedup factors, relative to a reference atomistic model. On the other hand, the structure-based CG models tend to result in more consistent cation–anion relative diffusion than the thermodynamic-based models, for a single thermodynamic state point. By linking short- and long-timescale dynamical behaviors, we demonstrate that the varying dynamical properties of the different CG models can be largely collapsed onto a single curve, which provides evidence for a route to constructing dynamically-consistent CG models of RTILs. read less NOT USED (high confidence) S. Nikolov et al., “Data-driven magneto-elastic predictions with scalable classical spin-lattice dynamics,” npj Computational Materials. 2021. link Times cited: 25 NOT USED (high confidence) Y.-S. Lin, G. P. P. Pun, and Y. Mishin, “Development of a physically-informed neural network interatomic potential for tantalum,” Computational Materials Science. 2021. link Times cited: 9 NOT USED (high confidence) B. Mortazavi, B. Javvaji, F. Shojaei, T. Rabczuk, A. Shapeev, and X. Zhuang, “Exceptional piezoelectricity, high thermal conductivity and stiffness and promising photocatalysis in two-dimensional MoSi2N4 family confirmed by first-principles,” Nano Energy. 2020. link Times cited: 208 NOT USED (high confidence) I. Novikov, B. Grabowski, F. Körmann, and A. Shapeev, “Magnetic Moment Tensor Potentials for collinear spin-polarized materials reproduce different magnetic states of bcc Fe,” npj Computational Materials. 2020. link Times cited: 50 NOT USED (high confidence) R. K. Cersonsky, B. Helfrecht, E. A. Engel, S. Kliavinek, and M. Ceriotti, “Improving sample and feature selection with principal covariates regression,” Machine Learning: Science and Technology. 2020. link Times cited: 23 Abstract: Selecting the most relevant features and samples out of a la… read moreAbstract: Selecting the most relevant features and samples out of a large set of candidates is a task that occurs very often in the context of automated data analysis, where it improves the computational performance and often the transferability of a model. Here we focus on two popular subselection schemes applied to this end: CUR decomposition, derived from a low-rank approximation of the feature matrix, and farthest point sampling (FPS), which relies on the iterative identification of the most diverse samples and discriminating features. We modify these unsupervised approaches, incorporating a supervised component following the same spirit as the principal covariates (PCov) regression method. We show how this results in selections that perform better in supervised tasks, demonstrating with models of increasing complexity, from ridge regression to kernel ridge regression and finally feed-forward neural networks. We also present adjustments to minimise the impact of any subselection when performing unsupervised tasks. We demonstrate the significant improvements associated with PCov-CUR and PCov-FPS selections for applications to chemistry and materials science, typically reducing by a factor of two the number of features and samples required to achieve a given level of regression accuracy. read less NOT USED (high confidence) H. Mirhosseini, R. K. M. Raghupathy, S. Sahoo, H. Wiebeler, M. Chugh, and T. Kühne, “In silico investigation of Cu(In,Ga)Se2-based solar cells.,” Physical chemistry chemical physics : PCCP. 2020. link Times cited: 2 Abstract: Photovoltaics is one of the most promising and fastest-growi… read moreAbstract: Photovoltaics is one of the most promising and fastest-growing renewable energy technologies. Although the price-performance ratio of solar cells has improved significantly over recent years, further systematic investigations are needed to achieve higher performance and lower cost for future solar cells. In conjunction with experiments, computer simulations are powerful tools to investigate the thermodynamics and kinetics of solar cells. Over the last few years, we have developed and employed advanced computational techniques to gain a better understanding of solar cells based on copper indium gallium selenide (Cu(In,Ga)Se2). Furthermore, we have utilized state-of-the-art data-driven science and machine learning for the development of photovoltaic materials. In this Perspective, we review our results along with a survey of the field. read less NOT USED (high confidence) V. L. Deringer, M. A. Caro, and G. Csányi, “A general-purpose machine-learning force field for bulk and nanostructured phosphorus,” Nature Communications. 2020. link Times cited: 75 NOT USED (high confidence) J. Ellis et al., “Accelerating Finite-temperature Kohn-Sham Density Functional Theory with Deep Neural Networks,” ArXiv. 2020. link Times cited: 25 Abstract: We present a numerical modeling workflow based on machine le… read moreAbstract: We present a numerical modeling workflow based on machine learning (ML) which reproduces the the total energies produced by Kohn-Sham density functional theory (DFT) at finite electronic temperature to within chemical accuracy at negligible computational cost. Based on deep neural networks, our workflow yields the local density of states (LDOS) for a given atomic configuration. From the LDOS, spatially-resolved, energy-resolved, and integrated quantities can be calculated, including the DFT total free energy, which serves as the Born-Oppenheimer potential energy surface for the atoms. We demonstrate the efficacy of this approach for both solid and liquid metals and compare results between independent and unified machine-learning models for solid and liquid aluminum. Our machine-learning density functional theory framework opens up the path towards multiscale materials modeling for matter under ambient and extreme conditions at a computational scale and cost that is unattainable with current algorithms. read less NOT USED (high confidence) D. Marchand, A. Jain, A. Glensk, and W. Curtin, “Machine learning for metallurgy I. A neural-network potential for Al-Cu,” Physical Review Materials. 2020. link Times cited: 35 Abstract: High-strength metal alloys achieve their performance via car… read moreAbstract: High-strength metal alloys achieve their performance via careful control of precipitates and solutes. The nucleation, growth, and kinetics of precipitation, and the resulting mechanical properties, are inherently atomic scale phenomena, particularly during early-stage nucleation and growth. Atomistic modeling using interatomic potentials is a desirable tool for understanding the detailed phenomena involved in precipitation and strengthening, which requires length and timescales far larger than those accessible by first-principles methods. Current interatomic potentials for alloys are not, however, sufficiently accurate for such studies. Here a family of neural-network potentials (NNPs) for the Al-Cu system are presented as a first example of a machine learning potential that can achieve near-first-principles accuracy for many different metallurgically important aspects of this alloy. High-fidelity predictions of intermetallic compounds, elastic constants, dilute solid-solution energetics, precipitate-matrix interfaces, generalized stacking fault energies and surfaces for slip in matrix and precipitates, antisite defect energies, and other quantities, are shown. The NNPs also captures the subtle entropically induced transition between ${\ensuremath{\theta}}^{\ensuremath{'}}$ and $\ensuremath{\theta}$ at temperatures around 600 K. Many comparisons are made with the state-of-the-art angular-dependent potential for Al-Cu, demonstrating the significant quantitative benefit of a machine learning approach. A preliminary kinetic Monte Carlo study shows the NNP to predict the emergence of GP zones in Al-4at%Cu at $T=300$ K in agreement with experiments. These studies show that the NNP has significant transferability to defects and properties outside the structures used to train the NNP but also shows some errors highlighting that the use of any interatomic potential requires careful validation in application to specific metallurgical problems of interest. read less NOT USED (high confidence) R. G. Patel, N. Trask, M. Wood, and E. Cyr, “A physics-informed operator regression framework for extracting data-driven continuum models,” ArXiv. 2020. link Times cited: 74 NOT USED (high confidence) J. F. Rudzinski and T. Bereau, “Coarse-grained conformational surface hopping: Methodology and transferability.,” The Journal of chemical physics. 2020. link Times cited: 11 Abstract: Coarse-grained (CG) conformational surface hopping (SH) adap… read moreAbstract: Coarse-grained (CG) conformational surface hopping (SH) adapts the concept of multisurface dynamics, initially developed to describe electronic transitions in chemical reactions, to accurately describe classical molecular dynamics at a reduced level. The SH scheme couples distinct conformational basins (states), each described by its own force field (surface), resulting in a significant improvement of the approximation to the many-body potential of mean force [T. Bereau and J. F. Rudzinski, Phys. Rev. Lett. 121, 256002 (2018)]. The present study first describes CG SH in more detail, through both a toy model and a three-bead model of hexane. We further extend the methodology to non-bonded interactions and report its impact on liquid properties. Finally, we investigate the transferability of the surfaces to distinct systems and thermodynamic state points, through a simple tuning of the state probabilities. In particular, applications to variations in temperature and chemical composition show good agreement with reference atomistic calculations, introducing a promising "weak-transferability regime," where CG force fields can be shared across thermodynamic and chemical neighborhoods. read less NOT USED (high confidence) G. P. P. Pun, V. Yamakov, J. Hickman, E. Glaessgen, and Y. Mishin, “Development of a general-purpose machine-learning interatomic potential for aluminum by the physically informed neural network method,” Physical Review Materials. 2020. link Times cited: 13 Abstract: Interatomic potentials constitute the key component of large… read moreAbstract: Interatomic potentials constitute the key component of large-scale atomistic simulations of materials. The recently proposed physically-informed neural network (PINN) method combines a high-dimensional regression implemented by an artificial neural network with a physics-based bond-order interatomic potential applicable to both metals and nonmetals. In this paper, we present a modified version of the PINN method that accelerates the potential training process and further improves the transferability of PINN potentials to unknown atomic environments. As an application, a modified PINN potential for Al has been developed by training on a large database of electronic structure calculations. The potential reproduces the reference first-principles energies within 2.6 meV per atom and accurately predicts a wide spectrum of physical properties of Al. Such properties include, but are not limited to, lattice dynamics, thermal expansion, energies of point and extended defects, the melting temperature, the structure and dynamic properties of liquid Al, the surface tensions of the liquid surface and the solid-liquid interface, and the nucleation and growth of a grain boundary crack. Computational efficiency of PINN potentials is also discussed. read less NOT USED (high confidence) A. Goscinski, G. Fraux, G. Imbalzano, and M. Ceriotti, “The role of feature space in atomistic learning,” Machine Learning: Science and Technology. 2020. link Times cited: 23 Abstract: Efficient, physically-inspired descriptors of the structure … read moreAbstract: Efficient, physically-inspired descriptors of the structure and composition of molecules and materials play a key role in the application of machine-learning techniques to atomistic simulations. The proliferation of approaches, as well as the fact that each choice of features can lead to very different behavior depending on how they are used, e.g. by introducing non-linear kernels and non-Euclidean metrics to manipulate them, makes it difficult to objectively compare different methods, and to address fundamental questions on how one feature space is related to another. In this work we introduce a framework to compare different sets of descriptors, and different ways of transforming them by means of metrics and kernels, in terms of the structure of the feature space that they induce. We define diagnostic tools to determine whether alternative feature spaces contain equivalent amounts of information, and whether the common information is substantially distorted when going from one feature space to another. We compare, in particular, representations that are built in terms of n-body correlations of the atom density, quantitatively assessing the information loss associated with the use of low-order features. We also investigate the impact of different choices of basis functions and hyperparameters of the widely used SOAP and Behler–Parrinello features, and investigate how the use of non-linear kernels, and of a Wasserstein-type metric, change the structure of the feature space in comparison to a simpler linear feature space. read less NOT USED (high confidence) T. Swinburne et al., “Anharmonic free energy of lattice vibrations in fcc crystals from a mean-field bond,” Physical Review B. 2020. link Times cited: 2 Abstract: It has recently been shown that the ab initio anharmonic fre… read moreAbstract: It has recently been shown that the ab initio anharmonic free energy of fcc crystals can be approximated to meV/atom accuracy by a lattice of anharmonic nearest-neighbor bonds, where the bonding potential can be efficiently parametrized from the target system. We develop a mean-field approach for the free energy of a general bond lattice, analytically accounting for strong bond-bond correlations while enforcing material compatibility and thermodynamic self-consistency. Applying our fundamentally anharmonic model to fcc crystals yields free energies within meV/atom of brute force thermodynamic integration for core seconds of computational effort. Potential applications of this approach in computational materials science are discussed. read less NOT USED (high confidence) A. Seko, “Machine learning potentials for multicomponent systems: The Ti-Al binary system,” Physical Review B. 2020. link Times cited: 13 Abstract: Machine learning potentials (MLPs) are becoming powerful too… read moreAbstract: Machine learning potentials (MLPs) are becoming powerful tools for performing accurate atomistic simulations and crystal structure optimizations. An approach to developing MLPs employs a systematic set of polynomial invariants including high-order ones to represent the neighboring atomic density. In this study, a formulation of the polynomial invariants is extended to the case of multicomponent systems. The extended formulation is more complex than the formulation for elemental systems. This study also shows its application to the Ti-Al binary system. As a result, an MLP with the lowest error and MLPs with high computational cost performance are selected from the many MLPs developed systematically. The predictive powers of the developed MLPs for many properties, such as the formation energy, elastic constants, thermodynamic properties, and mechanical properties, are examined. The MLPs exhibit high predictive power for the properties in a wide variety of ordered structures. The present scheme should be systematically applicable to other multicomponent systems. read less NOT USED (high confidence) G. Houchins and V. Viswanathan, “An accurate machine-learning calculator for optimization of Li-ion battery cathodes.,” The Journal of chemical physics. 2020. link Times cited: 36 Abstract: There is significant interest in improving the performance o… read moreAbstract: There is significant interest in improving the performance of batteries to increase electrification of transportation and aviation. Recently, performance improvements have been in large part due to changes in the composition of the cathode material family, LiNixMnyCo(1-x-y)O2 (e.g., 111-622-811). Despite the importance of these materials and tremendous progress with density functional theory (DFT) calculations in understanding basic design principles, it is computationally prohibitively expensive to make this problem tractable. Specifically, predicting the open circuit voltage for any cathode material in this family requires evaluation of stability in a quaternary phase space. In this work, we develop machine-learning potentials using fingerprinting based on atom-centered symmetry functions, used with a neural network model, trained on DFT calculations with a prediction accuracy of 3.7 meV/atom and 0.13 eV/Å for energy and force, respectively. We perform hyperparameter optimization of the fingerprinting parameters using Bayesian optimization through the Dragonfly package. Using this ML calculator, we first test its performance in predicting thermodynamic properties within the Debye-Grüneisen model and find good agreement for most thermodynamic properties, including the Gibbs free energy and entropy. Then, we use this to calculate the Li-vacancy ordering as a function of Li composition to simulate the process of discharging/charging of the cathode using grand canonical Monte Carlo simulations. The predicted voltage profiles are in good agreement with the experimental ones and provide an approach to rapidly perform design optimization in this phase space. This study serves as a proof-point of machine-learned DFT surrogates to enable battery materials optimization. read less NOT USED (high confidence) S. Cox, “Dielectric response with short-ranged electrostatics,” Proceedings of the National Academy of Sciences. 2020. link Times cited: 11 Abstract: Significance Much of a liquid’s ability to act as a solvent … read moreAbstract: Significance Much of a liquid’s ability to act as a solvent stems from its dielectric properties. The intermolecular forces between polar molecules can act over very long ranges, which complicates both theoretical descriptions and molecular simulations. Here the dielectric properties of a model system with only short-ranged intermolecular interactions are investigated, and this short-ranged model’s behavior is rationalized on a theoretical basis. This work will likely facilitate the development of both efficient short-ranged interaction potentials and our understanding of fluids under confinement. The dielectric nature of polar liquids underpins much of their ability to act as useful solvents, but its description is complicated by the long-ranged nature of dipolar interactions. This is particularly pronounced under the periodic boundary conditions commonly used in molecular simulations. In this article, the dielectric properties of a water model whose intermolecular electrostatic interactions are entirely short-ranged are investigated. This is done within the framework of local molecular-field theory (LMFT), which provides a well-controlled mean-field treatment of long-ranged electrostatics. This short-ranged model gives a remarkably good performance on a number of counts, and its apparent shortcomings are readily accounted for. These results not only lend support to LMFT as an approach for understanding solvation behavior, but also are relevant to those developing interaction potentials based on local descriptions of liquid structure. read less NOT USED (high confidence) Y. Zhang, S. Ye, J. Zhang, C. Hu, J. Jiang, and B. Jiang, “Efficient and Accurate Simulations of Vibrational and Electronic Spectra with Symmetry-Preserving Neural Network Models for Tensorial Properties.,” The journal of physical chemistry. B. 2020. link Times cited: 39 Abstract: Machine learning has revolutionized the high-dimensional rep… read moreAbstract: Machine learning has revolutionized the high-dimensional representations for molecular properties such as potential energy. However, there are scarce machine learning models targeting tensorial properties, which are rotationally covariant. Here, we propose tensorial neural network (NN) models to learn both tensorial response and transition properties in which atomic coordinate vectors are multiplied with scalar NN outputs or their derivatives to preserve the rotationally covariant symmetry. This strategy keeps structural descriptors symmetry invariant so that the resulting tensorial NN models are as efficient as their scalar counterparts. We validate the performance and universality of this approach by learning response properties of water oligomers and liquid water and transition dipole moment of a model structural unit of proteins. Machine-learned tensorial models have enabled efficient simulations of vibrational spectra of liquid water and ultraviolet spectra of realistic proteins, promising feasible and accurate spectroscopic simulations for biomolecules and materials. read less NOT USED (high confidence) G. Sivaraman et al., “Machine-learned interatomic potentials by active learning: amorphous and liquid hafnium dioxide,” npj Computational Materials. 2020. link Times cited: 97 NOT USED (high confidence) I. Novikov, K. Gubaev, E. Podryabinkin, and A. Shapeev, “The MLIP package: moment tensor potentials with MPI and active learning,” Machine Learning: Science and Technology. 2020. link Times cited: 220 Abstract: The subject of this paper is the technology (the ‘how’) of c… read moreAbstract: The subject of this paper is the technology (the ‘how’) of constructing machine-learning interatomic potentials, rather than science (the ‘what’ and ‘why’) of atomistic simulations using machine-learning potentials. Namely, we illustrate how to construct moment tensor potentials using active learning as implemented in the MLIP package, focusing on the efficient ways to automatically sample configurations for the training set, how expanding the training set changes the error of predictions, how to set up ab initio calculations in a cost-effective manner, etc. The MLIP package (short for Machine-Learning Interatomic Potentials) is available at https://mlip.skoltech.ru/download/. read less NOT USED (high confidence) J. Zhang et al., “A Perspective on Deep Learning for Molecular Modeling and Simulations.,” The journal of physical chemistry. A. 2020. link Times cited: 24 Abstract: Deep learning is transforming many areas in science, and it … read moreAbstract: Deep learning is transforming many areas in science, and it has great potential in modeling molecular systems. However, unlike the mature deployment of deep learning in computer vision and natural language processing, its development in molecular modeling and simulations is still at an early stage, largely because the inductive biases of molecules are completely different from those of images or texts. Footed on these differences, we first reviewed the limitations of traditional deep learning models from the perspective of molecular physics and wrapped up some relevant technical advancement at the interface between molecular modeling and deep learning. We do not focus merely on the ever more complex neural network models; instead, we introduce various useful concepts and ideas brought by modern deep learning. We hope that transacting these ideas into molecular modeling will create new opportunities. For this purpose, we summarized several representative applications, ranging from supervised to unsupervised and reinforcement learning, and discussed their connections with the emerging trends in deep learning. Finally, we give an outlook for promising directions which may help address the existing issues in the current framework of deep molecular modeling. read less NOT USED (high confidence) J. Nigam, S. Pozdnyakov, and M. Ceriotti, “Recursive evaluation and iterative contraction of N-body equivariant features.,” The Journal of chemical physics. 2020. link Times cited: 45 Abstract: Mapping an atomistic configuration to a symmetrized N-point … read moreAbstract: Mapping an atomistic configuration to a symmetrized N-point correlation of a field associated with the atomic positions (e.g., an atomic density) has emerged as an elegant and effective solution to represent structures as the input of machine-learning algorithms. While it has become clear that low-order density correlations do not provide a complete representation of an atomic environment, the exponential increase in the number of possible N-body invariants makes it difficult to design a concise and effective representation. We discuss how to exploit recursion relations between equivariant features of different order (generalizations of N-body invariants that provide a complete representation of the symmetries of improper rotations) to compute high-order terms efficiently. In combination with the automatic selection of the most expressive combination of features at each order, this approach provides a conceptual and practical framework to generate systematically improvable, symmetry adapted representations for atomistic machine learning. read less NOT USED (high confidence) A. Bills et al., “Universal Battery Performance and Degradation Model for Electric Aircraft,” ArXiv. 2020. link Times cited: 26 Abstract: In this work, we generate a battery performance and thermal … read moreAbstract: In this work, we generate a battery performance and thermal dataset specific to eVTOL use-cases and develop a fast and accurate performance and degradation model around that dataset. We use a machine-learning based physics-informed battery performance model to break the typically observed accuracy-computing cost trade-off. We fit the aging parameters for each cycle in a given cell's lifetime, and then model the evolution of those parameters using a new approach that combines traditional physics-based models, consisting of SEI film growth, charge loss, and Li Plating, along with a neural network in a universal ordinary differential equations (u-ODEs) framework. read less NOT USED (high confidence) Y. Zhang, C. Hu, and B. Jiang, “Accelerating atomistic simulations with piecewise machine-learned ab Initio potentials at a classical force field-like cost.,” Physical chemistry chemical physics : PCCP. 2020. link Times cited: 12 Abstract: Recently, machine learning methods have become easy-to-use t… read moreAbstract: Recently, machine learning methods have become easy-to-use tools for constructing high-dimensional interatomic potentials with ab initio accuracy. Although machine-learned interatomic potentials are generally orders of magnitude faster than first-principles calculations, they remain much slower than classical force fields, at the price of using more complex structural descriptors. To bridge this efficiency gap, we propose an embedded atom neural network approach with simple piecewise switching function-based descriptors, resulting in a favorable linear scaling with the number of neighbor atoms. Numerical examples validate that this piecewise machine-learning model can be over an order of magnitude faster than various popular machine-learned potentials with comparable accuracy for both metallic and covalent materials, approaching the speed of the fastest embedded atom method (i.e. several μs per atom per CPU core). The extreme efficiency of this approach promises its potential in first-principles atomistic simulations of very large systems and/or in a long timescale. read less NOT USED (high confidence) J. Byggmastar, K. Nordlund, and F. Djurabekova, “Gaussian approximation potentials for body-centered-cubic transition metals,” Physical Review Materials. 2020. link Times cited: 22 Abstract: We develop a set of machine-learning interatomic potentials … read moreAbstract: We develop a set of machine-learning interatomic potentials for elemental V, Nb, Mo, Ta, and W using the Gaussian approximation potential framework. The potentials show good accuracy and transferability for elastic, thermal, liquid, defect, and surface properties. All potentials are augmented with accurate repulsive potentials, making them applicable to radiation damage simulations involving high-energy collisions. We study melting and liquid properties in detail and use the potentials to provide melting curves up to 400 GPa for all five elements. read less NOT USED (high confidence) C. Zhai, T. Li, H. Shi, and J. Yeo, “Discovery and design of soft polymeric bio-inspired materials with multiscale simulations and artificial intelligence.,” Journal of materials chemistry. B. 2020. link Times cited: 28 Abstract: Materials chemistry is at the forefront of the global "… read moreAbstract: Materials chemistry is at the forefront of the global "Fourth Industrial Revolution", in part by establishing a "Materials 4.0" paradigm. A key aspect of this paradigm is developing methods to effectively integrate hardware, software, and biological systems. Towards this end, we must have intimate knowledge of the virtual space in materials design: materials omics (materiomics), materials informatics, computational modelling and simulations, artificial intelligence (AI), and big data. We focus on the discovery and design of next-generation bio-inspired materials because the design space is so huge as to be almost intractable. With nature providing researchers with specific guiding principles, this material design space may be probed most efficiently through digital, high-throughput methods. Therefore, to enhance awareness and adoption of digital approaches in soft polymeric bio-inspired materials discovery and design, we detail multiscale simulation techniques in soft matter from the molecular level to the macroscale. We also highlight the unique role that artificial intelligence and materials databases will play in molecular simulations as well as soft materials discovery. Finally, we showcase several case studies that concretely apply computational modelling and simulations for integrative soft bio-inspired materials design with experiments. read less NOT USED (high confidence) B. Jiang, J. Li, and H. Guo, “High-Fidelity Potential Energy Surfaces for Gas Phase and Gas-Surface Scattering Processes from Machine Learning.,” The journal of physical chemistry letters. 2020. link Times cited: 92 Abstract: In this Perspective, we review recent advances in constructi… read moreAbstract: In this Perspective, we review recent advances in constructing high-fidelity potential energy surfaces (PESs) from discrete ab initio points, using machine learning tools. Such PESs, albeit with substantial initial investments, provide significantly higher efficiency than direct dynamics methods and/or high accuracy at a level that is not affordable by on-the-fly approaches. These PESs not only are a necessity for quantum dynamical studies due to delocalization of wave packets, but also enable the study of low-probability and long-time events in (quasi-)classical treatments. Our focus here is on inelastic and reactive scattering processes, which are more challenging than bound systems because of the involvement of continua. Relevant applications and developments for dynamical processes in both the gas phase and at gas-surface interfaces are discussed. read less NOT USED (high confidence) M. Raeisi, B. Mortazavi, E. Podryabinkin, F. Shojaei, X. Zhuang, and A. Shapeev, “High thermal conductivity in semiconducting Janus and non-Janus diamanes,” Carbon. 2020. link Times cited: 35 NOT USED (high confidence) B. Onat, C. Ortner, and J. Kermode, “Sensitivity and dimensionality of atomic environment representations used for machine learning interatomic potentials.,” The Journal of chemical physics. 2020. link Times cited: 27 Abstract: Faithfully representing chemical environments is essential f… read moreAbstract: Faithfully representing chemical environments is essential for describing materials and molecules with machine learning approaches. Here, we present a systematic classification of these representations and then investigate (i) the sensitivity to perturbations and (ii) the effective dimensionality of a variety of atomic environment representations and over a range of material datasets. Representations investigated include atom centered symmetry functions, Chebyshev Polynomial Symmetry Functions (CHSF), smooth overlap of atomic positions, many-body tensor representation, and atomic cluster expansion. In area (i), we show that none of the atomic environment representations are linearly stable under tangential perturbations and that for CHSF, there are instabilities for particular choices of perturbation, which we show can be removed with a slight redefinition of the representation. In area (ii), we find that most representations can be compressed significantly without loss of precision and, further, that selecting optimal subsets of a representation method improves the accuracy of regression models built for a given dataset. read less NOT USED (high confidence) A. Tran, J. Tranchida, T. Wildey, and A. Thompson, “Multi-fidelity machine-learning with uncertainty quantification and Bayesian optimization for materials design: Application to ternary random alloys,” The Journal of chemical physics. 2020. link Times cited: 42 Abstract: We present a scale-bridging approach based on a multi-fideli… read moreAbstract: We present a scale-bridging approach based on a multi-fidelity (MF) machine-learning (ML) framework leveraging Gaussian processes (GP) to fuse atomistic computational model predictions across multiple levels of fidelity. Through the posterior variance of the MFGP, our framework naturally enables uncertainty quantification, providing estimates of confidence in the predictions. We used density functional theory as high-fidelity prediction, while a ML interatomic potential is used as low-fidelity prediction. Practical materials' design efficiency is demonstrated by reproducing the ternary composition dependence of a quantity of interest (bulk modulus) across the full aluminum-niobium-titanium ternary random alloy composition space. The MFGP is then coupled to a Bayesian optimization procedure, and the computational efficiency of this approach is demonstrated by performing an on-the-fly search for the global optimum of bulk modulus in the ternary composition space. The framework presented in this manuscript is the first application of MFGP to atomistic materials simulations fusing predictions between density functional theory and classical interatomic potential calculations. read less NOT USED (high confidence) S. Hajinazar, A. Thorn, E. Sandoval, S. Kharabadze, and A. Kolmogorov, “MAISE: Construction of neural network interatomic models and evolutionary structure optimization,” Comput. Phys. Commun. 2020. link Times cited: 21 NOT USED (high confidence) C. Mangold et al., “Transferability of neural network potentials for varying stoichiometry: Phonons and thermal conductivity of MnxGey compounds,” Journal of Applied Physics. 2020. link Times cited: 24 Abstract: Germanium manganese compounds exhibit a variety of stable an… read moreAbstract: Germanium manganese compounds exhibit a variety of stable and metastable phases with different stoichiometry. These materials entail interesting electronic, magnetic and thermal properties both in their bulk form and as heterostructures. Here we develop and validate a transferable machine learning potential, based on the high-dimensional neural network formalism, to enable the study of Mn$_x$Ge$_y$ materials over a wide range of compositions. We show that a neural network potential fitted on a minimal training set reproduces successfully the structural and vibrational properties and the thermal conductivity of systems with different local chemical environments, and it can be used to predict phononic effects in nanoscale heterostructures. read less NOT USED (high confidence) J. George, G. Hautier, A. Bartók, G. Csányi, and V. L. Deringer, “Combining phonon accuracy with high transferability in Gaussian approximation potential models.,” The Journal of chemical physics. 2020. link Times cited: 26 Abstract: Machine learning driven interatomic potentials, including Ga… read moreAbstract: Machine learning driven interatomic potentials, including Gaussian approximation potential (GAP) models, are emerging tools for atomistic simulations. Here, we address the methodological question of how one can fit GAP models that accurately predict vibrational properties in specific regions of configuration space while retaining flexibility and transferability to others. We use an adaptive regularization of the GAP fit that scales with the absolute force magnitude on any given atom, thereby exploring the Bayesian interpretation of GAP regularization as an "expected error" and its impact on the prediction of physical properties for a material of interest. The approach enables excellent predictions of phonon modes (to within 0.1 THz-0.2 THz) for structurally diverse silicon allotropes, and it can be coupled with existing fitting databases for high transferability across different regions of configuration space, which we demonstrate for liquid and amorphous silicon. These findings and workflows are expected to be useful for GAP-driven materials modeling more generally. read less NOT USED (high confidence) D. Zagaceta, H. Yanxon, and Q. Zhu, “Spectral neural network potentials for binary alloys,” Journal of Applied Physics. 2020. link Times cited: 4 Abstract: In this work, we present a numerical implementation to compu… read moreAbstract: In this work, we present a numerical implementation to compute the atom centered descriptors introduced by Bartok et al (Phys. Rev. B, 87, 184115, 2013) based on the harmonic analysis of the atomic neighbor density function. Specifically, we focus on two types of descriptors, the smooth SO(3) power spectrum with the explicit inclusion of a radial basis and the SO(4) bispectrum obtained through mapping the radial component onto a polar angle of a four dimensional hypersphere. With these descriptors, various interatomic potentials for binary Ni-Mo alloys are obtained based on linear and neural network regression models. Numerical experiments suggest that both descriptors produce similar results in terms of accuracy. For linear regression, the smooth SO(3) power spectrum is superior to the SO(4) bispectrum when a large band limit is used. In neural network regression, a better accuracy can be achieved with even less number of expansion components for both descriptors. As such, we demonstrate that spectral neural network potentials are feasible choices for large scale atomistic simulation. read less NOT USED (high confidence) A. Shapeev, E. Podryabinkin, K. Gubaev, F. Tasn’adi, and I. Abrikosov, “Elinvar effect in β-Ti simulated by on-the-fly trained moment tensor potential,” New Journal of Physics. 2020. link Times cited: 20 Abstract: A combination of quantum mechanics calculations with machine… read moreAbstract: A combination of quantum mechanics calculations with machine learning techniques can lead to a paradigm shift in our ability to predict materials properties from first principles. Here we show that on-the-fly training of an interatomic potential described through moment tensors provides the same accuracy as state-of-the-art ab initio molecular dynamics in predicting high-temperature elastic properties of materials with two orders of magnitude less computational effort. Using the technique, we investigate high-temperature bcc phase of titanium and predict very weak, Elinvar, temperature dependence of its elastic moduli, similar to the behavior of the so-called GUM Ti-based alloys (Sato et al 2003 Science 300 464). Given the fact that GUM alloys have complex chemical compositions and operate at room temperature, Elinvar properties of elemental bcc-Ti observed in the wide temperature interval 1100–1700 K is unique. read less NOT USED (high confidence) K. Kwac and M. Cho, “Machine learning approach for describing vibrational solvatochromism.,” The Journal of chemical physics. 2020. link Times cited: 10 Abstract: Machine learning is becoming a more and more versatile tool … read moreAbstract: Machine learning is becoming a more and more versatile tool describing condensed matter systems. Here, we employ the feed-forward and the convolutional neural networks to describe the frequency shifts of the amide I mode vibration of N-methylacetamide (NMA) in water. For a given dataset of configurations of an NMA molecule solvated by water, we obtained comparable or improved results for describing vibrational solvatochromic frequency shift with the neural network approach, compared to the previously developed differential evolution algorithm approach. We compared the performance of the atom centered symmetry functions (ACSFs) and simple polynomial functions as descriptors for the solvated system and found that the polynomial function performs better than the ACSFs employed in the description of the amide I vibrational solvatochromism. read less NOT USED (high confidence) J. Zhang et al., “A Perspective on Deep Learning for Molecular Modeling and Simulations,” The journal of physical chemistry. B. 2020. link Times cited: 5 Abstract: Deep learning is transforming many areas in science, and it … read moreAbstract: Deep learning is transforming many areas in science, and it has great potential in modeling molecular systems. However, unlike the mature deployment of deep learning in computer vision and natural language processing, its development in molecular modeling and simulations is still at an early stage, largely because the inductive biases of molecules are completely different from those of images or texts. Footed on these differences, we first reviewed the limitations of traditional deep learning models from the perspective of molecular physics, and wrapped up some relevant technical advancement at the interface between molecular modeling and deep learning. We do not focus merely on the ever more complex neural network models, instead, we introduce various useful concepts and ideas brought by modern deep learning. We hope that transacting these ideas into molecular modeling will create new opportunities. For this purpose, we summarized several representative applications, ranging from supervised to unsupervised and reinforcement learning, and discussed their connections with the emerging trends in deep learning. Finally, we outlook promising directions which may help address the existing issues in the current framework of deep molecular modeling. read less NOT USED (high confidence) J. Noh, G. H. Gu, S. Kim, and Y. Jung, “Machine-enabled inverse design of inorganic solid materials: promises and challenges,” Chemical Science. 2020. link Times cited: 65 Abstract: Developing high-performance advanced materials requires a de… read moreAbstract: Developing high-performance advanced materials requires a deeper insight and search into the chemical space. Until recently, exploration of materials space using chemical intuitions built upon existing materials has been the general strategy, but this direct design approach is often time and resource consuming and poses a significant bottleneck to solve the materials challenges of future sustainability in a timely manner. To accelerate this conventional design process, inverse design, which outputs materials with pre-defined target properties, has emerged as a significant materials informatics platform in recent years by leveraging hidden knowledge obtained from materials data. Here, we summarize the latest progress in machine-enabled inverse materials design categorized into three strategies: high-throughput virtual screening, global optimization, and generative models. We analyze challenges for each approach and discuss gaps to be bridged for further accelerated and rational data-driven materials design. read less NOT USED (high confidence) P. Gkeka et al., “Machine learning force fields and coarse-grained variables in molecular dynamics: application to materials and biological systems.,” Journal of chemical theory and computation. 2020. link Times cited: 96 Abstract: Machine learning encompasses a set of tools and algorithms w… read moreAbstract: Machine learning encompasses a set of tools and algorithms which are now becoming popular in almost all scientific and technological fields. This is true for molecular dynamics as well, where machine learning offers promises of extracting valuable information from the enormous amounts of data generated by simulation of complex systems. We provide here a review of our current understanding of goals, benefits, and limitations of machine learning techniques for computational studies on atomistic systems, focusing on the construction of empirical force fields from ab-initio databases and the determination of reaction coordinates for free energy computation and enhanced sampling. read less NOT USED (high confidence) R. Batra and S. Sankaranarayanan, “Machine learning for multi-fidelity scale bridging and dynamical simulations of materials,” Journal of Physics: Materials. 2020. link Times cited: 12 Abstract: Molecular dynamics (MD) is a powerful and popular tool for u… read moreAbstract: Molecular dynamics (MD) is a powerful and popular tool for understanding the dynamical evolution of materials at the nano and mesoscopic scales. There are various flavors of MD ranging from the high fidelity albeit computationally expensive ab initio MD to relatively lower fidelity but much more efficient classical MD such as atomistic and coarse-grained models. Each of these different flavors of MD have been independently used by materials scientists to bring about breakthroughs in materials discovery and design. A significant gulf exists between the various MD flavors, each having varying levels of fidelity. The accuracy of DFT or ab initio MD is generally much higher than that of classical atomistic simulations which is higher than that of coarse-grained models. Multi-fidelity scale bridging to combine the accuracy and flexibility of ab initio MD with efficiency classical MD has been a longstanding goal. The advent of big-data analytics has brought to the forefront powerful machine learning methods that can be deployed to achieve this goal. Here, we provide our perspective on the challenges in multi-fidelity scale bridging and trace the developments leading up to the use of machine learning algorithms and data-science towards addressing this grand challenge. read less NOT USED (high confidence) M. F. Langer, A. Goessmann, and M. Rupp, “Representations of molecules and materials for interpolation of quantum-mechanical simulations via machine learning,” npj Computational Materials. 2020. link Times cited: 64 NOT USED (high confidence) M. Cusentino, M. Wood, and A. Thompson, “Explicit Multi-element Extension of the Spectral Neighbor Analysis Potential for Chemically Complex Systems.,” The journal of physical chemistry. A. 2020. link Times cited: 35 Abstract: A natural extension of the descriptors used in the Spectral … read moreAbstract: A natural extension of the descriptors used in the Spectral Neighbor Analysis Potential (SNAP) method is derived to treat atomic interactions in chemically complex systems. Atomic environment descriptors within SNAP are obtained from a basis function expansion of the weighted density of neighboring atoms. This new formulation instead partitions the neighbor density into partial densities for each chemical element, thus leading to explicit multi-element descriptors. For Nelem chemical elements, the number of descriptors increases as Ο(Nelem3), while the computational cost of the force calculation as implemented in LAMMPS is limited to Ο(Nelem2) and the favorable linear scaling in the number of atoms is retained. We demonstrate these chemically aware descriptors by producing an interatomic potential for indium phosphide capable of capturing high-energy defects that result from radiation damage cascades. This new explicit multi-element SNAP method reproduces the relaxed defect formation energies with substantially greater accuracy than weighted-density SNAP, while retaining accurate representation of the bulk indium phosphide properties. read less NOT USED (high confidence) M. Karabin and D. Perez, “An entropy-maximization approach to automated training set generation for interatomic potentials.,” The Journal of chemical physics. 2020. link Times cited: 17 Abstract: Machine learning-based interatomic potentials are currently … read moreAbstract: Machine learning-based interatomic potentials are currently garnering a lot of attention as they strive to achieve the accuracy of electronic structure methods at the computational cost of empirical potentials. Given their generic functional forms, the transferability of these potentials is highly dependent on the quality of the training set, the generation of which can be highly labor-intensive. Good training sets should at once contain a very diverse set of configurations while avoiding redundancies that incur cost without providing benefits. We formalize these requirements in a local entropy-maximization framework and propose an automated sampling scheme to sample from this objective function. We show that this approach generates much more diverse training sets than unbiased sampling and is competitive with hand-crafted training sets. read less NOT USED (high confidence) A. V. der Ven, Z. Deng, S. Banerjee, and S. Ong, “Rechargeable Alkali-Ion Battery Materials: Theory and Computation.,” Chemical reviews. 2020. link Times cited: 116 Abstract: Since its development in the 1970s, the rechargeable alkali-… read moreAbstract: Since its development in the 1970s, the rechargeable alkali-ion battery has proven to be a truly transformative technology, providing portable energy storage for devices ranging from small portable electronics to sizable electric vehicles. Here, we present a review of modern theoretical and computational approaches to the study and design of rechargeable alkali-ion battery materials. Starting from fundamental thermodynamics and kinetics phenomenological equations, we rigorously derive the theoretical relationships for key battery properties, such as voltage, capacity, alkali diffusivity, and other electrochemically relevant computable quantities. We then present an overview of computational techniques for the study of rechargeable alkali-ion battery materials, followed by a critical review of the literature applying these techniques to yield crucial insights into battery operation and performance. Finally, we provide perspectives on outstanding challenges and opportunities in the theory and computation of rechargeable alkali-ion battery materials. read less NOT USED (high confidence) S. Desai, S. Reeve, and J. Belak, “Implementing a neural network interatomic model with performance portability for emerging exascale architectures,” Comput. Phys. Commun. 2020. link Times cited: 9 NOT USED (high confidence) B. Mortazavi et al., “Exploring phononic properties of two-dimensional materials using machine learning interatomic potentials,” arXiv: Materials Science. 2020. link Times cited: 111 NOT USED (high confidence) H. Yanxon, D. Zagaceta, B. Wood, and Q. Zhu, “Neural network potential from bispectrum components: A case study on crystalline silicon.,” The Journal of chemical physics. 2020. link Times cited: 13 Abstract: In this article, we present a systematic study on developing… read moreAbstract: In this article, we present a systematic study on developing machine learning force fields (MLFFs) for crystalline silicon. While the main-stream approach of fitting a MLFF is to use a small and localized training set from molecular dynamics simulations, it is unlikely to cover the global features of the potential energy surface. To remedy this issue, we used randomly generated symmetrical crystal structures to train a more general Si-MLFF. Furthermore, we performed substantial benchmarks among different choices of material descriptors and regression techniques on two different sets of silicon data. Our results show that neural network potential fitting with bispectrum coefficients as descriptors is a feasible method for obtaining accurate and transferable MLFFs. read less NOT USED (high confidence) X.-G. Li, C. Chen, H. Zheng, Y. Zuo, and S. Ong, “Complex strengthening mechanisms in the NbMoTaW multi-principal element alloy,” npj Computational Materials. 2019. link Times cited: 114 NOT USED (high confidence) S. Pozdnyakov, A. Oganov, E. Mazhnik, A. Mazitov, and I. Kruglov, “Fast general two- and three-body interatomic potential,” Physical Review B. 2019. link Times cited: 6 Abstract: We introduce a new class of machine learning interatomic pot… read moreAbstract: We introduce a new class of machine learning interatomic potentials - fast General Two- and Three-body Potential (GTTP) which are as fast as conventional empirical potentials and require computational time that remains constant with increasing fitting flexibility. GTTP does not contain any assumptions about functional form of two- and three-body interactions. These interactions can be modeled arbitrarily accurately potentially by thousands of parameters not affecting resulting computational cost. Time complexity is O(1) per every considered pair or triple of atoms. The fitting procedure is reduced to simple linear regression on ab initio calculated energies and forces and leads to effective two- and three-body potential which reproduces quantum many-body interactions as accurately as possible. Our potential can be made continuously differentiable any number of times at the expense of increased computational time. We made a number of performance tests on one-, two- and three-component systems. Flexibility of the introduced approach makes the potential transferable in terms of size and type of atomic systems. We show, that trained on randomly generated structures with just 8 atoms in the unit cell, it significantly outperforms common empirical interatomic potentials in the study of large systems, such as grain boundaries in polycrystalline materials. read less NOT USED (high confidence) J. Lam, S. Abdul-Al, and A. Allouche, “Combining quantum mechanics and machine-learning calculations for anharmonic corrections to vibrational frequencies.,” Journal of chemical theory and computation. 2019. link Times cited: 9 Abstract: Several methods are available to compute the anharmonicity i… read moreAbstract: Several methods are available to compute the anharmonicity in semi-rigid molecules. However, such methods are not routinely employed yet because of their large computational cost, especially for large molecules. The potential energy surface is required and generally approximated by a quartic force field potential based on ab initio calculation, thus limiting this approach to medium-sized molecules. We developed a new, fast and accurate hybrid Quantum Mechanic/Machine learning (QM//ML) approach to reduce the computational time for large systems. With this novel approach, we evaluated anharmonic frequencies of 37 molecules thus covering a broad range of vibrational modes and chemical environments. The obtained fundamental frequencies reproduce results obtained using B2PLYP/def2tzvpp with a root-mean-square deviation (RMSD) of 21 cm-1 and experimental results with a RMSD of 23 cm-1. Along with this very good accuracy, the computational time with our hybrid QM//ML approach scales linearly with N while the traditional full ab initio method scales as N2 where N is the number of atoms. read less NOT USED (high confidence) X. Qian, S. Peng, X. Li, Y. Wei, and R. Yang, “Thermal conductivity modeling using machine learning potentials: application to crystalline and amorphous silicon,” Materials Today Physics. 2019. link Times cited: 53 NOT USED (high confidence) C. M. Andolina and W. Saidi, “Highly transferable atomistic machine-learning potentials from curated and compact datasets across the periodic table,” Digital Discovery. 2023. link Times cited: 2 Abstract: Machine learning atomistic potentials (MLPs) trained using d… read moreAbstract: Machine learning atomistic potentials (MLPs) trained using density functional theory (DFT) datasets allow for the modeling of complex material properties with near-DFT accuracy while imposing a fraction of its computational cost. read less NOT USED (high confidence) Y. Yang et al., “Taking materials dynamics to new extremes using machine learning interatomic potentials,” Journal of Materials Informatics. 2021. link Times cited: 5 Abstract: Understanding materials dynamics under extreme conditions of… read moreAbstract: Understanding materials dynamics under extreme conditions of pressure, temperature, and strain rate is a scientific quest that spans nearly a century. Atomic simulations have had a considerable impact on this endeavor because of their ability to uncover materials’ microstructure evolution and properties at the scale of the relevant physical phenomena. However, this is still a challenge for most materials as it requires modeling large atomic systems (up to millions of particles) with improved accuracy. In many cases, the availability of sufficiently accurate but efficient interatomic potentials has become a serious bottleneck for performing these simulations as traditional potentials fail to represent the multitude of bonding. A new class of potentials has emerged recently, based on a different paradigm from the traditional approach. The new potentials are constructed by machinelearning with a high degree of fidelity from quantum-mechanical calculations. In this review, a brief introduction to the central ideas underlying machine learning interatomic potentials is given. In particular, the coupling of machine learning models with domain knowledge to improve accuracy, computational efficiency, and interpretability is highlighted. Subsequently, we demonstrate the effectiveness of the domain knowledge-based approach in certain select problems related to the kinetic response of warm dense materials. It is hoped that this review will inspire further advances in the understanding of matter under extreme conditions. read less NOT USED (high confidence) E. M. Gavilán-Arriazu, M. Mercer, D. Barraco, H. Hoster, and E. Leiva, “Kinetic Monte Carlo simulations applied to Li-ion and post Li-ion batteries: a key link in the multi-scale chain,” Progress in Energy. 2021. link Times cited: 17 Abstract: Since 1994, Kinetic Monte Carlo (kMC) has been applied to th… read moreAbstract: Since 1994, Kinetic Monte Carlo (kMC) has been applied to the study of Li-ion batteries and has demonstrated to be a remarkable simulation tool to properly describe the physicochemical processes involved, on the atomistic scale and over long time scales. With the growth of computing power and the widespread use of lithium-based storage systems, more contributions from theoretical studies have been requested. This has led to a remarkable growth of theoretical publications on Li-ion batteries; kMC has been one of the preferred techniques to study these systems. Despite the advantages it presents, kMC has not yet been fully exploited in the field of lithium-ion batteries (LIBs) and its impact in this field is increasing exponentially. In this review, we summarize the most important applications of kMC to the study of LIBs and then comment on the state-of-the-art and prospects for the future of this technique, in the context of multi-scale modeling. We also briefly discuss the prospects for applying kMC to post lithium-ion chemistries such as lithium-sulfur and lithium-air. Video Abstract: Kinetic Monte Carlo simulations applied to Li-ion and post Li-ion batteries: a key link in the multi-scale chain read less |
 SNAP_ZuoChenLi_2019quadratic_Mo__MO_692442138123_000