 SW_MX2_WenShirodkarPlechac_2017_MoS__MO_201919462778_001
| Title
A single sentence description.
|
Modified Stillinger-Weber potential (MX2) for monolayer MoS2 developed by Wen et al. (2017) v001 |
|---|---|
| Description
A short description of the Model describing its key features including for example: type of model (pair potential, 3-body potential, EAM, etc.), modeled species (Ac, Ag, ..., Zr), intended purpose, origin, and so on.
|
Two-dimensional molybdenum disulfide (MoS2) is a promising material for the next generation of switchable transistors and photodetectors. In order to perform large-scale molecular simulations of the mechanical and thermal behavior of MoS2-based devices, an accurate interatomic potential is required. To this end, we have developed a Stillinger-Weber potential for monolayer MoS2. The potential parameters are optimized to reproduce the geometry (bond lengths and bond angles) of MoS2 in its equilibrium state and to match as closely as possible the forces acting on the atoms along a dynamical trajectory obtained from ab initio molecular dynamics. Verification calculations indicate that the new potential accurately predicts important material properties including the strain dependence of the cohesive energy, the elastic constants, and the linear thermal expansion coefficient. The uncertainty in the potential parameters is determined using a Fisher information theory analysis. It is found that the parameters are fully identified, and none are redundant. In addition, the Fisher information matrix provides uncertainty bounds for predictions of the potential for new properties. As an example, bounds on the average vibrational thickness of a MoS2 monolayer at finite temperature are computed and found to be consistent with the results from a molecular dynamics simulation. |
| Species
The supported atomic species.
| Mo, S |
| Disclaimer
A statement of applicability provided by the contributor, informing users of the intended use of this KIM Item.
|
This model is designed for two-dimensional (2D) monolayer molybdenum disulfide (MoS2). It is not appropriate for bulk MoS2 or other compounds of Mo and/or S. |
| Contributor |
Mingjian Wen |
| Maintainer |
Mingjian Wen |
| Developer |
Mingjian Wen Sharmila N. Shirodkar Petr Plechac Ryan S. Elliott Efthimios Kaxiras Ellad B. Tadmor |
| Published on KIM | 2018 |
| How to Cite |
This Model originally published in [1] is archived in OpenKIM [2-5]. [1] Wen M, Shirodkar SN, Plecháč P, Kaxiras E, Elliott RS, Tadmor EB. A force-matching Stillinger-Weber potential for MoS_2: Parameterization and Fisher information theory based sensitivity analysis. Journal of Applied Physics. 2017;122(24):244301. doi:10.1063/1.5007842 — (Primary Source) A primary source is a reference directly related to the item documenting its development, as opposed to other sources that are provided as background information. [2] Wen M, Shirodkar SN, Plechac P, Elliott RS, Kaxiras E, Tadmor EB. Modified Stillinger-Weber potential (MX2) for monolayer MoS2 developed by Wen et al. (2017) v001. OpenKIM; 2018. doi:10.25950/eeedbbc4 [3] Wen M, Tadmor EB, Elliott RS, Shirodkar SN, Plechac P, Kaxiras E. Stillinger-Weber Model Driver for Monolayer MX2 systems v001. OpenKIM; 2018. doi:10.25950/7d664757 [4] Tadmor EB, Elliott RS, Sethna JP, Miller RE, Becker CA. The potential of atomistic simulations and the Knowledgebase of Interatomic Models. JOM. 2011;63(7):17. doi:10.1007/s11837-011-0102-6 [5] Elliott RS, Tadmor EB. Knowledgebase of Interatomic Models (KIM) Application Programming Interface (API). OpenKIM; 2011. doi:10.25950/ff8f563a Click here to download the above citation in BibTeX format. |
| Citations
This panel presents information regarding the papers that have cited the interatomic potential (IP) whose page you are on. The OpenKIM machine learning based Deep Citation framework is used to determine whether the citing article actually used the IP in computations (denoted by "USED") or only provides it as a background citation (denoted by "NOT USED"). For more details on Deep Citation and how to work with this panel, click the documentation link at the top of the panel. The word cloud to the right is generated from the abstracts of IP principle source(s) (given below in "How to Cite") and the citing articles that were determined to have used the IP in order to provide users with a quick sense of the types of physical phenomena to which this IP is applied. The bar chart shows the number of articles that cited the IP per year. Each bar is divided into green (articles that USED the IP) and blue (articles that did NOT USE the IP). Users are encouraged to correct Deep Citation errors in determination by clicking the speech icon next to a citing article and providing updated information. This will be integrated into the next Deep Citation learning cycle, which occurs on a regular basis. OpenKIM acknowledges the support of the Allen Institute for AI through the Semantic Scholar project for providing citation information and full text of articles when available, which are used to train the Deep Citation ML algorithm. |
This panel provides information on past usage of this interatomic potential (IP) powered by the OpenKIM Deep Citation framework. The word cloud indicates typical applications of the potential. The bar chart shows citations per year of this IP (bars are divided into articles that used the IP (green) and those that did not (blue)). The complete list of articles that cited this IP is provided below along with the Deep Citation determination on usage. See the Deep Citation documentation for more information. 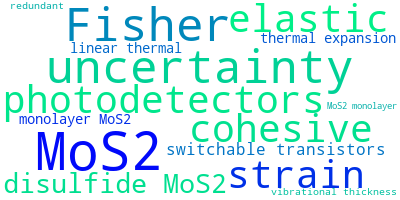
20 Citations (7 used)
Help us to determine which of the papers that cite this potential actually used it to perform calculations. If you know, click the .
USED (high confidence) B. Waters, D. S. Karls, I. Nikiforov, R. Elliott, E. Tadmor, and B. Runnels, “Automated determination of grain boundary energy and potential-dependence using the OpenKIM framework,” Computational Materials Science. 2022. link Times cited: 5 USED (high confidence) S. Chaudhuri, A. Bhattacharya, A. K. Das, G. P. Das, and B. Dev, “Strain driven anomalous anisotropic enhancement in the thermoelectric performance of monolayer MoS2,” Applied Surface Science. 2022. link Times cited: 6 USED (low confidence) Y. Dong, Y. Ding, Z. Rui, W. Hui, and F. Lian, “Unexpected Nonmonotonic Dependence of Phononic Friction on Biaxial Strain Between MoS2 Layers,” Tribology Letters. 2023. link Times cited: 0 USED (low confidence) F. Saiz, “Molybdenum disulfide under extreme conditions: An ab initio study on its melting,” Journal of Applied Physics. 2023. link Times cited: 0 Abstract: Crystalline molybdenum disulfide has become a central actor … read more USED (low confidence) A. T. Sose, E. Mohammadi, F. Wang, and S. A. Deshmukh, “Investigation of structure and dynamics of water confined between hybrid layered materials of graphene, boron nitride, and molybdenum disulfide,” Journal of Materials Science. 2022. link Times cited: 4 USED (low confidence) W. Kuś, M. J. Akhter, and T. Burczynski, “Optimization of Monolayer MoS2 with Prescribed Mechanical Properties,” Materials. 2022. link Times cited: 1 Abstract: Various technological challenges are essentially material pr… read more USED (low confidence) Y. Zhu, P. Sreeramagir, and G. Balasubramanian, “Examining the effect of flake orientation on the hydrophilicity of MoS2 by molecular simulations,” Chemical Physics Letters. 2021. link Times cited: 0 NOT USED (low confidence) G. Wang et al., “Recent advances in the mechanics of 2D materials,” International Journal of Extreme Manufacturing. 2023. link Times cited: 7 Abstract: The exceptional physical properties and unique layered struc… read more NOT USED (low confidence) M. C. Abbott and B. Machta, “Far from Asymptopia: Unbiased High-Dimensional Inference Cannot Assume Unlimited Data,” Entropy. 2022. link Times cited: 1 Abstract: Inference from limited data requires a notion of measure on … read more NOT USED (low confidence) Z. Wei, C. Zhang, Y. Kan, Y. Zhang, and Y. Chen, “Developing machine learning potential for classical molecular dynamics simulation with superior phonon properties,” Computational Materials Science. 2022. link Times cited: 1 NOT USED (low confidence) Y. Choi et al., “CHARMM-GUI Nanomaterial Modeler for Modeling and Simulation of Nanomaterial Systems.,” Journal of chemical theory and computation. 2021. link Times cited: 38 Abstract: Molecular modeling and simulation are invaluable tools for n… read more NOT USED (high confidence) H. Jin, E. Zhang, and H. Espinosa, “Recent Advances and Applications of Machine Learning in Experimental Solid Mechanics: A Review,” ArXiv. 2023. link Times cited: 6 Abstract:
For many decades, experimental solid mechanics has played … read more NOT USED (high confidence) Y. Kurniawan et al., “Extending OpenKIM with an Uncertainty Quantification Toolkit for Molecular Modeling,” 2022 IEEE 18th International Conference on e-Science (e-Science). 2022. link Times cited: 0 Abstract: Atomistic simulations are an important tool in materials mod… read more NOT USED (high confidence) U. Yadav and S. Ghosh, “An atomistic-based finite deformation continuum membrane model for monolayer Transition Metal Dichalcogenides,” Journal of the Mechanics and Physics of Solids. 2022. link Times cited: 0 NOT USED (high confidence) Y. Kurniawan et al., “Bayesian, frequentist, and information geometric approaches to parametric uncertainty quantification of classical empirical interatomic potentials.,” The Journal of chemical physics. 2021. link Times cited: 6 Abstract: In this paper, we consider the problem of quantifying parame… read more NOT USED (high confidence) K. N. Quinn, M. C. Abbott, M. Transtrum, B. Machta, and J. Sethna, “Information geometry for multiparameter models: new perspectives on the origin of simplicity,” Reports on Progress in Physics. 2021. link Times cited: 18 Abstract: Complex models in physics, biology, economics, and engineeri… read more NOT USED (high confidence) M. Wen, Y. Afshar, R. Elliott, and E. Tadmor, “KLIFF: A framework to develop physics-based and machine learning interatomic potentials,” Comput. Phys. Commun. 2021. link Times cited: 12 NOT USED (high confidence) X. Zhang, H. Nguyen, J. T. Paci, S. Sankaranarayanan, J. L. Mendoza-Cortes, and H. Espinosa, “Multi-objective parametrization of interatomic potentials for large deformation pathways and fracture of two-dimensional materials,” npj Computational Materials. 2021. link Times cited: 11 |
| Funding |
Award Title: Multiscale Mathematical Modeling and Design Realization of Novel 2D Functional Materials Award Number: W911NF-14-1-0247 Funder: Army Research Office Award Title: CDI-Type II: The Knowledge-Base of Interatomic Models (KIM) Award Number: PHY-0941493 Award URI: https://www.nsf.gov/awardsearch/showAward?AWD_ID=0941493 Funder: National Science Foundation Award Title: CDS&E: Systematic Multiscale Modeling using the Knowledgebase of Interatomic Models (KIM) Award Number: DMR-1408211 Award URI: https://www.nsf.gov/awardsearch/showAward?AWD_ID=1408211 Funder: National Science Foundation Award Title: XSEDE: eXtreme Science and Engineering Discovery Environment Award Number: ACI-1053575 Award URI: https://www.nsf.gov/awardsearch/showAward?AWD_ID=1053575 Funder: National Science Foundation |
| Short KIM ID
The unique KIM identifier code.
| MO_201919462778_001 |
| Extended KIM ID
The long form of the KIM ID including a human readable prefix (100 characters max), two underscores, and the Short KIM ID. Extended KIM IDs can only contain alpha-numeric characters (letters and digits) and underscores and must begin with a letter.
| SW_MX2_WenShirodkarPlechac_2017_MoS__MO_201919462778_001 |
| DOI |
10.25950/eeedbbc4 https://doi.org/10.25950/eeedbbc4 https://commons.datacite.org/doi.org/10.25950/eeedbbc4 |
| KIM Item Type
Specifies whether this is a Portable Model (software implementation of an interatomic model); Portable Model with parameter file (parameter file to be read in by a Model Driver); Model Driver (software implementation of an interatomic model that reads in parameters).
| Portable Model using Model Driver SW_MX2__MD_242389978788_001 |
| Driver | SW_MX2__MD_242389978788_001 |
| KIM API Version | 2.0 |
| Potential Type | sw |
| Previous Version | SW_MX2_WenShirodkarPlechac_2017_MoS__MO_201919462778_000 |
| Grade | Name | Category | Brief Description | Full Results | Aux File(s) |
|---|---|---|---|---|---|
| P | vc-species-supported-as-stated | mandatory | The model supports all species it claims to support; see full description. |
Results | Files |
| P | vc-periodicity-support | mandatory | Periodic boundary conditions are handled correctly; see full description. |
Results | Files |
| P | vc-permutation-symmetry | mandatory | Total energy and forces are unchanged when swapping atoms of the same species; see full description. |
Results | Files |
| A | vc-forces-numerical-derivative | consistency | Forces computed by the model agree with numerical derivatives of the energy; see full description. |
Results | Files |
| P | vc-dimer-continuity-c1 | informational | The energy versus separation relation of a pair of atoms is C1 continuous (i.e. the function and its first derivative are continuous); see full description. |
Results | Files |
| P | vc-objectivity | informational | Total energy is unchanged and forces transform correctly under rigid-body translation and rotation; see full description. |
Results | Files |
| P | vc-inversion-symmetry | informational | Total energy is unchanged and forces change sign when inverting a configuration through the origin; see full description. |
Results | Files |
| P | vc-memory-leak | informational | The model code does not have memory leaks (i.e. it releases all allocated memory at the end); see full description. |
Results | Files |
| P | vc-thread-safe | mandatory | The model returns the same energy and forces when computed in serial and when using parallel threads for a set of configurations. Note that this is not a guarantee of thread safety; see full description. |
Results | Files |
| P | vc-unit-conversion | mandatory | The model is able to correctly convert its energy and/or forces to different unit sets; see full description. |
Results | Files |
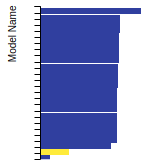
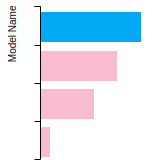
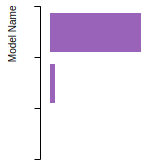
BCC Lattice Constant
This bar chart plot shows the mono-atomic body-centered cubic (bcc) lattice constant predicted by the current model (shown in the unique color) compared with the predictions for all other models in the OpenKIM Repository that support the species. The vertical bars show the average and standard deviation (one sigma) bounds for all model predictions. Graphs are generated for each species supported by the model.
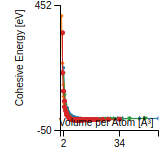
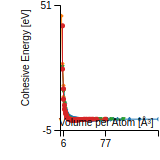
Cohesive Energy Graph
This graph shows the cohesive energy versus volume-per-atom for the current mode for four mono-atomic cubic phases (body-centered cubic (bcc), face-centered cubic (fcc), simple cubic (sc), and diamond). The curve with the lowest minimum is the ground state of the crystal if stable. (The crystal structure is enforced in these calculations, so the phase may not be stable.) Graphs are generated for each species supported by the model.
Diamond Lattice Constant
This bar chart plot shows the mono-atomic face-centered diamond lattice constant predicted by the current model (shown in the unique color) compared with the predictions for all other models in the OpenKIM Repository that support the species. The vertical bars show the average and standard deviation (one sigma) bounds for all model predictions. Graphs are generated for each species supported by the model.
Dislocation Core Energies
This graph shows the dislocation core energy of a cubic crystal at zero temperature and pressure for a specific set of dislocation core cutoff radii. After obtaining the total energy of the system from conjugate gradient minimizations, non-singular, isotropic and anisotropic elasticity are applied to obtain the dislocation core energy for each of these supercells with different dipole distances. Graphs are generated for each species supported by the model.
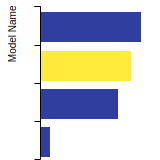
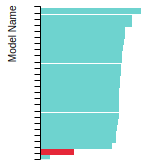
(No matching species)FCC Elastic Constants
This bar chart plot shows the mono-atomic face-centered cubic (fcc) elastic constants predicted by the current model (shown in blue) compared with the predictions for all other models in the OpenKIM Repository that support the species. The vertical bars show the average and standard deviation (one sigma) bounds for all model predictions. Graphs are generated for each species supported by the model.
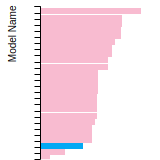
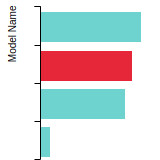
FCC Lattice Constant
This bar chart plot shows the mono-atomic face-centered cubic (fcc) lattice constant predicted by the current model (shown in red) compared with the predictions for all other models in the OpenKIM Repository that support the species. The vertical bars show the average and standard deviation (one sigma) bounds for all model predictions. Graphs are generated for each species supported by the model.
FCC Stacking Fault Energies
This bar chart plot shows the intrinsic and extrinsic stacking fault energies as well as the unstable stacking and unstable twinning energies for face-centered cubic (fcc) predicted by the current model (shown in blue) compared with the predictions for all other models in the OpenKIM Repository that support the species. The vertical bars show the average and standard deviation (one sigma) bounds for all model predictions. Graphs are generated for each species supported by the model.
(No matching species)FCC Surface Energies
This bar chart plot shows the mono-atomic face-centered cubic (fcc) relaxed surface energies predicted by the current model (shown in blue) compared with the predictions for all other models in the OpenKIM Repository that support the species. The vertical bars show the average and standard deviation (one sigma) bounds for all model predictions. Graphs are generated for each species supported by the model.
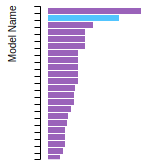
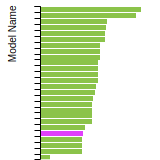
(No matching species)SC Lattice Constant
This bar chart plot shows the mono-atomic simple cubic (sc) lattice constant predicted by the current model (shown in the unique color) compared with the predictions for all other models in the OpenKIM Repository that support the species. The vertical bars show the average and standard deviation (one sigma) bounds for all model predictions. Graphs are generated for each species supported by the model.
Cubic Crystal Basic Properties Table
Species: MoSpecies: S
Disclaimer From Model Developer
This model is designed for two-dimensional (2D) monolayer molybdenum disulfide (MoS2). It is not appropriate for bulk MoS2 or other compounds of Mo and/or S.
Creators:
Contributor: karls
Publication Year: 2019
DOI: https://doi.org/10.25950/64cb38c5
This Test Driver uses LAMMPS to compute the cohesive energy of a given monoatomic cubic lattice (fcc, bcc, sc, or diamond) at a variety of lattice spacings. The lattice spacings range from a_min (=a_min_frac*a_0) to a_max (=a_max_frac*a_0) where a_0, a_min_frac, and a_max_frac are read from stdin (a_0 is typically approximately equal to the equilibrium lattice constant). The precise scaling and number of lattice spacings sampled between a_min and a_0 (a_0 and a_max) is specified by two additional parameters passed from stdin: N_lower and samplespacing_lower (N_upper and samplespacing_upper). Please see README.txt for further details.
| Test | Test Results | Link to Test Results page | Benchmark time
Usertime multiplied by the Whetstone Benchmark. This number can be used (approximately) to compare the performance of different models independently of the architecture on which the test was run.
Measured in Millions of Whetstone Instructions (MWI) |
|---|---|---|---|
| Cohesive energy versus lattice constant curve for bcc Mo v004 | view | 2646 | |
| Cohesive energy versus lattice constant curve for bcc S v004 | view | 2198 | |
| Cohesive energy versus lattice constant curve for diamond Mo v004 | view | 2534 | |
| Cohesive energy versus lattice constant curve for diamond S v004 | view | 2099 | |
| Cohesive energy versus lattice constant curve for fcc Mo v004 | view | 2268 | |
| Cohesive energy versus lattice constant curve for fcc S v004 | view | 2282 | |
| Cohesive energy versus lattice constant curve for sc Mo v004 | view | 2089 | |
| Cohesive energy versus lattice constant curve for sc S v004 | view | 2282 |
Creators:
Contributor: ilia
Publication Year: 2024
DOI: https://doi.org/10.25950/888f9943
Computes the elastic constants for an arbitrary crystal. A robust computational protocol is used, attempting multiple methods and step sizes to achieve an acceptably low error in numerical differentiation and deviation from material symmetry. The crystal structure is specified using the AFLOW prototype designation as part of the Crystal Genome testing framework. In addition, the distance from the obtained elasticity tensor to the nearest isotropic tensor is computed.
| Test | Test Results | Link to Test Results page | Benchmark time
Usertime multiplied by the Whetstone Benchmark. This number can be used (approximately) to compare the performance of different models independently of the architecture on which the test was run.
Measured in Millions of Whetstone Instructions (MWI) |
|---|---|---|---|
| Elastic constants for MoS in AFLOW crystal prototype A2B3_mP10_11_2e_3e at zero temperature and pressure v000 | view | 358302 |
Creators: Junhao Li and Ellad Tadmor
Contributor: tadmor
Publication Year: 2019
DOI: https://doi.org/10.25950/5853fb8f
Computes the cubic elastic constants for some common crystal types (fcc, bcc, sc, diamond) by calculating the hessian of the energy density with respect to strain. An estimate of the error associated with the numerical differentiation performed is reported.
| Test | Test Results | Link to Test Results page | Benchmark time
Usertime multiplied by the Whetstone Benchmark. This number can be used (approximately) to compare the performance of different models independently of the architecture on which the test was run.
Measured in Millions of Whetstone Instructions (MWI) |
|---|---|---|---|
| Elastic constants for bcc Mo at zero temperature v006 | view | 1663 | |
| Elastic constants for bcc S at zero temperature v006 | view | 2143 | |
| Elastic constants for diamond S at zero temperature v001 | view | 5118 | |
| Elastic constants for fcc Mo at zero temperature v006 | view | 1919 | |
| Elastic constants for fcc S at zero temperature v006 | view | 6846 | |
| Elastic constants for sc Mo at zero temperature v006 | view | 1535 | |
| Elastic constants for sc S at zero temperature v006 | view | 2079 |
Creators: Junhao Li
Contributor: jl2922
Publication Year: 2019
DOI: https://doi.org/10.25950/d794c746
Computes the elastic constants for hcp crystals by calculating the hessian of the energy density with respect to strain. An estimate of the error associated with the numerical differentiation performed is reported.
| Test | Test Results | Link to Test Results page | Benchmark time
Usertime multiplied by the Whetstone Benchmark. This number can be used (approximately) to compare the performance of different models independently of the architecture on which the test was run.
Measured in Millions of Whetstone Instructions (MWI) |
|---|---|---|---|
| Elastic constants for hcp Mo at zero temperature v004 | view | 1974 | |
| Elastic constants for hcp S at zero temperature v004 | view | 2006 |
Creators:
Contributor: ilia
Publication Year: 2024
DOI: https://doi.org/10.25950/2f2c4ad3
Computes the equilibrium crystal structure and energy for an arbitrary crystal at zero temperature and applied stress by performing symmetry-constrained relaxation. The crystal structure is specified using the AFLOW prototype designation. Multiple sets of free parameters corresponding to the crystal prototype may be specified as initial guesses for structure optimization. No guarantee is made regarding the stability of computed equilibria, nor that any are the ground state.
Creators:
Contributor: ilia
Publication Year: 2025
DOI: https://doi.org/10.25950/866c7cfa
Computes the equilibrium crystal structure and energy for an arbitrary crystal at zero temperature and applied stress by performing symmetry-constrained relaxation. The crystal structure is specified using the AFLOW prototype designation. Multiple sets of free parameters corresponding to the crystal prototype may be specified as initial guesses for structure optimization. No guarantee is made regarding the stability of computed equilibria, nor that any are the ground state.
| Test | Test Results | Link to Test Results page | Benchmark time
Usertime multiplied by the Whetstone Benchmark. This number can be used (approximately) to compare the performance of different models independently of the architecture on which the test was run.
Measured in Millions of Whetstone Instructions (MWI) |
|---|---|---|---|
| Equilibrium crystal structure and energy for MoS in AFLOW crystal prototype A15B19_hP68_176_h2i_efh2i v003 | view | 1493389 | |
| Equilibrium crystal structure and energy for Mo in AFLOW crystal prototype A_cF4_225_a v003 | view | 204499 | |
| Equilibrium crystal structure and energy for Mo in AFLOW crystal prototype A_cI2_229_a v003 | view | 175434 | |
| Equilibrium crystal structure and energy for Mo in AFLOW crystal prototype A_hP1_191_a v003 | view | 169188 | |
| Equilibrium crystal structure and energy for Mo in AFLOW crystal prototype A_hP4_194_ac v003 | view | 153237 |
Creators:
Contributor: brunnels
Publication Year: 2022
DOI: https://doi.org/10.25950/2c59c9d6
Computes grain boundary energy for a range of tilt angles given a crystal structure, tilt axis, and material.
| Test | Test Results | Link to Test Results page | Benchmark time
Usertime multiplied by the Whetstone Benchmark. This number can be used (approximately) to compare the performance of different models independently of the architecture on which the test was run.
Measured in Millions of Whetstone Instructions (MWI) |
|---|---|---|---|
| Relaxed energy as a function of tilt angle for a 100 symmetric tilt grain boundary in bcc Mo v001 | view | 20347717 | |
| Relaxed energy as a function of tilt angle for a 110 symmetric tilt grain boundary in bcc Mo v001 | view | 68314992 | |
| Relaxed energy as a function of tilt angle for a 111 symmetric tilt grain boundary in bcc Mo v001 | view | 34668588 | |
| Relaxed energy as a function of tilt angle for a 112 symmetric tilt grain boundary in bcc Mo v001 | view | 152969991 |
Creators: Daniel S. Karls and Junhao Li
Contributor: karls
Publication Year: 2019
DOI: https://doi.org/10.25950/2765e3bf
Equilibrium lattice constant and cohesive energy of a cubic lattice at zero temperature and pressure.
| Test | Test Results | Link to Test Results page | Benchmark time
Usertime multiplied by the Whetstone Benchmark. This number can be used (approximately) to compare the performance of different models independently of the architecture on which the test was run.
Measured in Millions of Whetstone Instructions (MWI) |
|---|---|---|---|
| Equilibrium zero-temperature lattice constant for bcc Mo v007 | view | 2047 | |
| Equilibrium zero-temperature lattice constant for bcc S v007 | view | 2367 | |
| Equilibrium zero-temperature lattice constant for diamond Mo v007 | view | 3327 | |
| Equilibrium zero-temperature lattice constant for diamond S v007 | view | 3359 | |
| Equilibrium zero-temperature lattice constant for fcc Mo v007 | view | 3167 | |
| Equilibrium zero-temperature lattice constant for fcc S v007 | view | 2559 | |
| Equilibrium zero-temperature lattice constant for sc Mo v007 | view | 1919 | |
| Equilibrium zero-temperature lattice constant for sc S v007 | view | 2303 |
Creators: Daniel S. Karls and Junhao Li
Contributor: karls
Publication Year: 2019
DOI: https://doi.org/10.25950/c339ca32
Calculates lattice constant of hexagonal bulk structures at zero temperature and pressure by using simplex minimization to minimize the potential energy.
| Test | Test Results | Link to Test Results page | Benchmark time
Usertime multiplied by the Whetstone Benchmark. This number can be used (approximately) to compare the performance of different models independently of the architecture on which the test was run.
Measured in Millions of Whetstone Instructions (MWI) |
|---|---|---|---|
| Equilibrium lattice constants for hcp Mo v005 | view | 28207 | |
| Equilibrium lattice constants for hcp S v005 | view | 17796 |
Creators:
Contributor: mjwen
Publication Year: 2024
DOI: https://doi.org/10.25950/9d9822ec
This Test Driver uses LAMMPS to compute the linear thermal expansion coefficient at a finite temperature under a given pressure for a cubic lattice (fcc, bcc, sc, diamond) of a single given species.
| Test | Test Results | Link to Test Results page | Benchmark time
Usertime multiplied by the Whetstone Benchmark. This number can be used (approximately) to compare the performance of different models independently of the architecture on which the test was run.
Measured in Millions of Whetstone Instructions (MWI) |
|---|---|---|---|
| Linear thermal expansion coefficient of bcc Mo at 293.15 K under a pressure of 0 MPa v002 | view | 2728228 |
Creators: Matt Bierbaum
Contributor: mattbierbaum
Publication Year: 2019
DOI: https://doi.org/10.25950/6c43a4e6
Calculates the surface energy of several high symmetry surfaces and produces a broken-bond model fit. In latex form, the fit equations are given by:
E_{FCC} (\vec{n}) = p_1 (4 \left( |x+y| + |x-y| + |x+z| + |x-z| + |z+y| +|z-y|\right)) + p_2 (8 \left( |x| + |y| + |z|\right)) + p_3 (2 ( |x+ 2y + z| + |x+2y-z| + |x-2y + z| + |x-2y-z| + |2x+y+z| + |2x+y-z| +|2x-y+z| +|2x-y-z| +|x+y+2z| +|x+y-2z| +|x-y+2z| +|x-y-2z| ) + c
E_{BCC} (\vec{n}) = p_1 (6 \left( | x+y+z| + |x+y-z| + |-x+y-z| + |x-y+z| \right)) + p_2 (8 \left( |x| + |y| + |z|\right)) + p_3 (4 \left( |x+y| + |x-y| + |x+z| + |x-z| + |z+y| +|z-y|\right)) +c.
In Python, these two fits take the following form:
def BrokenBondFCC(params, index):
import numpy
x, y, z = index
x = x / numpy.sqrt(x**2.+y**2.+z**2.)
y = y / numpy.sqrt(x**2.+y**2.+z**2.)
z = z / numpy.sqrt(x**2.+y**2.+z**2.)
return params[0]*4* (abs(x+y) + abs(x-y) + abs(x+z) + abs(x-z) + abs(z+y) + abs(z-y)) + params[1]*8*(abs(x) + abs(y) + abs(z)) + params[2]*(abs(x+2*y+z) + abs(x+2*y-z) +abs(x-2*y+z) +abs(x-2*y-z) + abs(2*x+y+z) +abs(2*x+y-z) +abs(2*x-y+z) +abs(2*x-y-z) + abs(x+y+2*z) +abs(x+y-2*z) +abs(x-y+2*z) +abs(x-y-2*z))+params[3]
def BrokenBondBCC(params, x, y, z):
import numpy
x, y, z = index
x = x / numpy.sqrt(x**2.+y**2.+z**2.)
y = y / numpy.sqrt(x**2.+y**2.+z**2.)
z = z / numpy.sqrt(x**2.+y**2.+z**2.)
return params[0]*6*(abs(x+y+z) + abs(x-y-z) + abs(x-y+z) + abs(x+y-z)) + params[1]*8*(abs(x) + abs(y) + abs(z)) + params[2]*4* (abs(x+y) + abs(x-y) + abs(x+z) + abs(x-z) + abs(z+y) + abs(z-y)) + params[3]
| Test | Test Results | Link to Test Results page | Benchmark time
Usertime multiplied by the Whetstone Benchmark. This number can be used (approximately) to compare the performance of different models independently of the architecture on which the test was run.
Measured in Millions of Whetstone Instructions (MWI) |
|---|---|---|---|
| Broken-bond fit of high-symmetry surface energies in bcc Mo v004 | view | 52078 |
Creators:
Contributor: efuem
Publication Year: 2023
DOI: https://doi.org/10.25950/fca89cea
Computes the monovacancy formation energy and relaxation volume for cubic and hcp monoatomic crystals.
| Test | Test Results | Link to Test Results page | Benchmark time
Usertime multiplied by the Whetstone Benchmark. This number can be used (approximately) to compare the performance of different models independently of the architecture on which the test was run.
Measured in Millions of Whetstone Instructions (MWI) |
|---|---|---|---|
| Monovacancy formation energy and relaxation volume for bcc Mo | view | 653750 |
Creators:
Contributor: efuem
Publication Year: 2023
DOI: https://doi.org/10.25950/c27ba3cd
Computes the monovacancy formation and migration energies for cubic and hcp monoatomic crystals.
| Test | Test Results | Link to Test Results page | Benchmark time
Usertime multiplied by the Whetstone Benchmark. This number can be used (approximately) to compare the performance of different models independently of the architecture on which the test was run.
Measured in Millions of Whetstone Instructions (MWI) |
|---|---|---|---|
| Vacancy formation and migration energy for bcc Mo | view | 4892818 |
| Test | Error Categories | Link to Error page |
|---|---|---|
| Elastic constants for MoS in AFLOW crystal prototype A15B19_hP68_176_h2i_efh2i at zero temperature and pressure v000 | other | view |
ElasticConstantsCubic__TD_011862047401_006
| Test | Error Categories | Link to Error page |
|---|---|---|
| Elastic constants for diamond Mo at zero temperature v001 | other | view |
EquilibriumCrystalStructure__TD_457028483760_000
| Test | Error Categories | Link to Error page |
|---|---|---|
| Equilibrium crystal structure and energy for MoS in AFLOW crystal prototype A15B19_hP68_176_h2i_efh2i v000 | other | view |
| Equilibrium crystal structure and energy for MoS in AFLOW crystal prototype A2B3_mP10_11_2e_3e v000 | other | view |
EquilibriumCrystalStructure__TD_457028483760_002
| SW_MX2_WenShirodkarPlechac_2017_MoS__MO_201919462778_001.txz | Tar+XZ | Linux and OS X archive |
| SW_MX2_WenShirodkarPlechac_2017_MoS__MO_201919462778_001.zip | Zip | Windows archive |
This Model requires a Model Driver. Archives for the Model Driver SW_MX2__MD_242389978788_001 appear below.
| SW_MX2__MD_242389978788_001.txz | Tar+XZ | Linux and OS X archive |
| SW_MX2__MD_242389978788_001.zip | Zip | Windows archive |