 Tersoff_LAMMPS_ZhangNguyen_2021_MoSe__MO_152208847456_001
| Title
A single sentence description.
|
Tersoff potentials for large deformation pathways and fracture of MoSe2 v001 |
|---|---|
| Description
A short description of the Model describing its key features including for example: type of model (pair potential, 3-body potential, EAM, etc.), modeled species (Ac, Ag, ..., Zr), intended purpose, origin, and so on.
|
3-body Tersoff potential for monolayered and multilayered MoSe2. Best used for thermal and mechanical properties of this material, esp. uniaxial tension, crack propagation, thermal conductivity, vacancy energy, surface energy, phonon dispersion. |
| Species
The supported atomic species.
| Mo, Se |
| Disclaimer
A statement of applicability provided by the contributor, informing users of the intended use of this KIM Item.
|
None |
| Contributor |
Hoang T. Nguyen |
| Maintainer |
Hoang T. Nguyen |
| Developer |
Xu Zhang Hoang T. Nguyen |
| Published on KIM | 2021 |
| How to Cite |
This Model is archived in OpenKIM [1-4]. [1] Zhang X, Nguyen HT. Tersoff potentials for large deformation pathways and fracture of MoSe2 v001. OpenKIM; 2021. doi:10.25950/78b6b863 [2] Brink T, Thompson AP, Farrell DE, Wen M, Tersoff J, Nord J, et al. Model driver for Tersoff-style potentials ported from LAMMPS v005. OpenKIM; 2021. doi:10.25950/9a7dc96c [3] Tadmor EB, Elliott RS, Sethna JP, Miller RE, Becker CA. The potential of atomistic simulations and the Knowledgebase of Interatomic Models. JOM. 2011;63(7):17. doi:10.1007/s11837-011-0102-6 [4] Elliott RS, Tadmor EB. Knowledgebase of Interatomic Models (KIM) Application Programming Interface (API). OpenKIM; 2011. doi:10.25950/ff8f563a Click here to download the above citation in BibTeX format. |
| Funding | Not available |
| Short KIM ID
The unique KIM identifier code.
| MO_152208847456_001 |
| Extended KIM ID
The long form of the KIM ID including a human readable prefix (100 characters max), two underscores, and the Short KIM ID. Extended KIM IDs can only contain alpha-numeric characters (letters and digits) and underscores and must begin with a letter.
| Tersoff_LAMMPS_ZhangNguyen_2021_MoSe__MO_152208847456_001 |
| DOI |
10.25950/78b6b863 https://doi.org/10.25950/78b6b863 https://commons.datacite.org/doi.org/10.25950/78b6b863 |
| KIM Item Type
Specifies whether this is a Portable Model (software implementation of an interatomic model); Portable Model with parameter file (parameter file to be read in by a Model Driver); Model Driver (software implementation of an interatomic model that reads in parameters).
| Portable Model using Model Driver Tersoff_LAMMPS__MD_077075034781_005 |
| Driver | Tersoff_LAMMPS__MD_077075034781_005 |
| KIM API Version | 2.2 |
| Potential Type | tersoff |
| Previous Version | Tersoff_LAMMPS_ZhangNguyen_2021_MoSe__MO_152208847456_000 |
| Grade | Name | Category | Brief Description | Full Results | Aux File(s) |
|---|---|---|---|---|---|
| P | vc-species-supported-as-stated | mandatory | The model supports all species it claims to support; see full description. |
Results | Files |
| P | vc-periodicity-support | mandatory | Periodic boundary conditions are handled correctly; see full description. |
Results | Files |
| P | vc-permutation-symmetry | mandatory | Total energy and forces are unchanged when swapping atoms of the same species; see full description. |
Results | Files |
| A | vc-forces-numerical-derivative | consistency | Forces computed by the model agree with numerical derivatives of the energy; see full description. |
Results | Files |
| F | vc-dimer-continuity-c1 | informational | The energy versus separation relation of a pair of atoms is C1 continuous (i.e. the function and its first derivative are continuous); see full description. |
Results | Files |
| P | vc-objectivity | informational | Total energy is unchanged and forces transform correctly under rigid-body translation and rotation; see full description. |
Results | Files |
| P | vc-inversion-symmetry | informational | Total energy is unchanged and forces change sign when inverting a configuration through the origin; see full description. |
Results | Files |
| P | vc-memory-leak | informational | The model code does not have memory leaks (i.e. it releases all allocated memory at the end); see full description. |
Results | Files |
| P | vc-thread-safe | mandatory | The model returns the same energy and forces when computed in serial and when using parallel threads for a set of configurations. Note that this is not a guarantee of thread safety; see full description. |
Results | Files |
| N/A | vc-unit-conversion | mandatory | The model is able to correctly convert its energy and/or forces to different unit sets; see full description. |
Results | Files |
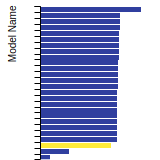
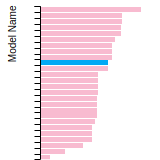
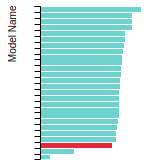
BCC Lattice Constant
This bar chart plot shows the mono-atomic body-centered cubic (bcc) lattice constant predicted by the current model (shown in the unique color) compared with the predictions for all other models in the OpenKIM Repository that support the species. The vertical bars show the average and standard deviation (one sigma) bounds for all model predictions. Graphs are generated for each species supported by the model.
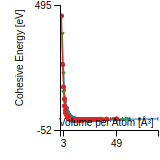
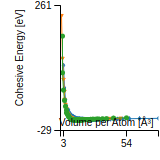
Cohesive Energy Graph
This graph shows the cohesive energy versus volume-per-atom for the current mode for four mono-atomic cubic phases (body-centered cubic (bcc), face-centered cubic (fcc), simple cubic (sc), and diamond). The curve with the lowest minimum is the ground state of the crystal if stable. (The crystal structure is enforced in these calculations, so the phase may not be stable.) Graphs are generated for each species supported by the model.
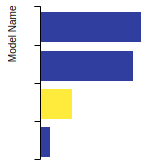
Diamond Lattice Constant
This bar chart plot shows the mono-atomic face-centered diamond lattice constant predicted by the current model (shown in the unique color) compared with the predictions for all other models in the OpenKIM Repository that support the species. The vertical bars show the average and standard deviation (one sigma) bounds for all model predictions. Graphs are generated for each species supported by the model.
Dislocation Core Energies
This graph shows the dislocation core energy of a cubic crystal at zero temperature and pressure for a specific set of dislocation core cutoff radii. After obtaining the total energy of the system from conjugate gradient minimizations, non-singular, isotropic and anisotropic elasticity are applied to obtain the dislocation core energy for each of these supercells with different dipole distances. Graphs are generated for each species supported by the model.
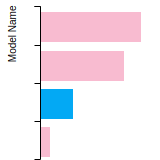
(No matching species)FCC Elastic Constants
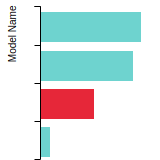
This bar chart plot shows the mono-atomic face-centered cubic (fcc) elastic constants predicted by the current model (shown in blue) compared with the predictions for all other models in the OpenKIM Repository that support the species. The vertical bars show the average and standard deviation (one sigma) bounds for all model predictions. Graphs are generated for each species supported by the model.
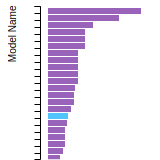
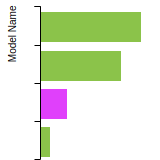
FCC Lattice Constant
This bar chart plot shows the mono-atomic face-centered cubic (fcc) lattice constant predicted by the current model (shown in red) compared with the predictions for all other models in the OpenKIM Repository that support the species. The vertical bars show the average and standard deviation (one sigma) bounds for all model predictions. Graphs are generated for each species supported by the model.
FCC Stacking Fault Energies
This bar chart plot shows the intrinsic and extrinsic stacking fault energies as well as the unstable stacking and unstable twinning energies for face-centered cubic (fcc) predicted by the current model (shown in blue) compared with the predictions for all other models in the OpenKIM Repository that support the species. The vertical bars show the average and standard deviation (one sigma) bounds for all model predictions. Graphs are generated for each species supported by the model.
(No matching species)FCC Surface Energies
This bar chart plot shows the mono-atomic face-centered cubic (fcc) relaxed surface energies predicted by the current model (shown in blue) compared with the predictions for all other models in the OpenKIM Repository that support the species. The vertical bars show the average and standard deviation (one sigma) bounds for all model predictions. Graphs are generated for each species supported by the model.
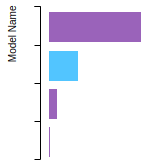
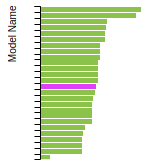
(No matching species)SC Lattice Constant
This bar chart plot shows the mono-atomic simple cubic (sc) lattice constant predicted by the current model (shown in the unique color) compared with the predictions for all other models in the OpenKIM Repository that support the species. The vertical bars show the average and standard deviation (one sigma) bounds for all model predictions. Graphs are generated for each species supported by the model.
Cubic Crystal Basic Properties Table
Species: MoSpecies: Se
Creators:
Contributor: karls
Publication Year: 2019
DOI: https://doi.org/10.25950/64cb38c5
This Test Driver uses LAMMPS to compute the cohesive energy of a given monoatomic cubic lattice (fcc, bcc, sc, or diamond) at a variety of lattice spacings. The lattice spacings range from a_min (=a_min_frac*a_0) to a_max (=a_max_frac*a_0) where a_0, a_min_frac, and a_max_frac are read from stdin (a_0 is typically approximately equal to the equilibrium lattice constant). The precise scaling and number of lattice spacings sampled between a_min and a_0 (a_0 and a_max) is specified by two additional parameters passed from stdin: N_lower and samplespacing_lower (N_upper and samplespacing_upper). Please see README.txt for further details.
| Test | Test Results | Link to Test Results page | Benchmark time
Usertime multiplied by the Whetstone Benchmark. This number can be used (approximately) to compare the performance of different models independently of the architecture on which the test was run.
Measured in Millions of Whetstone Instructions (MWI) |
|---|---|---|---|
| Cohesive energy versus lattice constant curve for bcc Mo v004 | view | 3876 | |
| Cohesive energy versus lattice constant curve for bcc Se v003 | view | 2029 | |
| Cohesive energy versus lattice constant curve for diamond Mo v004 | view | 3429 | |
| Cohesive energy versus lattice constant curve for diamond Se v004 | view | 2675 | |
| Cohesive energy versus lattice constant curve for fcc Mo v004 | view | 4659 | |
| Cohesive energy versus lattice constant curve for fcc Se v004 | view | 3083 | |
| Cohesive energy versus lattice constant curve for sc Mo v004 | view | 3578 | |
| Cohesive energy versus lattice constant curve for sc Se v004 | view | 2798 |
Creators:
Contributor: ilia
Publication Year: 2024
DOI: https://doi.org/10.25950/888f9943
Computes the elastic constants for an arbitrary crystal. A robust computational protocol is used, attempting multiple methods and step sizes to achieve an acceptably low error in numerical differentiation and deviation from material symmetry. The crystal structure is specified using the AFLOW prototype designation as part of the Crystal Genome testing framework. In addition, the distance from the obtained elasticity tensor to the nearest isotropic tensor is computed.
| Test | Test Results | Link to Test Results page | Benchmark time
Usertime multiplied by the Whetstone Benchmark. This number can be used (approximately) to compare the performance of different models independently of the architecture on which the test was run.
Measured in Millions of Whetstone Instructions (MWI) |
|---|---|---|---|
| Elastic constants for MoSe in AFLOW crystal prototype A15B19_hP68_176_h2i_efh2i at zero temperature and pressure v000 | view | 922833 |
Creators: Junhao Li and Ellad Tadmor
Contributor: tadmor
Publication Year: 2019
DOI: https://doi.org/10.25950/5853fb8f
Computes the cubic elastic constants for some common crystal types (fcc, bcc, sc, diamond) by calculating the hessian of the energy density with respect to strain. An estimate of the error associated with the numerical differentiation performed is reported.
| Test | Test Results | Link to Test Results page | Benchmark time
Usertime multiplied by the Whetstone Benchmark. This number can be used (approximately) to compare the performance of different models independently of the architecture on which the test was run.
Measured in Millions of Whetstone Instructions (MWI) |
|---|---|---|---|
| Elastic constants for bcc Mo at zero temperature v006 | view | 10712 | |
| Elastic constants for bcc Se at zero temperature v006 | view | 21563 | |
| Elastic constants for diamond Mo at zero temperature v001 | view | 35418 | |
| Elastic constants for diamond Se at zero temperature v001 | view | 35520 | |
| Elastic constants for fcc Mo at zero temperature v006 | view | 16921 | |
| Elastic constants for fcc Se at zero temperature v006 | view | 4808 | |
| Elastic constants for sc Mo at zero temperature v006 | view | 11159 | |
| Elastic constants for sc Se at zero temperature v006 | view | 10294 |
Creators:
Contributor: ilia
Publication Year: 2024
DOI: https://doi.org/10.25950/2f2c4ad3
Computes the equilibrium crystal structure and energy for an arbitrary crystal at zero temperature and applied stress by performing symmetry-constrained relaxation. The crystal structure is specified using the AFLOW prototype designation. Multiple sets of free parameters corresponding to the crystal prototype may be specified as initial guesses for structure optimization. No guarantee is made regarding the stability of computed equilibria, nor that any are the ground state.
Creators:
Contributor: ilia
Publication Year: 2025
DOI: https://doi.org/10.25950/866c7cfa
Computes the equilibrium crystal structure and energy for an arbitrary crystal at zero temperature and applied stress by performing symmetry-constrained relaxation. The crystal structure is specified using the AFLOW prototype designation. Multiple sets of free parameters corresponding to the crystal prototype may be specified as initial guesses for structure optimization. No guarantee is made regarding the stability of computed equilibria, nor that any are the ground state.
| Test | Test Results | Link to Test Results page | Benchmark time
Usertime multiplied by the Whetstone Benchmark. This number can be used (approximately) to compare the performance of different models independently of the architecture on which the test was run.
Measured in Millions of Whetstone Instructions (MWI) |
|---|---|---|---|
| Equilibrium crystal structure and energy for MoSe in AFLOW crystal prototype A15B19_hP68_176_h2i_efh2i v003 | view | 863460 | |
| Equilibrium crystal structure and energy for Mo in AFLOW crystal prototype A_cF4_225_a v003 | view | 199695 | |
| Equilibrium crystal structure and energy for Mo in AFLOW crystal prototype A_cI2_229_a v003 | view | 175994 | |
| Equilibrium crystal structure and energy for Mo in AFLOW crystal prototype A_hP1_191_a v003 | view | 172391 | |
| Equilibrium crystal structure and energy for Mo in AFLOW crystal prototype A_hP4_194_ac v003 | view | 181439 |
Creators: Brandon Runnels
Contributor: brunnels
Publication Year: 2019
DOI: https://doi.org/10.25950/4723cee7
Computes grain boundary energy for a range of tilt angles given a crystal structure, tilt axis, and material.
| Test | Test Results | Link to Test Results page | Benchmark time
Usertime multiplied by the Whetstone Benchmark. This number can be used (approximately) to compare the performance of different models independently of the architecture on which the test was run.
Measured in Millions of Whetstone Instructions (MWI) |
|---|---|---|---|
| Relaxed energy as a function of tilt angle for a 112 symmetric tilt grain boundary in bcc Mo v000 | view | 1188584624 |
Creators:
Contributor: brunnels
Publication Year: 2022
DOI: https://doi.org/10.25950/2c59c9d6
Computes grain boundary energy for a range of tilt angles given a crystal structure, tilt axis, and material.
| Test | Test Results | Link to Test Results page | Benchmark time
Usertime multiplied by the Whetstone Benchmark. This number can be used (approximately) to compare the performance of different models independently of the architecture on which the test was run.
Measured in Millions of Whetstone Instructions (MWI) |
|---|---|---|---|
| Relaxed energy as a function of tilt angle for a 100 symmetric tilt grain boundary in bcc Mo v001 | view | 194609673 | |
| Relaxed energy as a function of tilt angle for a 110 symmetric tilt grain boundary in bcc Mo v001 | view | 792105998 | |
| Relaxed energy as a function of tilt angle for a 111 symmetric tilt grain boundary in bcc Mo v001 | view | 474422206 |
Creators: Daniel S. Karls and Junhao Li
Contributor: karls
Publication Year: 2019
DOI: https://doi.org/10.25950/2765e3bf
Equilibrium lattice constant and cohesive energy of a cubic lattice at zero temperature and pressure.
| Test | Test Results | Link to Test Results page | Benchmark time
Usertime multiplied by the Whetstone Benchmark. This number can be used (approximately) to compare the performance of different models independently of the architecture on which the test was run.
Measured in Millions of Whetstone Instructions (MWI) |
|---|---|---|---|
| Equilibrium zero-temperature lattice constant for bcc Mo v007 | view | 7420 | |
| Equilibrium zero-temperature lattice constant for bcc Se v007 | view | 7181 | |
| Equilibrium zero-temperature lattice constant for diamond Mo v007 | view | 5367 | |
| Equilibrium zero-temperature lattice constant for diamond Se v007 | view | 4994 | |
| Equilibrium zero-temperature lattice constant for fcc Mo v007 | view | 3541 | |
| Equilibrium zero-temperature lattice constant for fcc Se v007 | view | 4174 | |
| Equilibrium zero-temperature lattice constant for sc Mo v007 | view | 3727 | |
| Equilibrium zero-temperature lattice constant for sc Se v007 | view | 3690 |
Creators: Daniel S. Karls and Junhao Li
Contributor: karls
Publication Year: 2019
DOI: https://doi.org/10.25950/c339ca32
Calculates lattice constant of hexagonal bulk structures at zero temperature and pressure by using simplex minimization to minimize the potential energy.
| Test | Test Results | Link to Test Results page | Benchmark time
Usertime multiplied by the Whetstone Benchmark. This number can be used (approximately) to compare the performance of different models independently of the architecture on which the test was run.
Measured in Millions of Whetstone Instructions (MWI) |
|---|---|---|---|
| Equilibrium lattice constants for hcp Mo v005 | view | 79203 | |
| Equilibrium lattice constants for hcp Se v005 | view | 70676 |
Creators:
Contributor: mjwen
Publication Year: 2024
DOI: https://doi.org/10.25950/9d9822ec
This Test Driver uses LAMMPS to compute the linear thermal expansion coefficient at a finite temperature under a given pressure for a cubic lattice (fcc, bcc, sc, diamond) of a single given species.
| Test | Test Results | Link to Test Results page | Benchmark time
Usertime multiplied by the Whetstone Benchmark. This number can be used (approximately) to compare the performance of different models independently of the architecture on which the test was run.
Measured in Millions of Whetstone Instructions (MWI) |
|---|---|---|---|
| Linear thermal expansion coefficient of bcc Mo at 293.15 K under a pressure of 0 MPa v002 | view | 12794051 |
Creators: Matt Bierbaum
Contributor: mattbierbaum
Publication Year: 2019
DOI: https://doi.org/10.25950/6c43a4e6
Calculates the surface energy of several high symmetry surfaces and produces a broken-bond model fit. In latex form, the fit equations are given by:
E_{FCC} (\vec{n}) = p_1 (4 \left( |x+y| + |x-y| + |x+z| + |x-z| + |z+y| +|z-y|\right)) + p_2 (8 \left( |x| + |y| + |z|\right)) + p_3 (2 ( |x+ 2y + z| + |x+2y-z| + |x-2y + z| + |x-2y-z| + |2x+y+z| + |2x+y-z| +|2x-y+z| +|2x-y-z| +|x+y+2z| +|x+y-2z| +|x-y+2z| +|x-y-2z| ) + c
E_{BCC} (\vec{n}) = p_1 (6 \left( | x+y+z| + |x+y-z| + |-x+y-z| + |x-y+z| \right)) + p_2 (8 \left( |x| + |y| + |z|\right)) + p_3 (4 \left( |x+y| + |x-y| + |x+z| + |x-z| + |z+y| +|z-y|\right)) +c.
In Python, these two fits take the following form:
def BrokenBondFCC(params, index):
import numpy
x, y, z = index
x = x / numpy.sqrt(x**2.+y**2.+z**2.)
y = y / numpy.sqrt(x**2.+y**2.+z**2.)
z = z / numpy.sqrt(x**2.+y**2.+z**2.)
return params[0]*4* (abs(x+y) + abs(x-y) + abs(x+z) + abs(x-z) + abs(z+y) + abs(z-y)) + params[1]*8*(abs(x) + abs(y) + abs(z)) + params[2]*(abs(x+2*y+z) + abs(x+2*y-z) +abs(x-2*y+z) +abs(x-2*y-z) + abs(2*x+y+z) +abs(2*x+y-z) +abs(2*x-y+z) +abs(2*x-y-z) + abs(x+y+2*z) +abs(x+y-2*z) +abs(x-y+2*z) +abs(x-y-2*z))+params[3]
def BrokenBondBCC(params, x, y, z):
import numpy
x, y, z = index
x = x / numpy.sqrt(x**2.+y**2.+z**2.)
y = y / numpy.sqrt(x**2.+y**2.+z**2.)
z = z / numpy.sqrt(x**2.+y**2.+z**2.)
return params[0]*6*(abs(x+y+z) + abs(x-y-z) + abs(x-y+z) + abs(x+y-z)) + params[1]*8*(abs(x) + abs(y) + abs(z)) + params[2]*4* (abs(x+y) + abs(x-y) + abs(x+z) + abs(x-z) + abs(z+y) + abs(z-y)) + params[3]
| Test | Test Results | Link to Test Results page | Benchmark time
Usertime multiplied by the Whetstone Benchmark. This number can be used (approximately) to compare the performance of different models independently of the architecture on which the test was run.
Measured in Millions of Whetstone Instructions (MWI) |
|---|---|---|---|
| Broken-bond fit of high-symmetry surface energies in bcc Mo v004 | view | 933701 |
Creators:
Contributor: efuem
Publication Year: 2023
DOI: https://doi.org/10.25950/fca89cea
Computes the monovacancy formation energy and relaxation volume for cubic and hcp monoatomic crystals.
| Test | Test Results | Link to Test Results page | Benchmark time
Usertime multiplied by the Whetstone Benchmark. This number can be used (approximately) to compare the performance of different models independently of the architecture on which the test was run.
Measured in Millions of Whetstone Instructions (MWI) |
|---|---|---|---|
| Monovacancy formation energy and relaxation volume for bcc Mo | view | 3093975 |
Creators:
Contributor: efuem
Publication Year: 2023
DOI: https://doi.org/10.25950/c27ba3cd
Computes the monovacancy formation and migration energies for cubic and hcp monoatomic crystals.
| Test | Test Results | Link to Test Results page | Benchmark time
Usertime multiplied by the Whetstone Benchmark. This number can be used (approximately) to compare the performance of different models independently of the architecture on which the test was run.
Measured in Millions of Whetstone Instructions (MWI) |
|---|---|---|---|
| Vacancy formation and migration energy for bcc Mo | view | 9796754 |
| Test | Error Categories | Link to Error page |
|---|---|---|
| Cohesive energy versus lattice constant curve for bcc Se v004 | other | view |
ElasticConstantsHexagonal__TD_612503193866_004
| Test | Error Categories | Link to Error page |
|---|---|---|
| Elastic constants for hcp Mo at zero temperature v004 | other | view |
| Elastic constants for hcp Se at zero temperature v004 | other | view |
EquilibriumCrystalStructure__TD_457028483760_000
| Test | Error Categories | Link to Error page |
|---|---|---|
| Equilibrium crystal structure and energy for Se in AFLOW crystal prototype A_mP32_14_8e v000 | other | view |
EquilibriumCrystalStructure__TD_457028483760_002
GrainBoundaryCubicCrystalSymmetricTiltRelaxedEnergyVsAngle__TD_410381120771_003
| Test | Error Categories | Link to Error page |
|---|---|---|
| Relaxed energy as a function of tilt angle for a 112 symmetric tilt grain boundary in bcc Mo v001 | other | view |
| Tersoff_LAMMPS_ZhangNguyen_2021_MoSe__MO_152208847456_001.txz | Tar+XZ | Linux and OS X archive |
| Tersoff_LAMMPS_ZhangNguyen_2021_MoSe__MO_152208847456_001.zip | Zip | Windows archive |
This Model requires a Model Driver. Archives for the Model Driver Tersoff_LAMMPS__MD_077075034781_005 appear below.
| Tersoff_LAMMPS__MD_077075034781_005.txz | Tar+XZ | Linux and OS X archive |
| Tersoff_LAMMPS__MD_077075034781_005.zip | Zip | Windows archive |