Interatomic potential for Cerium (Ce), Chlorine (Cl), Hydrogen (H), Oxygen (O), Silicon (Si), Sodium (Na). Use this Potential
Citing article:
Current potential: Sim_LAMMPS_ReaxFF_BrugnoliMiyataniAkaji_SiCeNaClHO_2023__SM_282799919035_000
Deep Citation determination:
Does the citing paper use the current potential to generate results displayed in the paper?
Provide us with identifying information so that we know you are not a bot (you will not be added to a mailing list):
Title
A single sentence description.
LAMMPS ReaxFF potential for Ceria/Silica/Water/NaCl developed by Brugnoli et al. (2023) v000
Description
This reaxff potential was developed with the aim to describe the chemical mechanical polishing of ceria on silica glass surfaces, including the presence of water or HCl/NaOH solutions.
Species
The supported atomic species.
Ce, Cl, H, Na, O, Si
Disclaimer
A statement of applicability provided by the contributor, informing users of the intended use of this KIM Item.
This Simulator Model originally published in [1-2] is archived in OpenKIM [3-5].
[1] Brugnoli L, Menziani MC, Urata S, Pedone A. Development and Application of a ReaxFF Reactive Force Field for Cerium Oxide/Water Interfaces. The Journal of Physical Chemistry A [Internet]. 2021Jun [cited 2021Jun22]; Available from: https://doi.org/10.1021/acs.jpca.1c04078 doi:10.1021/acs.jpca.1c04078
[2] Brugnoli L, Miyatani K, Akaji M, Urata S, Pedone A. New Atomistic Insights on the Chemical Mechanical Polishing of Silica Glass with Ceria Nanoparticles. Langmuir [Internet]. 2023Apr [cited 2023May16];39(15):5527–41. Available from: https://doi.org/10.1021/acs.langmuir.3c00304 doi:10.1021/acs.langmuir.3c00304 — (Primary Source) A primary source is a reference directly related to the item documenting its development, as opposed to other sources that are provided as background information.
[3] Brugnoli L, Miyatani K, Akaji M, Urata S, Menziani MC, Pedone A. LAMMPS ReaxFF potential for Ceria/Silica/Water/NaCl developed by Brugnoli et al. (2023) v000. OpenKIM; 2023. doi:10.25950/89e866e6
[4] Tadmor EB, Elliott RS, Sethna JP, Miller RE, Becker CA. The potential of atomistic simulations and the Knowledgebase of Interatomic Models. JOM. 2011;63(7):17. doi:10.1007/s11837-011-0102-6
This panel presents information regarding the papers that have cited the interatomic potential (IP) whose page you are on.
The OpenKIM machine learning based Deep Citation framework is used to determine whether the citing article actually used the IP in computations (denoted by "USED") or only provides it as a background citation (denoted by "NOT USED"). For more details on Deep Citation and how to work with this panel, click the documentation link at the top of the panel.
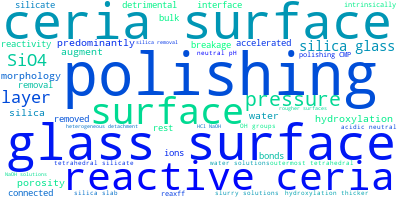
The word cloud to the right is generated from the abstracts of IP principle source(s) (given below in "How to Cite") and the citing articles that were determined to have used the IP in order to provide users with a quick sense of the types of physical phenomena to which this IP is applied.
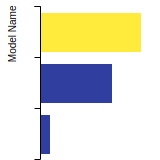
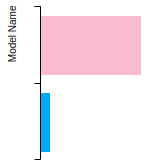
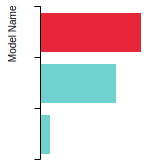
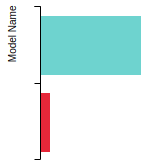
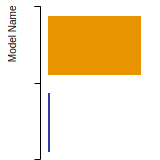
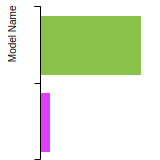
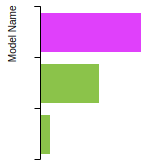
The bar chart shows the number of articles that cited the IP per year. Each bar is divided into green (articles that USED the IP) and blue (articles that did NOT USE the IP).
Users are encouraged to correct Deep Citation errors in determination by clicking the speech icon next to a citing article and providing updated information. This will be integrated into the next Deep Citation learning cycle, which occurs on a regular basis.
This panel provides information on past usage of this interatomic potential (IP) powered by the OpenKIM Deep Citation framework. The word cloud indicates typical applications of the potential. The bar chart shows citations per year of this IP (bars are divided into articles that used the IP (green) and those that did not (blue)). The complete list of articles that cited this IP is provided below along with the Deep Citation determination on usage. See the Deep Citation documentation for more information.
2 Citations (1 used)
Help us to determine which of the papers that cite this potential actually used it to perform calculations. If you know, click the .
USED (low confidence) C. Gerhard and R. Köhler, “Dependency of the type of oxygen bonds on the roughness of classically manufactured fused silica surfaces,” Applied Surface Science. 2023. link Times cited: 0
NOT USED (low confidence) O. Sodpiban et al., “Catalysts Prepared from Atomically Dispersed Ce(III) on MgO Rival Bulk Ceria for CO Oxidation.,” ACS applied materials & interfaces. 2023. link Times cited: 0
Abstract: Atomically dispersed cerium catalysts on an inert, crystalli… read more
Abstract: Atomically dispersed cerium catalysts on an inert, crystalline MgO powder support were prepared by using both Ce(III) and Ce(IV) precursors. The materials were used as catalysts for CO oxidation in a once-through flow reactor and characterized by atomic-resolution scanning transmission electron microscopy, X-ray absorption near-edge structure spectroscopy, X-ray photoelectron spectroscopy, and temperature-programmed reduction, among other techniques, before and after catalysis. The most active catalysts, formed from the precursor incorporating Ce(III), displayed performance similar to that reported for bulk ceria under comparable conditions. The catalyst provided stable time-on-stream performance for as long as it was kept on-stream, 2 days, increasing slightly in activity as the atomically dispersed cerium ions were transformed into ceria nanodomains represented as CeOx and having increased reducibility on the MgO support. The results suggest how highly dispersed supported ceria catalysts with low cerium loadings can be prepared and may pave the way for improved efficiencies of cerium utilization in oxidation catalysis. read less
The long form of the KIM ID including a human readable prefix (100 characters max), two underscores, and the Short KIM ID. Extended KIM IDs can only contain alpha-numeric characters (letters and digits) and underscores and must begin with a letter.
Periodic boundary conditions were NOT supported correctly for at least one configuration that the model was able to compute. This is an error in the implementation of the model.
vc-periodicity-support
mandatory
Periodic boundary conditions are handled correctly; see full description.
Model energy does NOT have permutation symmetry for at least one configuration that the model was able to compute. This indicates an error in the implementation of the model.
vc-permutation-symmetry
mandatory
Total energy and forces are unchanged when swapping atoms of the same species; see full description.
The letter grade D was assigned because the normalized error in the computation was 1.37930e-01 compared with a machine precision of 2.22045e-16. The letter grade was based on 'score=log10(error/eps)', with ranges A=[0, 7.5], B=(7.5, 10.0], C=(10.0, 12.5], D=(12.5, 15.0), F>15.0. 'A' is the best grade, and 'F' indicates failure.
vc-forces-numerical-derivative
consistency
Forces computed by the model agree with numerical derivatives of the energy; see full description.
The model is C^0 continuous. This means that the model has continuous energy, but a discontinuous first derivative.
vc-dimer-continuity-c1
informational
The energy versus separation relation of a pair of atoms is C1 continuous (i.e. the function and its first derivative are continuous); see full description.
Model energy and forces are invariant with respect to rigid-body motion (translation and rotation) for all configurations the model was able to compute.
vc-objectivity
informational
Total energy is unchanged and forces transform correctly under rigid-body translation and rotation; see full description.
The model returns the same energy and forces when computed in serial and when using parallel threads for a set of configurations. Note that this is not a guarantee of thread safety; see full description.
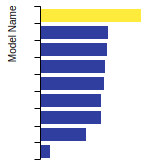
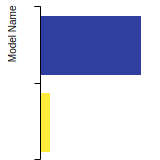
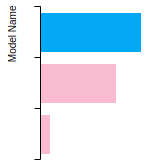
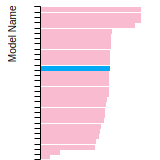
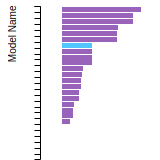
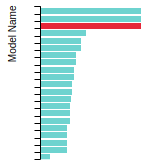
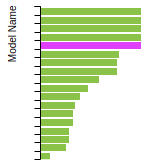
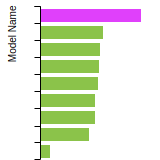
This bar chart plot shows the mono-atomic body-centered cubic (bcc) lattice constant predicted by the current model (shown in the unique color) compared with the predictions for all other models in the OpenKIM Repository that support the species. The vertical bars show the average and standard deviation (one sigma) bounds for all model predictions. Graphs are generated for each species supported by the model.
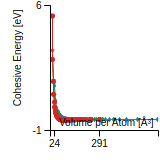
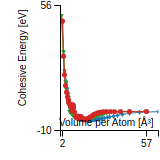
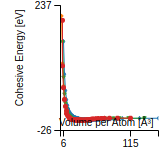
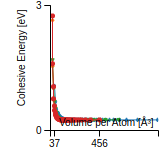
This graph shows the cohesive energy versus volume-per-atom for the current mode for four mono-atomic cubic phases (body-centered cubic (bcc), face-centered cubic (fcc), simple cubic (sc), and diamond). The curve with the lowest minimum is the ground state of the crystal if stable. (The crystal structure is enforced in these calculations, so the phase may not be stable.) Graphs are generated for each species supported by the model.
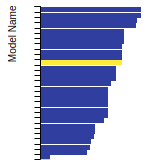
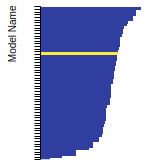
This bar chart plot shows the mono-atomic face-centered diamond lattice constant predicted by the current model (shown in the unique color) compared with the predictions for all other models in the OpenKIM Repository that support the species. The vertical bars show the average and standard deviation (one sigma) bounds for all model predictions. Graphs are generated for each species supported by the model.
This graph shows the dislocation core energy of a cubic crystal at zero temperature and pressure for a specific set of dislocation core cutoff radii. After obtaining the total energy of the system from conjugate gradient minimizations, non-singular, isotropic and anisotropic elasticity are applied to obtain the dislocation core energy for each of these supercells with different dipole distances. Graphs are generated for each species supported by the model.
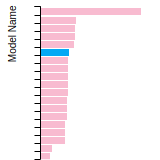
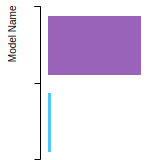
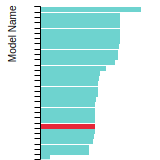
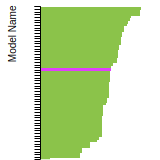
This bar chart plot shows the mono-atomic face-centered cubic (fcc) elastic constants predicted by the current model (shown in blue) compared with the predictions for all other models in the OpenKIM Repository that support the species. The vertical bars show the average and standard deviation (one sigma) bounds for all model predictions. Graphs are generated for each species supported by the model.
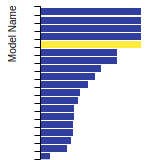
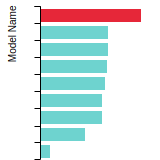
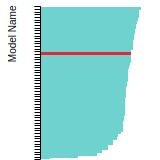
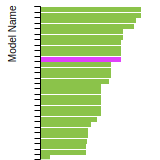
This bar chart plot shows the mono-atomic face-centered cubic (fcc) lattice constant predicted by the current model (shown in red) compared with the predictions for all other models in the OpenKIM Repository that support the species. The vertical bars show the average and standard deviation (one sigma) bounds for all model predictions. Graphs are generated for each species supported by the model.
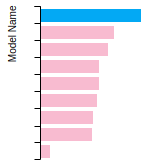
This bar chart plot shows the intrinsic and extrinsic stacking fault energies as well as the unstable stacking and unstable twinning energies for face-centered cubic (fcc) predicted by the current model (shown in blue) compared with the predictions for all other models in the OpenKIM Repository that support the species. The vertical bars show the average and standard deviation (one sigma) bounds for all model predictions. Graphs are generated for each species supported by the model.
This bar chart plot shows the mono-atomic face-centered cubic (fcc) relaxed surface energies predicted by the current model (shown in blue) compared with the predictions for all other models in the OpenKIM Repository that support the species. The vertical bars show the average and standard deviation (one sigma) bounds for all model predictions. Graphs are generated for each species supported by the model.
This bar chart plot shows the mono-atomic simple cubic (sc) lattice constant predicted by the current model (shown in the unique color) compared with the predictions for all other models in the OpenKIM Repository that support the species. The vertical bars show the average and standard deviation (one sigma) bounds for all model predictions. Graphs are generated for each species supported by the model.
Given an xyz file corresponding to a finite cluster of atoms, this Test Driver computes the total potential energy and atomic forces on the configuration. The positions are then relaxed using conjugate gradient minimization and the final positions and forces are recorded. These results are primarily of interest for training machine-learning algorithms.
Test
Test Results
Link to Test Results page
Benchmark time
Usertime multiplied by the Whetstone Benchmark. This number can be used (approximately) to compare the performance of different models independently of the architecture on which the test was run.
Measured in Millions of Whetstone Instructions (MWI)
This Test Driver uses LAMMPS to compute the cohesive energy of a given monoatomic cubic lattice (fcc, bcc, sc, or diamond) at a variety of lattice spacings. The lattice spacings range from a_min (=a_min_frac*a_0) to a_max (=a_max_frac*a_0) where a_0, a_min_frac, and a_max_frac are read from stdin (a_0 is typically approximately equal to the equilibrium lattice constant). The precise scaling and number of lattice spacings sampled between a_min and a_0 (a_0 and a_max) is specified by two additional parameters passed from stdin: N_lower and samplespacing_lower (N_upper and samplespacing_upper). Please see README.txt for further details.
Test
Test Results
Link to Test Results page
Benchmark time
Usertime multiplied by the Whetstone Benchmark. This number can be used (approximately) to compare the performance of different models independently of the architecture on which the test was run.
Measured in Millions of Whetstone Instructions (MWI)
This Test Driver computes the crystal structure and binding potential versus applied hydrostatic pressure for an arbitrary crystal. The crystal structure is specified using the AFLOW prototype designation. A scan over negative and positive hydrostatic pressures is performed, with a symmetry-constrained minimization of the cell and internal degrees of freedom at each step. Binding potential energy, volume, mass density, and the cell and internal crystal structure parameters are reported at each pressure step.
Test
Test Results
Link to Test Results page
Benchmark time
Usertime multiplied by the Whetstone Benchmark. This number can be used (approximately) to compare the performance of different models independently of the architecture on which the test was run.
Measured in Millions of Whetstone Instructions (MWI)
Computes the elastic constants for an arbitrary crystal. A robust computational protocol is used, attempting multiple methods and step sizes to achieve an acceptably low error in numerical differentiation and deviation from material symmetry. The crystal structure is specified using the AFLOW prototype designation as part of the Crystal Genome testing framework. In addition, the distance from the obtained elasticity tensor to the nearest isotropic tensor is computed.
Test
Test Results
Link to Test Results page
Benchmark time
Usertime multiplied by the Whetstone Benchmark. This number can be used (approximately) to compare the performance of different models independently of the architecture on which the test was run.
Measured in Millions of Whetstone Instructions (MWI)
Computes the cubic elastic constants for some common crystal types (fcc, bcc, sc, diamond) by calculating the hessian of the energy density with respect to strain. An estimate of the error associated with the numerical differentiation performed is reported.
Test
Test Results
Link to Test Results page
Benchmark time
Usertime multiplied by the Whetstone Benchmark. This number can be used (approximately) to compare the performance of different models independently of the architecture on which the test was run.
Measured in Millions of Whetstone Instructions (MWI)
Computes the equilibrium crystal structure and energy for an arbitrary crystal at zero temperature and applied stress by performing symmetry-constrained relaxation. The crystal structure is specified using the AFLOW prototype designation. Multiple sets of free parameters corresponding to the crystal prototype may be specified as initial guesses for structure optimization. No guarantee is made regarding the stability of computed equilibria, nor that any are the ground state.
Test
Test Results
Link to Test Results page
Benchmark time
Usertime multiplied by the Whetstone Benchmark. This number can be used (approximately) to compare the performance of different models independently of the architecture on which the test was run.
Measured in Millions of Whetstone Instructions (MWI)
Equilibrium lattice constant and cohesive energy of a cubic lattice at zero temperature and pressure.
Test
Test Results
Link to Test Results page
Benchmark time
Usertime multiplied by the Whetstone Benchmark. This number can be used (approximately) to compare the performance of different models independently of the architecture on which the test was run.
Measured in Millions of Whetstone Instructions (MWI)
Calculates lattice constant of hexagonal bulk structures at zero temperature and pressure by using simplex minimization to minimize the potential energy.
Test
Test Results
Link to Test Results page
Benchmark time
Usertime multiplied by the Whetstone Benchmark. This number can be used (approximately) to compare the performance of different models independently of the architecture on which the test was run.
Measured in Millions of Whetstone Instructions (MWI)
This Test Driver uses LAMMPS to compute the linear thermal expansion coefficient at a finite temperature under a given pressure for a cubic lattice (fcc, bcc, sc, diamond) of a single given species.
Test
Test Results
Link to Test Results page
Benchmark time
Usertime multiplied by the Whetstone Benchmark. This number can be used (approximately) to compare the performance of different models independently of the architecture on which the test was run.
Measured in Millions of Whetstone Instructions (MWI)
Usertime multiplied by the Whetstone Benchmark. This number can be used (approximately) to compare the performance of different models independently of the architecture on which the test was run.
Measured in Millions of Whetstone Instructions (MWI)
Given an extended xyz file corresponding to a non-orthogonal periodic box of atoms, use LAMMPS to compute the total potential energy and atomic forces.
Test
Test Results
Link to Test Results page
Benchmark time
Usertime multiplied by the Whetstone Benchmark. This number can be used (approximately) to compare the performance of different models independently of the architecture on which the test was run.
Measured in Millions of Whetstone Instructions (MWI)
Computes the monovacancy formation energy and relaxation volume for cubic and hcp monoatomic crystals.
Test
Test Results
Link to Test Results page
Benchmark time
Usertime multiplied by the Whetstone Benchmark. This number can be used (approximately) to compare the performance of different models independently of the architecture on which the test was run.
Measured in Millions of Whetstone Instructions (MWI)
Computes the monovacancy formation and migration energies for cubic and hcp monoatomic crystals.
Test
Test Results
Link to Test Results page
Benchmark time
Usertime multiplied by the Whetstone Benchmark. This number can be used (approximately) to compare the performance of different models independently of the architecture on which the test was run.
Measured in Millions of Whetstone Instructions (MWI)