 Tersoff_LAMMPS_ErhartJuslinGoy_2006_ZnO__MO_616776018688_004
| Title
A single sentence description.
|
Tersoff-style three-body potential for ZnO developed by Erhart et al. (2006) v004 |
|---|---|
| Description
A short description of the Model describing its key features including for example: type of model (pair potential, 3-body potential, EAM, etc.), modeled species (Ac, Ag, ..., Zr), intended purpose, origin, and so on.
|
Tersoff-style three-body potential for ZnO developed by Erhart, Juslin, Goy, Nordlund, Müller, and Albe. |
| Species
The supported atomic species.
| O, Zn |
| Disclaimer
A statement of applicability provided by the contributor, informing users of the intended use of this KIM Item.
|
None |
| Contributor |
Tobias Brink |
| Maintainer |
Tobias Brink |
| Implementer | Tobias Brink |
| Developer |
Paul Erhart Niklas Juslin Oliver Goy Kai Nordlund Ralf Müller Karsten Albe |
| Published on KIM | 2021 |
| How to Cite |
This Model originally published in [1] is archived in OpenKIM [2-5]. [1] Erhart P, Juslin N, Goy O, Nordlund K, Müller R, Albe K. Analytic bond-order potential for atomistic simulations of zinc oxide. Journal of Physics: Condensed Matter. 2006;18(29):6585. doi:10.1088/0953-8984/18/29/003 — (Primary Source) A primary source is a reference directly related to the item documenting its development, as opposed to other sources that are provided as background information. [2] Brink T, Erhart P, Juslin N, Goy O, Nordlund K, Müller R, et al. Tersoff-style three-body potential for ZnO developed by Erhart et al. (2006) v004. OpenKIM; 2021. doi:10.25950/2dce785b [3] Brink T, Thompson AP, Farrell DE, Wen M, Tersoff J, Nord J, et al. Model driver for Tersoff-style potentials ported from LAMMPS v005. OpenKIM; 2021. doi:10.25950/9a7dc96c [4] Tadmor EB, Elliott RS, Sethna JP, Miller RE, Becker CA. The potential of atomistic simulations and the Knowledgebase of Interatomic Models. JOM. 2011;63(7):17. doi:10.1007/s11837-011-0102-6 [5] Elliott RS, Tadmor EB. Knowledgebase of Interatomic Models (KIM) Application Programming Interface (API). OpenKIM; 2011. doi:10.25950/ff8f563a Click here to download the above citation in BibTeX format. |
| Citations
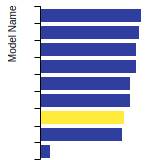
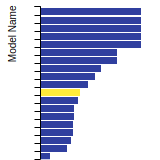
This panel presents information regarding the papers that have cited the interatomic potential (IP) whose page you are on. The OpenKIM machine learning based Deep Citation framework is used to determine whether the citing article actually used the IP in computations (denoted by "USED") or only provides it as a background citation (denoted by "NOT USED"). For more details on Deep Citation and how to work with this panel, click the documentation link at the top of the panel. The word cloud to the right is generated from the abstracts of IP principle source(s) (given below in "How to Cite") and the citing articles that were determined to have used the IP in order to provide users with a quick sense of the types of physical phenomena to which this IP is applied. The bar chart shows the number of articles that cited the IP per year. Each bar is divided into green (articles that USED the IP) and blue (articles that did NOT USE the IP). Users are encouraged to correct Deep Citation errors in determination by clicking the speech icon next to a citing article and providing updated information. This will be integrated into the next Deep Citation learning cycle, which occurs on a regular basis. OpenKIM acknowledges the support of the Allen Institute for AI through the Semantic Scholar project for providing citation information and full text of articles when available, which are used to train the Deep Citation ML algorithm. |
This panel provides information on past usage of this interatomic potential (IP) powered by the OpenKIM Deep Citation framework. The word cloud indicates typical applications of the potential. The bar chart shows citations per year of this IP (bars are divided into articles that used the IP (green) and those that did not (blue)). The complete list of articles that cited this IP is provided below along with the Deep Citation determination on usage. See the Deep Citation documentation for more information. 
65 Citations (36 used)
Help us to determine which of the papers that cite this potential actually used it to perform calculations. If you know, click the .
USED (high confidence) H. Amekura et al., “On the mechanism of the shape elongation of embedded nanoparticles,” Nuclear Instruments & Methods in Physics Research Section B-beam Interactions With Materials and Atoms. 2020. link Times cited: 9 USED (high confidence) E. Hodille, J. Byggmästar, E. Safi, and K. Nordlund, “Sputtering of beryllium oxide by deuterium at various temperatures simulated with molecular dynamics,” Physica Scripta. 2020. link Times cited: 12 Abstract: The sputtering yield of beryllium oxide (BeO) by incident de… read more USED (high confidence) H. Amekura et al., “Vaporlike phase of amorphous
SiO2
is not a prerequisite for the core/shell ion tracks or ion shaping,” Physical Review Materials. 2018. link Times cited: 9 Abstract: The SHI irradiations were performed under the CommonUse Faci… read more USED (high confidence) I. Gheewala, S. Kenny, and R. Smith, “Atomistic-scale modelling of nanoindentation into optical coatings,” Philosophical Magazine. 2009. link Times cited: 4 Abstract: Simulations of nanoindentation into a typical optical-coatin… read more USED (low confidence) B. Agoubi and M. Zemzemi, “Electronic and thermoelectric properties of ZnO/Cu2O heterostructures: First principles calculations,” Ferroelectrics. 2023. link Times cited: 0 Abstract: In this study, we have performed Density Functional Theory c… read more USED (low confidence) S. Burlison, M. Becker, and D. Kovar, “A molecular dynamics study of the effects of velocity and diameter on the impact behavior of zinc oxide nanoparticles,” Modelling and Simulation in Materials Science and Engineering. 2023. link Times cited: 0 Abstract: Molecular dynamics simulations of particle impact have been … read more USED (low confidence) B. Yao, Z. R. Liu, D. Legut, and R. F. Zhang, “Hybrid potential model with high feasibility and flexibility for metallic and covalent solids,” Physical Review B. 2023. link Times cited: 0 USED (low confidence) M. Moin et al., “A comprehensive correlated analysis of Ra-Doped (ZnO_2, ZnO) for optoelectronic applications: a first-principle study,” Journal of Molecular Modeling. 2023. link Times cited: 0 USED (low confidence) G. Clavier and A. Thompson, “Computation of the thermal elastic constants for arbitrary manybody potentials in LAMMPS using the stress-fluctuation formalism,” Comput. Phys. Commun. 2023. link Times cited: 1 USED (low confidence) K. Ren, L. Liu, J. Li, H. Pan, and Z. Wang, “Lubrication Behavior of n-hexadecane on ZnO Layer at the Nanoscale: A Molecular Dynamic Exploration,” Tribology Letters. 2022. link Times cited: 1 USED (low confidence) E. Hodille, J. Byggmästar, Y. Ferro, and K. Nordlund, “Molecular dynamics study of hydrogen isotopes at the Be/BeO interface,” Journal of Physics: Condensed Matter. 2022. link Times cited: 3 Abstract: Molecular dynamics simulations are used to investigate the b… read more USED (low confidence) X. Zhu and X. Cheng, “Molecular dynamics study of tilt grain boundary evolution during the growth of beryllium thin films,” Journal of Crystal Growth. 2020. link Times cited: 0 USED (low confidence) G. Plummer and G. Tucker, “Bond-order potentials for theTi3AlC2andTi3SiC2MAX phases,” Physical Review B. 2019. link Times cited: 12 USED (low confidence) J. Byggmästar, M. J. Nagel, K. Albe, K. Henriksson, and K. Nordlund, “Analytical interatomic bond-order potential for simulations of oxygen defects in iron,” Journal of Physics: Condensed Matter. 2019. link Times cited: 11 Abstract: We present an analytical bond-order potential for the Fe–O s… read more USED (low confidence) E. Hodille, J. Byggmästar, E. Safi, and K. Nordlund, “Molecular dynamics simulation of beryllium oxide irradiated by deuterium ions: sputtering and reflection,” Journal of Physics: Condensed Matter. 2019. link Times cited: 10 Abstract: The sputtering and reflection properties of wurtzite berylli… read more USED (low confidence) M. Mock and K. Albe, “Modelling of dislocation-solute interaction in ODS steels: Analytic bond-order potential for the iron-yttrium system,” Journal of Nuclear Materials. 2018. link Times cited: 6 USED (low confidence) L. S. I. Liyanage et al., “From Electrons to Atoms: Designing an Interatomic Potential for Fe-C Alloys.” 2018. link Times cited: 0 USED (low confidence) Y. Chergui, T. Aouaroun, M. Hadley, R. Belkada, R. Chemam, and D. Mekki, “Molecular dynamics simulation of ZnO wurtzite phase under high and low pressures and temperatures,” Materials Research Express. 2017. link Times cited: 1 Abstract: Isothermal and isobaric ensembles behaviours of ZnO wurtzite… read more USED (low confidence) K. Albe, P. Ágoston, and J. Pohl, “Ab InitioModeling of Defects in Semiconductors.” 2016. link Times cited: 0 USED (low confidence) Y. Liu, M. Shahzad, and Y. Qi, “Growth of a-axis ZnO films on the defective substrate with different O/Zn ratios: A reactive force field based molecular dynamics study,” Journal of Alloys and Compounds. 2015. link Times cited: 7 USED (low confidence) T. Liang et al., “Classical atomistic simulations of surfaces and heterogeneous interfaces with the charge-optimized many body (COMB) potentials,” Materials Science & Engineering R-reports. 2013. link Times cited: 207 USED (low confidence) Y.-T. Cheng et al., “Atomistic simulations of the adsorption and migration barriers of Cu adatoms on ZnO surfaces using COMB potentials,” Surface Science. 2012. link Times cited: 25 USED (low confidence) D. Zagorac, J. C. Schön, and M. Jansen, “Energy Landscape Investigations Using the Prescribed Path Method in the ZnO System,” Journal of Physical Chemistry C. 2012. link Times cited: 29 Abstract: An important issue in modern solid-state chemistry and nanot… read more USED (low confidence) P. M. Diehm, P. Ágoston, and K. Albe, “Size-dependent lattice expansion in nanoparticles: reality or anomaly?,” Chemphyschem : a European journal of chemical physics and physical chemistry. 2012. link Times cited: 180 Abstract: Size-dependent lattice expansion of nanoparticles is observe… read more USED (low confidence) K. Albe, P. Ágoston, and J. Pohl, “Ab‐Initio Modeling of Defects in Semiconductors.” 2011. link Times cited: 1 USED (low confidence) O. Pakarinen, F. Djurabekova, and K. Nordlund, “Density evolution in formation of swift heavy ion tracks in insulators,” Nuclear Instruments & Methods in Physics Research Section B-beam Interactions With Materials and Atoms. 2010. link Times cited: 27 USED (low confidence) S. Deulkar, H. Yo, and J.-L. Huang, “Tem-based investigations on CVD-assisted growth of ZnO nanowires inside nanochannels of anodized aluminum Oxide template,” International Journal of Nanoscience. 2010. link Times cited: 1 Abstract: The role of Chemical Vapor Deposition's (CVD) temperatu… read more USED (low confidence) T. E. Mølholt et al., “Temperature and dose dependence of defect complex formation with ion implanted Mn/Fe in ZnO,” Physica B-condensed Matter. 2009. link Times cited: 15 USED (low confidence) B. Coasne, A. Mezy, R. Pellenq, D. Ravot, and J. Tedenac, “Zinc oxide nanostructures confined in porous silicas.,” Journal of the American Chemical Society. 2009. link Times cited: 18 Abstract: We report on molecular simulations of zinc oxide nanostructu… read more USED (low confidence) C. R. Catlow, S. French, A. Sokol, A. Al-Sunaidi, and S. Woodley, “Zinc oxide: A case study in contemporary computational solid state chemistry,” Journal of Computational Chemistry. 2008. link Times cited: 101 Abstract: Computational techniques have been applied to study a broad … read more USED (low confidence) J. Wróbel and J. Piechota, “On the structural stability of ZnO phases,” Solid State Communications. 2008. link Times cited: 38 USED (low confidence) K. Nordlund and S. Dudarev, “Interatomic potentials for simulating radiation damage effects in metals,” Comptes Rendus Physique. 2008. link Times cited: 29 USED (low confidence) M. Müller, P. Erhart, and K. Albe, “Thermodynamics of L 1 0 ordering in FePt nanoparticles studied by Monte Carlo simulations based on an analytic bond-order potential,” Physical Review B. 2007. link Times cited: 64 Abstract: The size dependence of the order-disorder transition in FePt… read more USED (low confidence) S. M. Zamzamian, S. Feghhi, and M. Samadfam, “Theoretical and computational investigation on the radiation-induced point defects in cementite: Picosecond timescale,” Journal of Nuclear Materials. 2021. link Times cited: 1 USED (low confidence) R. Evarestov, “Binary Oxides of Transition Metals: ZnO, TiO$_2, ZrO_2, HfO_2$.” 2020. link Times cited: 0 USED (low confidence) K. Ellmer, “Transparent Conductive Zinc Oxide and Its Derivatives.” 2011. link Times cited: 46 NOT USED (low confidence) D. Raymand, A. Duin, M. Baudin, and K. Hermansson, “A reactive force field (ReaxFF) for zinc oxide,” Surface Science. 2008. link Times cited: 127 NOT USED (low confidence) R. Jones, C. Weinberger, S. Coleman, and G. Tucker, “Introduction to Atomistic Simulation Methods.” 2016. link Times cited: 1 NOT USED (high confidence) J. Goniakowski, S. Menon, G. Laurens, and J. Lam, “Nonclassical Nucleation of Zinc Oxide from a Physically Motivated Machine-Learning Approach,” The Journal of Physical Chemistry C. 2021. link Times cited: 3 Abstract: Observing non-classical nucleation pathways remains challeng… read more NOT USED (high confidence) Z. Fan, Y. Wang, X. Gu, P. Qian, Y. Su, and T. Ala‐Nissila, “A minimal Tersoff potential for diamond silicon with improved descriptions of elastic and phonon transport properties,” Journal of Physics: Condensed Matter. 2019. link Times cited: 10 Abstract: Silicon is an important material and many empirical interato… read more NOT USED (high confidence) X. Zhu and Y. Lu, “Growth of beryllium thin films on beryllium (0001) surface: Influence of incident energy and incident angle by molecular dynamics simulation,” Journal of Applied Physics. 2018. link Times cited: 5 Abstract: The morphology and microstructure of metallic thin films syn… read more NOT USED (high confidence) J. Byggmästar, E. Hodille, Y. Ferro, and K. Nordlund, “Analytical bond order potential for simulations of BeO 1D and 2D nanostructures and plasma-surface interactions,” Journal of Physics: Condensed Matter. 2018. link Times cited: 18 Abstract: An analytical interatomic bond order potential for the Be–O … read more NOT USED (high confidence) A. Galashev and O. Rakhmanova, “Computer study the oxygen release from Al melts,” Modelling and Simulation in Materials Science and Engineering. 2018. link Times cited: 1 Abstract: The behavior of oxygen ions in the Al melts under action of … read more NOT USED (high confidence) B. Narayanan et al., “Machine learnt bond order potential to model metal-organic (Co-C) heterostructures.,” Nanoscale. 2017. link Times cited: 7 Abstract: A fundamental understanding of the inter-relationships betwe… read more NOT USED (high confidence) A. Bandura, R. Evarestov, S. I. Lukyanov, S. Piskunov, and Y. Zhukovskii, “Simulation of Young’s moduli for hexagonal ZnO [0 0 0 1]-oriented nanowires: first principles and molecular mechanical calculations,” Materials Research Express. 2017. link Times cited: 10 Abstract: Morphologically reproducible wurtzite-structured zinc oxide … read more NOT USED (high confidence) O. Turkay, H. Inan, and A. Dimoglo, “Experimental and theoretical study on catalytic ozonation of humic acid by ZnO catalyst,” Separation Science and Technology. 2017. link Times cited: 9 Abstract: ABSTRACT Ozonation and catalytic ozonation of humic acid (HA… read more NOT USED (high confidence) A. Stukowski, E. Fransson, M. Mock, and P. Erhart, “Atomicrex—a general purpose tool for the construction of atomic interaction models,” Modelling and Simulation in Materials Science and Engineering. 2017. link Times cited: 17 Abstract: We introduce atomicrex, an open-source code for constructing… read more NOT USED (high confidence) Z. Fan, “Molecular Simulations of Nanoscale Transformations in Ionic Semiconductor Nanocrystals.” 2016. link Times cited: 0 Abstract: The aim of the study described in this thesis is to obtain a… read more NOT USED (high confidence) B. Narayanan et al., “Describing the Diverse Geometries of Gold from Nanoclusters to Bulk—A First-Principles-Based Hybrid Bond-Order Potential,” Journal of Physical Chemistry C. 2015. link Times cited: 27 Abstract: Molecular dynamics simulations using empirical force fields … read more NOT USED (high confidence) T. Burian et al., “Soft x-ray free-electron laser induced damage to inorganic scintillators,” Optical Materials Express. 2015. link Times cited: 12 Abstract: An irreversible response of inorganic scintillators to inten… read more NOT USED (high confidence) K. Nordlund, C. Björkas, T. Ahlgren, A. Lasa, and A. Sand, “Multiscale modelling of plasma–wall interactions in fusion reactor conditions,” Journal of Physics D: Applied Physics. 2014. link Times cited: 58 Abstract: The interaction of fusion reactor plasma with the material o… read more NOT USED (high confidence) S. Wang et al., “New Ab Initio Based Pair Potential for Accurate Simulation of Phase Transitions in ZnO,” Journal of Physical Chemistry C. 2014. link Times cited: 42 Abstract: A set of interatomic pair potentials is developed for ZnO ba… read more NOT USED (high confidence) K. Nordlund and F. Djurabekova, “Multiscale modelling of irradiation in nanostructures,” Journal of Computational Electronics. 2014. link Times cited: 42 NOT USED (high confidence) K. Li, W. Yang, J. Wei, S. Du, and Y. Li, “Modeling of metal–oxide semiconductor: Analytical bond-order potential for cupric oxide,” Chinese Physics B. 2014. link Times cited: 0 Abstract: Atomistic potentials for cupric element and cupric oxide are… read more NOT USED (high confidence) K. Henriksson, C. Björkas, and K. Nordlund, “Atomistic simulations of stainless steels: a many-body potential for the Fe–Cr–C system,” Journal of Physics: Condensed Matter. 2013. link Times cited: 65 Abstract: Stainless steels found in real-world applications usually ha… read more NOT USED (high confidence) L. Pastewka, A. Klemenz, P. Gumbsch, and M. Moseler, “Screened empirical bond-order potentials for Si-C,” Physical Review B. 2013. link Times cited: 110 Abstract: Typical empirical bond-order potentials are short ranged and… read more NOT USED (high confidence) M. Backman, N. Juslin, and K. Nordlund, “Bond order potential for gold,” The European Physical Journal B. 2012. link Times cited: 11 NOT USED (high confidence) L. Pastewka, M. Mrovec, M. Moseler, and P. Gumbsch, “Bond order potentials for fracture, wear, and plasticity,” MRS Bulletin. 2012. link Times cited: 55 Abstract: Coulson’s bond order is a chemically intuitive quantity that… read more NOT USED (high confidence) S. Peng et al., “Bond-Order Potential for Erbium-Hydride System,” Journal of Physical Chemistry C. 2011. link Times cited: 7 Abstract: Interatomic potentials for an Er-H system are derived based … read more NOT USED (high confidence) M. Hu, K. Giapis, and D. Poulikakos, “Interfacial mixing during annealing of zinc oxide nanoparticle junctions,” Applied Physics Letters. 2011. link Times cited: 9 Abstract: The process of forming a junction between crystalline zinc o… read more NOT USED (high confidence) P. Kessler, K. Lorenz, and R. Vianden, “Implanted Impurities in Wide Band Gap Semiconductors,” Defect and Diffusion Forum. 2011. link Times cited: 8 Abstract: Wide band gap semiconductors, mainly GaN, have experienced m… read more NOT USED (high confidence) A. Krasheninnikov and K. Nordlund, “Ion and electron irradiation-induced effects in nanostructured materials,” Journal of Applied Physics. 2010. link Times cited: 877 Abstract: A common misconception is that the irradiation of solids wit… read more NOT USED (high confidence) C. Sanz-Navarro et al., “Molecular Dynamics Simulations of Carbon-Supported Ni Clusters Using the Reax Reactive Force Field,” Journal of Physical Chemistry C. 2008. link Times cited: 30 Abstract: Molecular dynamics simulations have been performed using a R… read more NOT USED (high confidence) D. Tainoff, B. Masenelli, O. Boisron, G. Guiraud, and P. Mélinon, “Crystallinity, Stoichiometry, and Luminescence of High Quality ZnO Nanoclusters,” Journal of Physical Chemistry C. 2008. link Times cited: 26 Abstract: Quasiperfect ZnO nanoclusters (∼6 nm in diameter) are synthe… read more NOT USED (high confidence) A. Caro, M. Caro, P. Klaver, B. Sadigh, E. M. Lopasso, and S. G. Srinivasan, “The computational modeling of alloys at the atomic scale: From ab initio and thermodynamics to radiation-induced heterogeneous precipitation,” JOM. 2007. link Times cited: 19 |
| Funding | Not available |
| Short KIM ID
The unique KIM identifier code.
| MO_616776018688_004 |
| Extended KIM ID
The long form of the KIM ID including a human readable prefix (100 characters max), two underscores, and the Short KIM ID. Extended KIM IDs can only contain alpha-numeric characters (letters and digits) and underscores and must begin with a letter.
| Tersoff_LAMMPS_ErhartJuslinGoy_2006_ZnO__MO_616776018688_004 |
| DOI |
10.25950/2dce785b https://doi.org/10.25950/2dce785b https://commons.datacite.org/doi.org/10.25950/2dce785b |
| KIM Item Type
Specifies whether this is a Portable Model (software implementation of an interatomic model); Portable Model with parameter file (parameter file to be read in by a Model Driver); Model Driver (software implementation of an interatomic model that reads in parameters).
| Portable Model using Model Driver Tersoff_LAMMPS__MD_077075034781_005 |
| Driver | Tersoff_LAMMPS__MD_077075034781_005 |
| KIM API Version | 2.2 |
| Potential Type | tersoff |
| Previous Version | Tersoff_LAMMPS_ErhartJuslinGoy_2006_ZnO__MO_616776018688_003 |
| Grade | Name | Category | Brief Description | Full Results | Aux File(s) |
|---|---|---|---|---|---|
| P | vc-species-supported-as-stated | mandatory | The model supports all species it claims to support; see full description. |
Results | Files |
| P | vc-periodicity-support | mandatory | Periodic boundary conditions are handled correctly; see full description. |
Results | Files |
| P | vc-permutation-symmetry | mandatory | Total energy and forces are unchanged when swapping atoms of the same species; see full description. |
Results | Files |
| A | vc-forces-numerical-derivative | consistency | Forces computed by the model agree with numerical derivatives of the energy; see full description. |
Results | Files |
| P | vc-dimer-continuity-c1 | informational | The energy versus separation relation of a pair of atoms is C1 continuous (i.e. the function and its first derivative are continuous); see full description. |
Results | Files |
| P | vc-objectivity | informational | Total energy is unchanged and forces transform correctly under rigid-body translation and rotation; see full description. |
Results | Files |
| P | vc-inversion-symmetry | informational | Total energy is unchanged and forces change sign when inverting a configuration through the origin; see full description. |
Results | Files |
| P | vc-memory-leak | informational | The model code does not have memory leaks (i.e. it releases all allocated memory at the end); see full description. |
Results | Files |
| P | vc-thread-safe | mandatory | The model returns the same energy and forces when computed in serial and when using parallel threads for a set of configurations. Note that this is not a guarantee of thread safety; see full description. |
Results | Files |
| N/A | vc-unit-conversion | mandatory | The model is able to correctly convert its energy and/or forces to different unit sets; see full description. |
Results | Files |
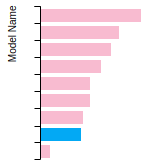
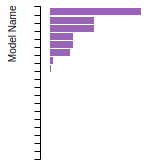
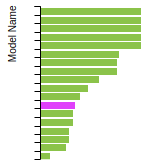
BCC Lattice Constant
This bar chart plot shows the mono-atomic body-centered cubic (bcc) lattice constant predicted by the current model (shown in the unique color) compared with the predictions for all other models in the OpenKIM Repository that support the species. The vertical bars show the average and standard deviation (one sigma) bounds for all model predictions. Graphs are generated for each species supported by the model.
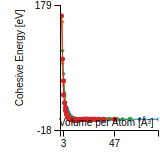
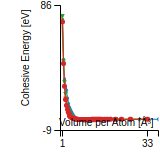
Cohesive Energy Graph
This graph shows the cohesive energy versus volume-per-atom for the current mode for four mono-atomic cubic phases (body-centered cubic (bcc), face-centered cubic (fcc), simple cubic (sc), and diamond). The curve with the lowest minimum is the ground state of the crystal if stable. (The crystal structure is enforced in these calculations, so the phase may not be stable.) Graphs are generated for each species supported by the model.
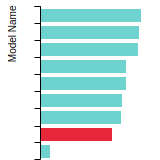
Diamond Lattice Constant
This bar chart plot shows the mono-atomic face-centered diamond lattice constant predicted by the current model (shown in the unique color) compared with the predictions for all other models in the OpenKIM Repository that support the species. The vertical bars show the average and standard deviation (one sigma) bounds for all model predictions. Graphs are generated for each species supported by the model.
Dislocation Core Energies
This graph shows the dislocation core energy of a cubic crystal at zero temperature and pressure for a specific set of dislocation core cutoff radii. After obtaining the total energy of the system from conjugate gradient minimizations, non-singular, isotropic and anisotropic elasticity are applied to obtain the dislocation core energy for each of these supercells with different dipole distances. Graphs are generated for each species supported by the model.
(No matching species)FCC Elastic Constants
This bar chart plot shows the mono-atomic face-centered cubic (fcc) elastic constants predicted by the current model (shown in blue) compared with the predictions for all other models in the OpenKIM Repository that support the species. The vertical bars show the average and standard deviation (one sigma) bounds for all model predictions. Graphs are generated for each species supported by the model.
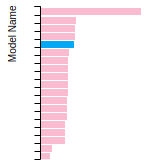
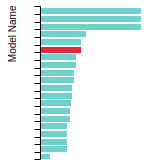
FCC Lattice Constant
This bar chart plot shows the mono-atomic face-centered cubic (fcc) lattice constant predicted by the current model (shown in red) compared with the predictions for all other models in the OpenKIM Repository that support the species. The vertical bars show the average and standard deviation (one sigma) bounds for all model predictions. Graphs are generated for each species supported by the model.
FCC Stacking Fault Energies
This bar chart plot shows the intrinsic and extrinsic stacking fault energies as well as the unstable stacking and unstable twinning energies for face-centered cubic (fcc) predicted by the current model (shown in blue) compared with the predictions for all other models in the OpenKIM Repository that support the species. The vertical bars show the average and standard deviation (one sigma) bounds for all model predictions. Graphs are generated for each species supported by the model.
(No matching species)FCC Surface Energies
This bar chart plot shows the mono-atomic face-centered cubic (fcc) relaxed surface energies predicted by the current model (shown in blue) compared with the predictions for all other models in the OpenKIM Repository that support the species. The vertical bars show the average and standard deviation (one sigma) bounds for all model predictions. Graphs are generated for each species supported by the model.
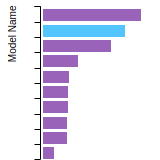
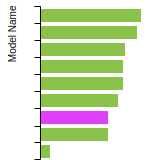
(No matching species)SC Lattice Constant
This bar chart plot shows the mono-atomic simple cubic (sc) lattice constant predicted by the current model (shown in the unique color) compared with the predictions for all other models in the OpenKIM Repository that support the species. The vertical bars show the average and standard deviation (one sigma) bounds for all model predictions. Graphs are generated for each species supported by the model.
Cubic Crystal Basic Properties Table
Species: OSpecies: Zn
Creators:
Contributor: karls
Publication Year: 2019
DOI: https://doi.org/10.25950/64cb38c5
This Test Driver uses LAMMPS to compute the cohesive energy of a given monoatomic cubic lattice (fcc, bcc, sc, or diamond) at a variety of lattice spacings. The lattice spacings range from a_min (=a_min_frac*a_0) to a_max (=a_max_frac*a_0) where a_0, a_min_frac, and a_max_frac are read from stdin (a_0 is typically approximately equal to the equilibrium lattice constant). The precise scaling and number of lattice spacings sampled between a_min and a_0 (a_0 and a_max) is specified by two additional parameters passed from stdin: N_lower and samplespacing_lower (N_upper and samplespacing_upper). Please see README.txt for further details.
| Test | Test Results | Link to Test Results page | Benchmark time
Usertime multiplied by the Whetstone Benchmark. This number can be used (approximately) to compare the performance of different models independently of the architecture on which the test was run.
Measured in Millions of Whetstone Instructions (MWI) |
|---|---|---|---|
| Cohesive energy versus lattice constant curve for bcc O v004 | view | 2477 | |
| Cohesive energy versus lattice constant curve for bcc Zn v004 | view | 2367 | |
| Cohesive energy versus lattice constant curve for diamond O v004 | view | 2503 | |
| Cohesive energy versus lattice constant curve for diamond Zn v004 | view | 2258 | |
| Cohesive energy versus lattice constant curve for fcc O v004 | view | 2503 | |
| Cohesive energy versus lattice constant curve for fcc Zn v004 | view | 2429 | |
| Cohesive energy versus lattice constant curve for sc O v004 | view | 2298 | |
| Cohesive energy versus lattice constant curve for sc Zn v004 | view | 2208 |
Creators:
Contributor: ilia
Publication Year: 2024
DOI: https://doi.org/10.25950/888f9943
Computes the elastic constants for an arbitrary crystal. A robust computational protocol is used, attempting multiple methods and step sizes to achieve an acceptably low error in numerical differentiation and deviation from material symmetry. The crystal structure is specified using the AFLOW prototype designation as part of the Crystal Genome testing framework. In addition, the distance from the obtained elasticity tensor to the nearest isotropic tensor is computed.
| Test | Test Results | Link to Test Results page | Benchmark time
Usertime multiplied by the Whetstone Benchmark. This number can be used (approximately) to compare the performance of different models independently of the architecture on which the test was run.
Measured in Millions of Whetstone Instructions (MWI) |
|---|---|---|---|
| Elastic constants for OZn in AFLOW crystal prototype A2B_cP12_205_c_a at zero temperature and pressure v000 | view | 391735 |
Creators: Junhao Li and Ellad Tadmor
Contributor: tadmor
Publication Year: 2019
DOI: https://doi.org/10.25950/5853fb8f
Computes the cubic elastic constants for some common crystal types (fcc, bcc, sc, diamond) by calculating the hessian of the energy density with respect to strain. An estimate of the error associated with the numerical differentiation performed is reported.
| Test | Test Results | Link to Test Results page | Benchmark time
Usertime multiplied by the Whetstone Benchmark. This number can be used (approximately) to compare the performance of different models independently of the architecture on which the test was run.
Measured in Millions of Whetstone Instructions (MWI) |
|---|---|---|---|
| Elastic constants for bcc O at zero temperature v006 | view | 10135 | |
| Elastic constants for bcc Zn at zero temperature v006 | view | 3727 | |
| Elastic constants for diamond Zn at zero temperature v001 | view | 23258 | |
| Elastic constants for fcc O at zero temperature v006 | view | 12820 | |
| Elastic constants for fcc Zn at zero temperature v006 | view | 4696 | |
| Elastic constants for sc O at zero temperature v006 | view | 12084 | |
| Elastic constants for sc Zn at zero temperature v006 | view | 19531 |
Creators:
Contributor: ilia
Publication Year: 2024
DOI: https://doi.org/10.25950/2f2c4ad3
Computes the equilibrium crystal structure and energy for an arbitrary crystal at zero temperature and applied stress by performing symmetry-constrained relaxation. The crystal structure is specified using the AFLOW prototype designation. Multiple sets of free parameters corresponding to the crystal prototype may be specified as initial guesses for structure optimization. No guarantee is made regarding the stability of computed equilibria, nor that any are the ground state.
Creators: Daniel S. Karls and Junhao Li
Contributor: karls
Publication Year: 2019
DOI: https://doi.org/10.25950/2765e3bf
Equilibrium lattice constant and cohesive energy of a cubic lattice at zero temperature and pressure.
| Test | Test Results | Link to Test Results page | Benchmark time
Usertime multiplied by the Whetstone Benchmark. This number can be used (approximately) to compare the performance of different models independently of the architecture on which the test was run.
Measured in Millions of Whetstone Instructions (MWI) |
|---|---|---|---|
| Equilibrium zero-temperature lattice constant for bcc O v007 | view | 7161 | |
| Equilibrium zero-temperature lattice constant for bcc Zn v007 | view | 3541 | |
| Equilibrium zero-temperature lattice constant for diamond O v007 | view | 3205 | |
| Equilibrium zero-temperature lattice constant for diamond Zn v007 | view | 3578 | |
| Equilibrium zero-temperature lattice constant for fcc O v007 | view | 3690 | |
| Equilibrium zero-temperature lattice constant for fcc Zn v007 | view | 7619 | |
| Equilibrium zero-temperature lattice constant for sc O v007 | view | 2944 | |
| Equilibrium zero-temperature lattice constant for sc Zn v007 | view | 3504 |
Creators: Daniel S. Karls and Junhao Li
Contributor: karls
Publication Year: 2019
DOI: https://doi.org/10.25950/c339ca32
Calculates lattice constant of hexagonal bulk structures at zero temperature and pressure by using simplex minimization to minimize the potential energy.
| Test | Test Results | Link to Test Results page | Benchmark time
Usertime multiplied by the Whetstone Benchmark. This number can be used (approximately) to compare the performance of different models independently of the architecture on which the test was run.
Measured in Millions of Whetstone Instructions (MWI) |
|---|---|---|---|
| Equilibrium lattice constants for hcp Zn v005 | view | 42091 |
Creators:
Contributor: efuem
Publication Year: 2023
DOI: https://doi.org/10.25950/fca89cea
Computes the monovacancy formation energy and relaxation volume for cubic and hcp monoatomic crystals.
| Test | Test Results | Link to Test Results page | Benchmark time
Usertime multiplied by the Whetstone Benchmark. This number can be used (approximately) to compare the performance of different models independently of the architecture on which the test was run.
Measured in Millions of Whetstone Instructions (MWI) |
|---|---|---|---|
| Monovacancy formation energy and relaxation volume for hcp Zn | view | 665014 |
Creators:
Contributor: efuem
Publication Year: 2023
DOI: https://doi.org/10.25950/c27ba3cd
Computes the monovacancy formation and migration energies for cubic and hcp monoatomic crystals.
| Test | Test Results | Link to Test Results page | Benchmark time
Usertime multiplied by the Whetstone Benchmark. This number can be used (approximately) to compare the performance of different models independently of the architecture on which the test was run.
Measured in Millions of Whetstone Instructions (MWI) |
|---|---|---|---|
| Vacancy formation and migration energy for hcp Zn | view | 1747383 | |
| Vacancy formation and migration energy for sc O | view | 4678730 |
| Test | Error Categories | Link to Error page |
|---|---|---|
| Elastic constants for diamond O at zero temperature v001 | other | view |
ElasticConstantsHexagonal__TD_612503193866_004
| Test | Error Categories | Link to Error page |
|---|---|---|
| Elastic constants for hcp Zn at zero temperature v004 | other | view |
EquilibriumCrystalStructure__TD_457028483760_000
| Test | Error Categories | Link to Error page |
|---|---|---|
| Equilibrium crystal structure and energy for Zn in AFLOW crystal prototype A_hP2_194_c v000 | other | view |
| Equilibrium crystal structure and energy for O in AFLOW crystal prototype A_mC4_12_i v000 | other | view |
LatticeConstantHexagonalEnergy__TD_942334626465_005
| Test | Error Categories | Link to Error page |
|---|---|---|
| Equilibrium lattice constants for hcp O v005 | other | view |
VacancyFormationEnergyRelaxationVolume__TD_647413317626_001
| Test | Error Categories | Link to Error page |
|---|---|---|
| Monovacancy formation energy and relaxation volume for sc O | other | view |
No Driver
| Verification Check | Error Categories | Link to Error page |
|---|---|---|
| MemoryLeak__VC_561022993723_004 | other | view |
| PeriodicitySupport__VC_895061507745_002 | other | view |
| Tersoff_LAMMPS_ErhartJuslinGoy_2006_ZnO__MO_616776018688_004.txz | Tar+XZ | Linux and OS X archive |
| Tersoff_LAMMPS_ErhartJuslinGoy_2006_ZnO__MO_616776018688_004.zip | Zip | Windows archive |
This Model requires a Model Driver. Archives for the Model Driver Tersoff_LAMMPS__MD_077075034781_005 appear below.
| Tersoff_LAMMPS__MD_077075034781_005.txz | Tar+XZ | Linux and OS X archive |
| Tersoff_LAMMPS__MD_077075034781_005.zip | Zip | Windows archive |