Sim_LAMMPS_ReaxFF_AryanpourVanDuinKubicki_2010_FeHO__SM_222964216001_001
| Title
A single sentence description.
|
LAMMPS ReaxFF potential for Fe-H-O systems developed by Aryanpour, van Duin, and Kubicki (2010) v001 |
|---|---|
| Description | LAMMPS ReaxFF potential for Fe-H-O systems ('pair_style reaxff' with potential file ffield.reax.Fe_O_C_H and additional control and charge equilibration information). The initial force field parameters for the Fe-Fe parameters were taken from an earlier force field development project on bulk-iron metal, based on DFT-calculations on antiferromagnetic BCC and FCC. The DFT data can be found in Ref 31 of the above-mentioned manuscript. The O/H parameters were taken from the ReaxFF bulk water description. The Fe/Fe and O/H parameters were kept fixed to these initial values, whereas the Fe/O parameters were reoptimized against the quantum mechanical results presented in the above-mentioned manuscript. |
| Species
The supported atomic species.
| Fe, H, O |
| Disclaimer
A statement of applicability provided by the contributor, informing users of the intended use of this KIM Item.
|
None |
| Content Origin | LAMMPS package 29-Feb-2019 |
| Contributor |
Ellad B. Tadmor |
| Maintainer |
Ellad B. Tadmor |
| Developer |
Masoud Aryanpour Adri C. T. van Duin James Kubicki |
| Published on KIM | 2020 |
| How to Cite |
This Simulator Model originally published in [1] is archived in OpenKIM [2-4]. [1] Aryanpour M, Duin ACT van, Kubicki JD. Development of a Reactive Force Field for Iron–Oxyhydroxide Systems. Journal of Physical Chemistry A. 2010;114(21):6298–307. doi:10.1021/jp101332k — (Primary Source) A primary source is a reference directly related to the item documenting its development, as opposed to other sources that are provided as background information. [2] Aryanpour M, Duin ACT van, Kubicki J. LAMMPS ReaxFF potential for Fe-H-O systems developed by Aryanpour, van Duin, and Kubicki (2010) v001. OpenKIM; 2020. doi:10.25950/9d8caa79 [3] Tadmor EB, Elliott RS, Sethna JP, Miller RE, Becker CA. The potential of atomistic simulations and the Knowledgebase of Interatomic Models. JOM. 2011;63(7):17. doi:10.1007/s11837-011-0102-6 [4] Elliott RS, Tadmor EB. Knowledgebase of Interatomic Models (KIM) Application Programming Interface (API). OpenKIM; 2011. doi:10.25950/ff8f563a Click here to download the above citation in BibTeX format. |
| Citations
This panel presents information regarding the papers that have cited the interatomic potential (IP) whose page you are on. The OpenKIM machine learning based Deep Citation framework is used to determine whether the citing article actually used the IP in computations (denoted by "USED") or only provides it as a background citation (denoted by "NOT USED"). For more details on Deep Citation and how to work with this panel, click the documentation link at the top of the panel. The word cloud to the right is generated from the abstracts of IP principle source(s) (given below in "How to Cite") and the citing articles that were determined to have used the IP in order to provide users with a quick sense of the types of physical phenomena to which this IP is applied. The bar chart shows the number of articles that cited the IP per year. Each bar is divided into green (articles that USED the IP) and blue (articles that did NOT USE the IP). Users are encouraged to correct Deep Citation errors in determination by clicking the speech icon next to a citing article and providing updated information. This will be integrated into the next Deep Citation learning cycle, which occurs on a regular basis. OpenKIM acknowledges the support of the Allen Institute for AI through the Semantic Scholar project for providing citation information and full text of articles when available, which are used to train the Deep Citation ML algorithm. |
This panel provides information on past usage of this interatomic potential (IP) powered by the OpenKIM Deep Citation framework. The word cloud indicates typical applications of the potential. The bar chart shows citations per year of this IP (bars are divided into articles that used the IP (green) and those that did not (blue)). The complete list of articles that cited this IP is provided below along with the Deep Citation determination on usage. See the Deep Citation documentation for more information. 
Help us to determine which of the papers that cite this potential actually used it to perform calculations. If you know, click the .
|
| Funding | Not available |
| Short KIM ID
The unique KIM identifier code.
| SM_222964216001_001 |
| Extended KIM ID
The long form of the KIM ID including a human readable prefix (100 characters max), two underscores, and the Short KIM ID. Extended KIM IDs can only contain alpha-numeric characters (letters and digits) and underscores and must begin with a letter.
| Sim_LAMMPS_ReaxFF_AryanpourVanDuinKubicki_2010_FeHO__SM_222964216001_001 |
| DOI |
10.25950/9d8caa79 https://doi.org/10.25950/9d8caa79 https://commons.datacite.org/doi.org/10.25950/9d8caa79 |
| KIM Item Type | Simulator Model |
| KIM API Version | 2.1 |
| Simulator Name
The name of the simulator as defined in kimspec.edn.
| LAMMPS |
| Potential Type | reax |
| Simulator Potential | reaxff |
| Run Compatibility | portable-models |
| Previous Version | Sim_LAMMPS_ReaxFF_AryanpourVanDuinKubicki_2010_FeHO__SM_222964216001_000 |
| Grade | Name | Category | Brief Description | Full Results | Aux File(s) |
|---|---|---|---|---|---|
| P | vc-species-supported-as-stated | mandatory | The model supports all species it claims to support; see full description. |
Results | Files |
| F | vc-periodicity-support | mandatory | Periodic boundary conditions are handled correctly; see full description. |
Results | Files |
| F | vc-permutation-symmetry | mandatory | Total energy and forces are unchanged when swapping atoms of the same species; see full description. |
Results | Files |
| D | vc-forces-numerical-derivative | consistency | Forces computed by the model agree with numerical derivatives of the energy; see full description. |
Results | Files |
| F | vc-dimer-continuity-c1 | informational | The energy versus separation relation of a pair of atoms is C1 continuous (i.e. the function and its first derivative are continuous); see full description. |
Results | Files |
| F | vc-objectivity | informational | Total energy is unchanged and forces transform correctly under rigid-body translation and rotation; see full description. |
Results | Files |
| F | vc-inversion-symmetry | informational | Total energy is unchanged and forces change sign when inverting a configuration through the origin; see full description. |
Results | Files |
| F | vc-memory-leak | informational | The model code does not have memory leaks (i.e. it releases all allocated memory at the end); see full description. |
Results | Files |
| N/A | vc-thread-safe | mandatory | The model returns the same energy and forces when computed in serial and when using parallel threads for a set of configurations. Note that this is not a guarantee of thread safety; see full description. |
Results | Files |
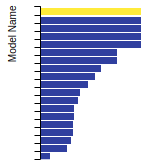
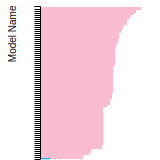
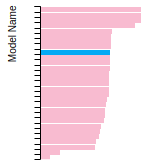
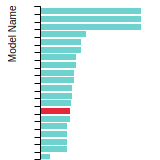
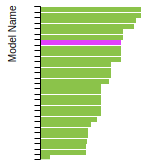
BCC Lattice Constant
This bar chart plot shows the mono-atomic body-centered cubic (bcc) lattice constant predicted by the current model (shown in the unique color) compared with the predictions for all other models in the OpenKIM Repository that support the species. The vertical bars show the average and standard deviation (one sigma) bounds for all model predictions. Graphs are generated for each species supported by the model.
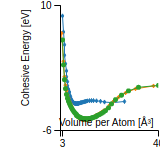
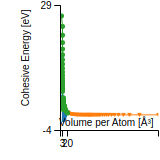
Cohesive Energy Graph
This graph shows the cohesive energy versus volume-per-atom for the current mode for four mono-atomic cubic phases (body-centered cubic (bcc), face-centered cubic (fcc), simple cubic (sc), and diamond). The curve with the lowest minimum is the ground state of the crystal if stable. (The crystal structure is enforced in these calculations, so the phase may not be stable.) Graphs are generated for each species supported by the model.
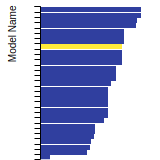
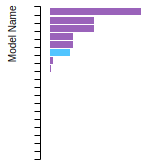
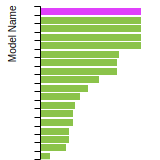
Diamond Lattice Constant
This bar chart plot shows the mono-atomic face-centered diamond lattice constant predicted by the current model (shown in the unique color) compared with the predictions for all other models in the OpenKIM Repository that support the species. The vertical bars show the average and standard deviation (one sigma) bounds for all model predictions. Graphs are generated for each species supported by the model.
Dislocation Core Energies
This graph shows the dislocation core energy of a cubic crystal at zero temperature and pressure for a specific set of dislocation core cutoff radii. After obtaining the total energy of the system from conjugate gradient minimizations, non-singular, isotropic and anisotropic elasticity are applied to obtain the dislocation core energy for each of these supercells with different dipole distances. Graphs are generated for each species supported by the model.
(No matching species)FCC Elastic Constants
This bar chart plot shows the mono-atomic face-centered cubic (fcc) elastic constants predicted by the current model (shown in blue) compared with the predictions for all other models in the OpenKIM Repository that support the species. The vertical bars show the average and standard deviation (one sigma) bounds for all model predictions. Graphs are generated for each species supported by the model.
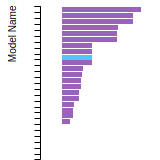
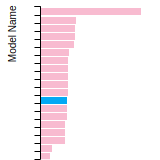
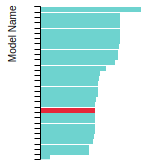
FCC Lattice Constant
This bar chart plot shows the mono-atomic face-centered cubic (fcc) lattice constant predicted by the current model (shown in red) compared with the predictions for all other models in the OpenKIM Repository that support the species. The vertical bars show the average and standard deviation (one sigma) bounds for all model predictions. Graphs are generated for each species supported by the model.
FCC Stacking Fault Energies
This bar chart plot shows the intrinsic and extrinsic stacking fault energies as well as the unstable stacking and unstable twinning energies for face-centered cubic (fcc) predicted by the current model (shown in blue) compared with the predictions for all other models in the OpenKIM Repository that support the species. The vertical bars show the average and standard deviation (one sigma) bounds for all model predictions. Graphs are generated for each species supported by the model.
(No matching species)FCC Surface Energies
This bar chart plot shows the mono-atomic face-centered cubic (fcc) relaxed surface energies predicted by the current model (shown in blue) compared with the predictions for all other models in the OpenKIM Repository that support the species. The vertical bars show the average and standard deviation (one sigma) bounds for all model predictions. Graphs are generated for each species supported by the model.
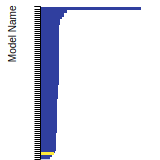
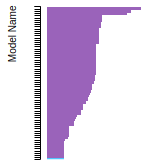
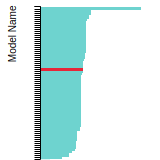
(No matching species)SC Lattice Constant
This bar chart plot shows the mono-atomic simple cubic (sc) lattice constant predicted by the current model (shown in the unique color) compared with the predictions for all other models in the OpenKIM Repository that support the species. The vertical bars show the average and standard deviation (one sigma) bounds for all model predictions. Graphs are generated for each species supported by the model.
Cubic Crystal Basic Properties Table
Species: FeSpecies: H
Species: O
Creators:
Contributor: karls
Publication Year: 2019
DOI: https://doi.org/10.25950/64cb38c5
This Test Driver uses LAMMPS to compute the cohesive energy of a given monoatomic cubic lattice (fcc, bcc, sc, or diamond) at a variety of lattice spacings. The lattice spacings range from a_min (=a_min_frac*a_0) to a_max (=a_max_frac*a_0) where a_0, a_min_frac, and a_max_frac are read from stdin (a_0 is typically approximately equal to the equilibrium lattice constant). The precise scaling and number of lattice spacings sampled between a_min and a_0 (a_0 and a_max) is specified by two additional parameters passed from stdin: N_lower and samplespacing_lower (N_upper and samplespacing_upper). Please see README.txt for further details.
| Test | Test Results | Link to Test Results page | Benchmark time
Usertime multiplied by the Whetstone Benchmark. This number can be used (approximately) to compare the performance of different models independently of the architecture on which the test was run.
Measured in Millions of Whetstone Instructions (MWI) |
|---|---|---|---|
| Cohesive energy versus lattice constant curve for bcc Fe v004 | view | 33276 | |
| Cohesive energy versus lattice constant curve for bcc O v003 | view | 1822 | |
| Cohesive energy versus lattice constant curve for diamond Fe v004 | view | 47117 | |
| Cohesive energy versus lattice constant curve for diamond O v004 | view | 27540 | |
| Cohesive energy versus lattice constant curve for fcc Fe v004 | view | 25989 | |
| Cohesive energy versus lattice constant curve for fcc O v004 | view | 51534 | |
| Cohesive energy versus lattice constant curve for sc O v004 | view | 3902 |
Creators: Junhao Li and Ellad Tadmor
Contributor: tadmor
Publication Year: 2019
DOI: https://doi.org/10.25950/5853fb8f
Computes the cubic elastic constants for some common crystal types (fcc, bcc, sc, diamond) by calculating the hessian of the energy density with respect to strain. An estimate of the error associated with the numerical differentiation performed is reported.
Creators:
Contributor: ilia
Publication Year: 2024
DOI: https://doi.org/10.25950/2f2c4ad3
Computes the equilibrium crystal structure and energy for an arbitrary crystal at zero temperature and applied stress by performing symmetry-constrained relaxation. The crystal structure is specified using the AFLOW prototype designation. Multiple sets of free parameters corresponding to the crystal prototype may be specified as initial guesses for structure optimization. No guarantee is made regarding the stability of computed equilibria, nor that any are the ground state.
Creators: Brandon Runnels
Contributor: brunnels
Publication Year: 2019
DOI: https://doi.org/10.25950/4723cee7
Computes grain boundary energy for a range of tilt angles given a crystal structure, tilt axis, and material.
| Test | Test Results | Link to Test Results page | Benchmark time
Usertime multiplied by the Whetstone Benchmark. This number can be used (approximately) to compare the performance of different models independently of the architecture on which the test was run.
Measured in Millions of Whetstone Instructions (MWI) |
|---|---|---|---|
| Relaxed energy as a function of tilt angle for a 100 symmetric tilt grain boundary in bcc Fe v000 | view | 102476612 | |
| Relaxed energy as a function of tilt angle for a 110 symmetric tilt grain boundary in bcc Fe v000 | view | 225122898 | |
| Relaxed energy as a function of tilt angle for a 111 symmetric tilt grain boundary in bcc Fe v000 | view | 136556247 | |
| Relaxed energy as a function of tilt angle for a 112 symmetric tilt grain boundary in bcc Fe v000 | view | 433857563 | |
| Relaxed energy as a function of tilt angle for a 100 symmetric tilt grain boundary in fcc Fe v000 | view | 964940358 |
Creators: Daniel S. Karls and Junhao Li
Contributor: karls
Publication Year: 2019
DOI: https://doi.org/10.25950/2765e3bf
Equilibrium lattice constant and cohesive energy of a cubic lattice at zero temperature and pressure.
Creators:
Contributor: mjwen
Publication Year: 2024
DOI: https://doi.org/10.25950/9d9822ec
This Test Driver uses LAMMPS to compute the linear thermal expansion coefficient at a finite temperature under a given pressure for a cubic lattice (fcc, bcc, sc, diamond) of a single given species.
| Test | Test Results | Link to Test Results page | Benchmark time
Usertime multiplied by the Whetstone Benchmark. This number can be used (approximately) to compare the performance of different models independently of the architecture on which the test was run.
Measured in Millions of Whetstone Instructions (MWI) |
|---|---|---|---|
| Linear thermal expansion coefficient of bcc Fe at 293.15 K under a pressure of 0 MPa v002 | view | 10626162 |
Creators: Matt Bierbaum
Contributor: mattbierbaum
Publication Year: 2019
DOI: https://doi.org/10.25950/6c43a4e6
Calculates the surface energy of several high symmetry surfaces and produces a broken-bond model fit. In latex form, the fit equations are given by:
E_{FCC} (\vec{n}) = p_1 (4 \left( |x+y| + |x-y| + |x+z| + |x-z| + |z+y| +|z-y|\right)) + p_2 (8 \left( |x| + |y| + |z|\right)) + p_3 (2 ( |x+ 2y + z| + |x+2y-z| + |x-2y + z| + |x-2y-z| + |2x+y+z| + |2x+y-z| +|2x-y+z| +|2x-y-z| +|x+y+2z| +|x+y-2z| +|x-y+2z| +|x-y-2z| ) + c
E_{BCC} (\vec{n}) = p_1 (6 \left( | x+y+z| + |x+y-z| + |-x+y-z| + |x-y+z| \right)) + p_2 (8 \left( |x| + |y| + |z|\right)) + p_3 (4 \left( |x+y| + |x-y| + |x+z| + |x-z| + |z+y| +|z-y|\right)) +c.
In Python, these two fits take the following form:
def BrokenBondFCC(params, index):
import numpy
x, y, z = index
x = x / numpy.sqrt(x**2.+y**2.+z**2.)
y = y / numpy.sqrt(x**2.+y**2.+z**2.)
z = z / numpy.sqrt(x**2.+y**2.+z**2.)
return params[0]*4* (abs(x+y) + abs(x-y) + abs(x+z) + abs(x-z) + abs(z+y) + abs(z-y)) + params[1]*8*(abs(x) + abs(y) + abs(z)) + params[2]*(abs(x+2*y+z) + abs(x+2*y-z) +abs(x-2*y+z) +abs(x-2*y-z) + abs(2*x+y+z) +abs(2*x+y-z) +abs(2*x-y+z) +abs(2*x-y-z) + abs(x+y+2*z) +abs(x+y-2*z) +abs(x-y+2*z) +abs(x-y-2*z))+params[3]
def BrokenBondBCC(params, x, y, z):
import numpy
x, y, z = index
x = x / numpy.sqrt(x**2.+y**2.+z**2.)
y = y / numpy.sqrt(x**2.+y**2.+z**2.)
z = z / numpy.sqrt(x**2.+y**2.+z**2.)
return params[0]*6*(abs(x+y+z) + abs(x-y-z) + abs(x-y+z) + abs(x+y-z)) + params[1]*8*(abs(x) + abs(y) + abs(z)) + params[2]*4* (abs(x+y) + abs(x-y) + abs(x+z) + abs(x-z) + abs(z+y) + abs(z-y)) + params[3]
| Test | Test Results | Link to Test Results page | Benchmark time
Usertime multiplied by the Whetstone Benchmark. This number can be used (approximately) to compare the performance of different models independently of the architecture on which the test was run.
Measured in Millions of Whetstone Instructions (MWI) |
|---|---|---|---|
| Broken-bond fit of high-symmetry surface energies in bcc Fe v004 | view | 572273 |
Creators:
Contributor: efuem
Publication Year: 2023
DOI: https://doi.org/10.25950/c27ba3cd
Computes the monovacancy formation and migration energies for cubic and hcp monoatomic crystals.
| Test | Test Results | Link to Test Results page | Benchmark time
Usertime multiplied by the Whetstone Benchmark. This number can be used (approximately) to compare the performance of different models independently of the architecture on which the test was run.
Measured in Millions of Whetstone Instructions (MWI) |
|---|---|---|---|
| Vacancy formation and migration energy for bcc Fe | view | 8435658 | |
| Vacancy formation and migration energy for sc O | view | 8158035 |
| Test | Error Categories | Link to Error page |
|---|---|---|
| Cohesive energy versus lattice constant curve for bcc Fe v004 | other | view |
| Cohesive energy versus lattice constant curve for bcc O v004 | other | view |
| Cohesive energy versus lattice constant curve for diamond Fe v004 | other | view |
| Cohesive energy versus lattice constant curve for fcc Fe v004 | other | view |
EquilibriumCrystalStructure__TD_457028483760_000
EquilibriumCrystalStructure__TD_457028483760_002
GrainBoundaryCubicCrystalSymmetricTiltRelaxedEnergyVsAngle__TD_410381120771_002
LatticeConstantCubicEnergy__TD_475411767977_007
| Test | Error Categories | Link to Error page |
|---|---|---|
| Equilibrium zero-temperature lattice constant for sc Fe v007 | other | view |
LatticeConstantHexagonalEnergy__TD_942334626465_005
| Test | Error Categories | Link to Error page |
|---|---|---|
| Equilibrium lattice constants for hcp Fe v005 | other | view |
| Equilibrium lattice constants for hcp H v005 | other | view |
| Equilibrium lattice constants for hcp O v005 | other | view |
VacancyFormationEnergyRelaxationVolume__TD_647413317626_001
| Test | Error Categories | Link to Error page |
|---|---|---|
| Monovacancy formation energy and relaxation volume for bcc Fe | other | view |
| Monovacancy formation energy and relaxation volume for sc O | other | view |
No Driver
| Verification Check | Error Categories | Link to Error page |
|---|---|---|
| MemoryLeak__VC_561022993723_004 | other | view |
| PeriodicitySupport__VC_895061507745_004 | other | view |
| Sim_LAMMPS_ReaxFF_AryanpourVanDuinKubicki_2010_FeHO__SM_222964216001_001.txz | Tar+XZ | Linux and OS X archive |
| Sim_LAMMPS_ReaxFF_AryanpourVanDuinKubicki_2010_FeHO__SM_222964216001_001.zip | Zip | Windows archive |